
Let's be honest, the stock market isn't just about numbers and spreadsheets. It's a swirling cauldron of human emotion, and two feelings dominate all others: fear and greed. The Fear & Greed Index is a brilliant tool that acts like a thermometer for this emotional climate, boiling down a ton of complex data into a simple 0 to 100 score.
Think of it as a quick sentiment check. It tells you whether the investing crowd is running for the hills in a panic or diving headfirst into the market with abandon.
What the Fear and Greed Index Reveals About the Market
The index, created by CNNMoney, was designed to measure how much these two powerful emotions are influencing investors' decisions. Are they buying aggressively out of greed, or are they panic-selling out of fear? The index gives us a clue.
The scale is straightforward:
- A score of 0 points to Extreme Fear. This is when investors are incredibly pessimistic, potentially selling off good assets along with the bad.
- A score of 100 signals Extreme Greed. This is pure euphoria, where investors might be getting a little too excited and pushing prices into bubble territory.
A Contrarian Investor's Thermometer
Here’s where the index gets really interesting, especially if you subscribe to a contrarian philosophy like Warren Buffett. The core idea is that when market sentiment hits an extreme, a reversal might be just around the corner.
When the index is screaming Extreme Fear, it can be a sign that assets are oversold and undervalued. This is when a savvy investor starts looking for bargains. On the flip side, when everyone is euphoric and the index shows Extreme Greed, it could be a warning that the market is overbought and due for a correction.
You can check out the live Fear and Greed Index from CNN to get a daily snapshot of where things stand.
As you can see in the image, the tool doesn't just give you today's number. It shows you the score from yesterday, last week, last month, and a year ago. This historical context is vital—it helps you see if sentiment is trending better or worse over time.
By keeping an eye on these emotional swings, you can get a better feel for whether the crowd is creating genuine opportunities or just dangerous risks.
For a quick reference, here’s a breakdown of what the different scores on the index generally mean.
Interpreting the Fear and Greed Index Scores
This table can serve as a handy guide when you're trying to figure out what a specific score might be telling you about the market's mood.
| Score Range | Sentiment Level | Potential Market Condition |
|---|---|---|
| 0-24 | Extreme Fear | Stocks may be undervalued; potential buying opportunity. |
| 25-44 | Fear | Investors are cautious; market may be trading below its value. |
| 45-55 | Neutral | No strong emotion driving the market either way. |
| 56-74 | Greed | Investors are optimistic; market could be getting frothy. |
| 75-100 | Extreme Greed | High euphoria; market may be overbought and due for a pullback. |
Remember, this is a gauge of sentiment, not a crystal ball. It’s most powerful when used alongside other forms of analysis to get a complete picture before making any decisions.
The Seven Drivers Behind the Index Score
To really get what the Fear & Greed Index is telling you, we need to pop the hood and see what makes it tick. That final score isn't just pulled out of thin air; it’s a weighted average of seven key market indicators. Each one is a puzzle piece, and when you put them all together, you get a surprisingly clear picture of what investors are feeling.
Think of it like an orchestra. One instrument can play a melody, but it takes all seven working in concert to create a symphony of market sentiment. Let’s break down each component to see how it adds to the final score.
Stock Market Momentum and Strength
First up, the index gauges the market's momentum. It does this by looking at the S&P 500 index and comparing it to its 125-day moving average. When the S&P 500 is trading well above that long-term average, it's a sign of strength and suggests greed is in the driver's seat. But when it dips below, it signals weakness and that fear might be creeping in.
Hand-in-hand with momentum is stock price strength. This metric simply counts the number of stocks on the New York Stock Exchange (NYSE) hitting 52-week highs versus those plumbing 52-week lows. It’s pretty straightforward: when a ton of stocks are hitting new highs, it’s a clear sign of bullish confidence (greed). When the list of 52-week lows gets longer, fear is winning.
The image below gives a great visual of how different market conditions, from high volatility to surging buy volume, feed into either fear or greed.
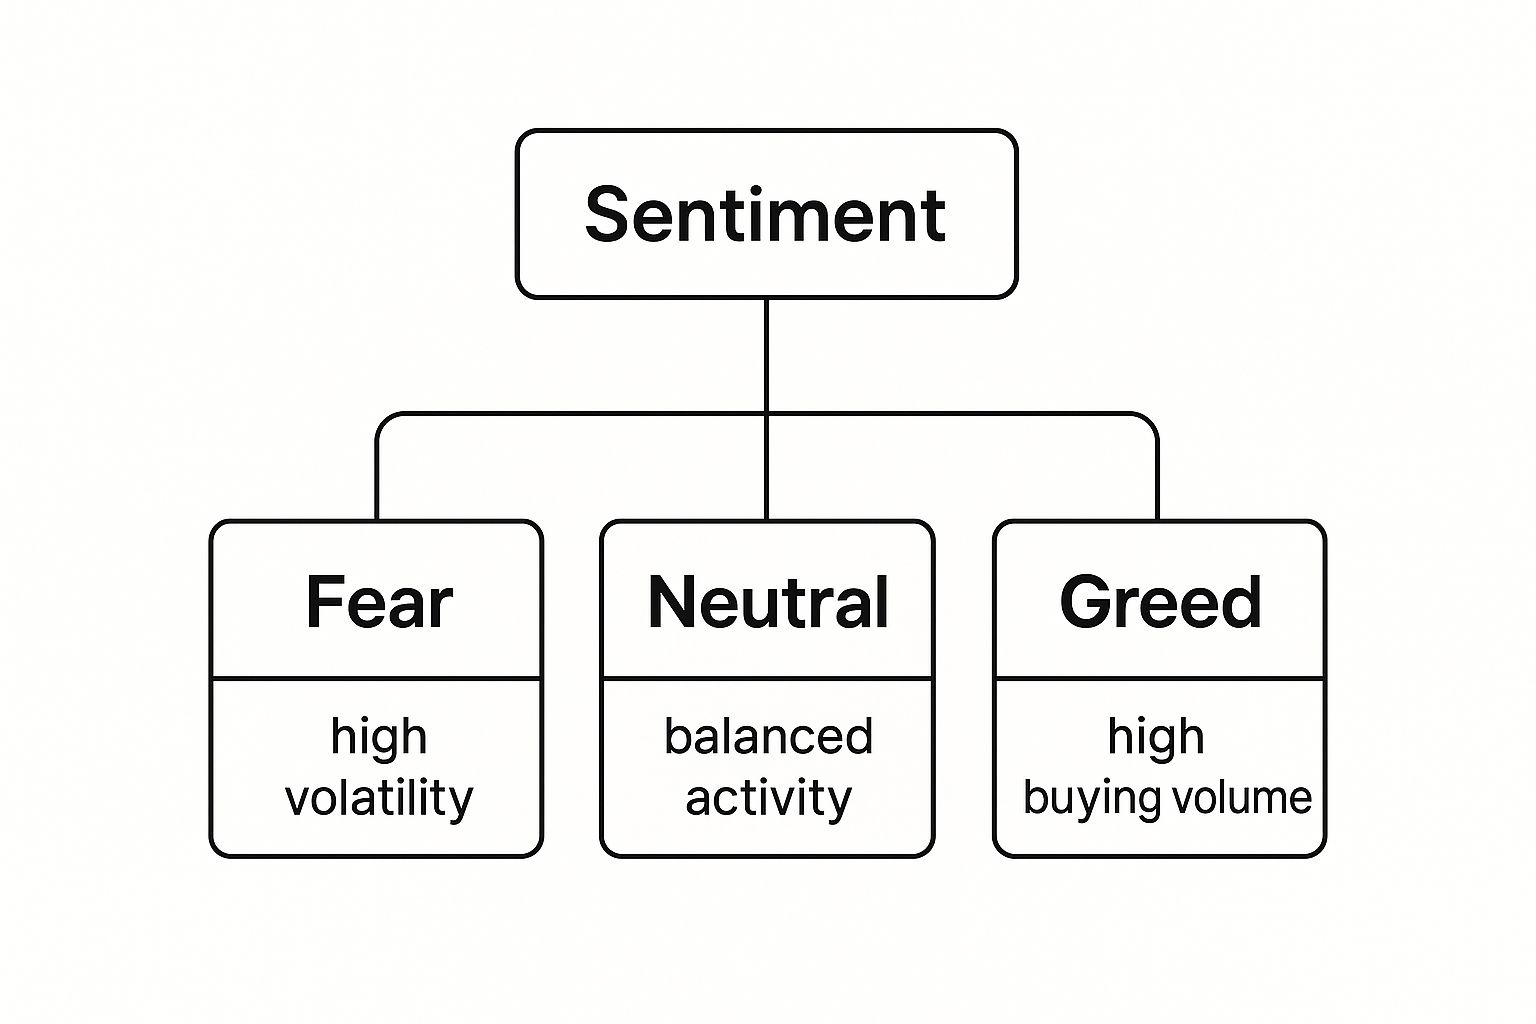
You can see how fear is all about volatility and panic, while greed is tied to high volume and aggressive buying, with a neutral market sitting in the middle.
Trading Volume and Options Activity
Next, the index checks stock price breadth. This sounds complicated, but it just looks at the trading volume of stocks that are going up versus those that are going down. When the volume in rising stocks is way heavier than in falling ones, it tells you buyers are getting aggressive and jumping into the market with both feet—a classic sign of greed.
Another hugely important piece of the puzzle is the options market, specifically the put/call ratio. Here’s a quick primer:
- Put options are bets that an asset’s price will fall.
- Call options are bets that an asset’s price will rise.
When the put/call ratio climbs, it means more traders are buying puts, either to protect their portfolios or to bet on a decline. That’s a textbook indicator of fear. A low ratio, on the other hand, means call buying is hot, signaling widespread optimism and greed.
A sudden spike in the put/call ratio has always been one of the most reliable tells for rising fear. When everyone rushes to buy insurance against a market drop, it speaks volumes about the anxiety simmering just beneath the surface.
Volatility and Demand for Safety
You can't talk about fear without talking about volatility. The Fear & Greed Index uses the CBOE Volatility Index (VIX) for this, which is famously known as the market's "fear gauge." The VIX essentially measures the market’s best guess on volatility over the next 30 days. When the VIX shoots up, fear and uncertainty are on the rise. When it’s low and quiet, it often signals complacency or greed.
Finally, the index looks at how much risk traders are willing to take on by examining two different bond markets. The first is junk bond demand. This looks at the yield difference (or spread) between safe, investment-grade bonds and riskier junk bonds. When investors are feeling greedy, they don’t mind the extra risk and will accept a lower extra return for holding junk bonds, so the spread narrows. When they’re fearful, they demand a much bigger reward for the risk, and the spread widens.
The flip side of this is safe haven demand. This compares the returns of stocks against Treasury bonds over the last 20 trading days. If stocks are doing worse than boring old bonds, it means investors are ditching risk and running for the safety of government debt—a dead giveaway for fear. But if stocks are crushing bonds, it shows a healthy appetite for risk, which points straight to greed.
Turning Index Readings Into Actionable Insights
Knowing the daily score of the Fear & Greed Index is a great start, but it's just a number. The real magic happens when you translate that number into a strategic edge. When you learn to see what the emotional extremes are telling you, you can stop just watching the market and start using its mood to your advantage.
Think of the index as a contrarian compass. It doesn't give you a treasure map, but it points you toward opportunities the herd is running from and warns you about cliffs they're blindly running toward. The key is to see these emotional swings as signals to dig deeper, not as direct orders to buy or sell.
When Fear Creates Opportunity
When the index flashes "Extreme Fear"—usually a score below 25—pay close attention. This is a powerful signal that panic has taken the driver's seat. Investors are dumping assets, often without a second thought about a company’s actual health or long-term value. Their decisions are fueled by anxiety, not analysis.
This is exactly the kind of environment where legendary investors like Warren Buffett have made their fortunes. In these moments, even fundamentally solid, well-managed companies get dragged down with the rest of the market, their stock prices plummeting through no fault of their own.
That panic creates a potential window of opportunity for you. An Extreme Fear reading is your cue to:
- Start your research. This is the time to hunt for high-quality companies that are suddenly trading at a deep discount to what they're truly worth.
- Stay patient. Fear can stick around for a while. The goal isn't to perfectly time the bottom but to start accumulating great assets at bargain prices.
As Buffett famously put it, it pays to be "greedy when others are fearful." An Extreme Fear reading on the index is one of the clearest signs that fear has taken over, potentially putting incredible investments on sale.
Think back to the 2008 financial crisis. The index was stuck in Extreme Fear for what felt like an eternity. But investors who had the nerve to look past the widespread panic and buy into solid businesses were rewarded handsomely when the market eventually recovered. We saw the same pattern play out during the sharp, fear-fueled crash of March 2020.
When Greed Signals Caution
On the flip side, an "Extreme Greed" score—typically anything above 75—should act as a flashing yellow light. It’s a sign that euphoria has infected the market. Investors, driven by a serious case of FOMO (fear of missing out), are bidding up prices to levels that just aren't sustainable.
When greed is rampant, complacency sets in and risk management goes out the window. It's a classic setup for a market correction or a painful pullback. Now, this doesn't mean you should hit the "sell all" button immediately.
Instead, an Extreme Greed reading is your signal to get more defensive and a little more cautious. It's a good time to:
- Review your portfolio. Take a hard look at what you own. Are some of your positions looking a little too frothy or overextended?
- Take some profits. It's never a bad idea to lock in some gains on assets that have shot up in value. This helps reduce your overall risk.
- Tighten your stop-losses. Protect your profits and limit your downside by setting or adjusting your stop-loss orders.
A perfect historical example is the dot-com bubble in the late 1990s. That period was the definition of Extreme Greed, and the index would have been screaming a warning that the party was about to come to a screeching halt.
By learning to translate these scores into clear, actionable steps, the Fear & Greed Index becomes more than just a data point—it becomes an essential tool for navigating the market's emotional tides.
How the Index Performed During Major Market Events
Knowing the theory behind the Fear & Greed Index is one thing, but seeing it in action during a real-world market meltdown? That’s where its value truly clicks.
When you look at how the index behaved during pivotal moments in history—from euphoric rallies to gut-wrenching crashes—it proves it's more than just a sentiment gauge. It's a reliable barometer for the market’s emotional state, even under the most extreme pressure.
Think of it as a historical record of market psychology. During the 2008 financial crisis, as credit markets froze and fear gripped Wall Street, the index plummeted to a score of 12. It was a clear signal of profound panic. We saw it again in March 2020 as the COVID-19 pandemic swept the globe. The index hit historic lows, perfectly capturing the terror that had taken over the markets.
Historically, these moments of "Extreme Fear" have lined up with major market bottoms. They were the once-in-a-generation buying opportunities for investors who could see past the chaos.
A Tale of Two Years: Greed vs. Fear
The contrast between different years really highlights the index's usefulness. Just look at the historical data, and you'll get a crystal-clear picture of how dramatically the market's mood can swing.
An analysis of over 2,500 trading days between 2011 and early 2025 shows a median index value of 51. Over the long haul, sentiment seems pretty balanced. But individual years? They tell a much more dramatic story.
Let’s look at two recent years to see what I mean:
- 2022: A Year of Fear – This year was defined by uncertainty. We had pandemic aftershocks and geopolitical tensions rattling investors. The average index reading was a low 38.41. An astonishing 62% of all trading days were spent in either 'Fear' or 'Extreme Fear,' which perfectly reflected the risk-averse environment.
- 2023: A Year of Greed – What a difference a year makes. As the market roared back, sentiment shifted dramatically. The average index value shot up to 57.27, with nearly 60% of trading days classified as 'Greed' or 'Extreme Greed.' Investor confidence was clearly back.
By putting a number on these emotional shifts, the index gives you invaluable context. It helps you see if the current market mood is just a blip or part of a bigger trend, which leads to smarter decisions.
This data-driven approach is what makes the index so powerful. It turns abstract feelings like "panic" and "optimism" into concrete numbers you can actually track and analyze.
Whether you’re looking at short-term moves or long-term trends, understanding the fear and greed index stock market performance provides a much clearer perspective. This historical context is essential for putting today's market into perspective, helping you navigate whatever comes next with greater confidence.
Integrating The Index Into Your Trading Strategy

Alright, now for the fun part. Knowing what the Fear & Greed Index is is one thing, but actually putting it to work is where it becomes a real game-changer. This is how you move from just watching the market to using its emotional tides to your advantage.
The classic way to use the index is as a contrarian tool. It’s the perfect way to apply Warren Buffett's famous advice to be "greedy when others are fearful." The index gives you a clear, data-driven signal that lets you spot when fear or greed has gone off the rails, often flagging turning points the rest of the market completely misses.
Capitalizing On Extreme Fear
When the index drops into "Extreme Fear," it's a neon sign that panic selling has taken over. Investors are dumping stocks left and right, often throwing the good out with the bad. This isn't the time to follow the herd off the cliff; it’s your cue to start looking for gold in the wreckage.
An "Extreme Fear" reading should trigger you to:
- Go bargain hunting: Start digging into strong companies that got unfairly hammered in the sell-off.
- Check the fundamentals: Look for businesses with solid balance sheets, steady profits, and a real competitive edge that are suddenly on sale.
Think of it like a flash sale on Wall Street. When fear is peaking, high-quality assets are often on the clearance rack. This is your moment to get greedy, carefully picking up shares in great companies while everyone else is too scared to act.
But let's be crystal clear: The Fear & Greed Index is a confirmation layer, not a crystal ball. It tells you the environment is ripe for opportunity, but it’s no substitute for rolling up your sleeves and doing your own research.
Navigating Moments Of Extreme Greed
On the flip side, when the index spikes into "Extreme Greed," it’s a warning that euphoria and FOMO (fear of missing out) are running wild. Investors are chasing hype, and asset prices can get pushed to levels that just don't make sense. Now is the time to be fearful—or at the very least, extremely cautious.
When "Extreme Greed" is in the air, it’s a good time to get defensive:
- Review your portfolio: Take a hard look at your positions. Which ones have run up a little too far, too fast? Where do valuations look bubbly?
- Take some profits off the table: There’s no shame in locking in gains. Selling a portion of a big winner reduces your risk without getting out of the game completely.
- Tighten your stop-losses: This is non-negotiable. Protect your capital and your profits by setting or raising your stop-loss orders.
Looking back, the index has a pretty impressive track record of calling these emotional tops and bottoms. It sank to 12 during the 2008 financial crisis and hit a rock-bottom 2 at the start of the COVID-19 pandemic—both classic signals of widespread panic. Conversely, it shot past 80 during the 2017 tech rally, flagging that euphoric peak perfectly.
When you blend these emotional insights with your own trading strategy, you can start making decisions with a lot more confidence. For a deeper dive into specific tactics, check out our complete understanding the fear and greed index trading guide.
Using the Crypto Fear and Greed Index
If you think the stock market is a rollercoaster, the crypto market is a rocket ship strapped to that rollercoaster. The emotional swings are intense, which is exactly why a specialized Crypto Fear & Greed Index had to be created.
It takes the same core idea as the original index—measuring market sentiment—but tunes it specifically for the wild world of digital assets. This tool is essential for navigating everything from a gut-wrenching panic sell-off to the kind of euphoric FOMO (fear of missing out) that ignites massive bull runs.
While the traditional index might look at something like bond demand, the crypto version zeroes in on signals unique to its ecosystem, like social media buzz and Bitcoin's market dominance, to get a true pulse on investor psychology.
The Crypto Fear & Greed Index isn't just a fascinating number to watch. It's a framework for thinking rationally in a market that's famous for being anything but. Think of it as your reality check when everyone else is losing their cool.
Reading the Crypto Market's Mood
Just like its stock market cousin, the crypto index uses a straightforward 0 to 100 scale. Low scores mean fear is gripping the market, while high scores signal that greed is running rampant. Smart traders use these readings to spot potential turning points long before the herd catches on.
- Extreme Fear (0-24): A score this low is a strong sign that investors are way too pessimistic. It often means assets like Bitcoin are oversold and possibly undervalued—a potential green light for contrarian investors to step in.
- Extreme Greed (75-100): When the needle swings this far, it’s a major warning. The market is likely overheated, driven more by hype than fundamentals, and could be heading for a correction.
The Fear and Greed Index is famously potent in the crypto world, where emotions don't just influence prices—they exaggerate them. For example, back in 2020, during a period of huge volatility before a Bitcoin halving event, the index helped signal a coming rally that eventually pushed the price toward $18,000. You can find more details about the Bitcoin news from that period on StatOperator.com.
By learning to read these signals, you can start to detach from the market's emotional chaos and make clearer decisions. Want to see where things stand right now? You can track the fear & greed index crypto market in real-time.
Of course. Here is the rewritten section, crafted to sound completely human-written and natural, following the style and tone of the provided examples.
Common Pitfalls and How to Avoid Them
If you want to use the Fear & Greed Index effectively, you have to respect its limits. The single biggest mistake traders make is treating it like a crystal ball. It’s not. The index is a reactive tool, not a predictive one—it shows you the market's current mood, but it can’t tell you with any certainty what will happen next.
Think of it like a weather report. It tells you it's raining now, but it doesn't guarantee sunshine tomorrow.
The Danger of Ignoring Momentum
One of the easiest traps to fall into is underestimating just how long an emotional extreme can last. You see the index hit "Extreme Fear," and it's tempting to dive in headfirst, thinking a rebound is right around the corner. On the flip side, an "Extreme Greed" reading might make you want to cash out everything.
But here's the thing: markets can stay irrational longer than you can stay solvent. A reading of "Extreme Greed" in a raging bull market might just be the market catching its breath before the next climb. In the same way, a nasty bear market can wallow in "Extreme Fear" for weeks, or even months, on end.
The key takeaway is this: An extreme reading on the Fear and Greed Index does not guarantee an immediate market reversal. It is a signal to pay attention, not a command to act.
Best Practices for Grounded Decisions
So, how do you avoid these traps? Simple: you build the index into a disciplined, balanced strategy. You never, ever use it in a vacuum.
Instead, follow these best practices to keep your feet on the ground:
- Use it for Confirmation, Not Initiation: Let your own analysis—whether it's technical or fundamental—spot a potential trade first. Then, pull up the index as a final gut check. Does the market sentiment back up your idea?
- Always Pair with Analysis: An "Extreme Fear" reading is pretty useless on its own. You need context. Is that company you're eyeing fundamentally solid but just got dragged down by panic? Or is it actually in deep trouble? Your own research is what provides that crucial answer.
- Maintain a Long-Term Outlook: Don't get whiplash reacting to every little daily tick of the index. Instead, look at its longer-term trends, like the weekly or monthly view, to get a real feel for the broader market climate. That’s how you make smart decisions that line up with your actual goals.
By understanding these common slip-ups and using the index as one thoughtful piece of a much larger puzzle, you can turn market emotion from a source of risk into a genuine advantage.
Ready to stop guessing and start measuring market sentiment? With Fear Greed Tracker, you get real-time scores on over 50,000 assets, helping you make smarter, data-driven decisions. Check your favorite stock or crypto now.
Article created using Outrank