
When you hear people talk about crypto sentiment analysis, what they’re really talking about is gauging the market’s collective mood. It’s the process of tapping into the fear, greed, and excitement of millions of traders by looking at data from social media, news headlines, and forums. Think of it as a way to understand the emotional horsepower driving price movements, often giving you a heads-up on market shifts before traditional charts do.
Understanding the Market's Emotional Pulse
Imagine trying to navigate a chaotic street market with your eyes closed. You can hear the buzz of the crowd, but you have no idea if they’re stampeding toward a massive bargain or running away from a problem. That’s pretty much what trading crypto is like without a feel for market sentiment. You can see the price charts, but you’re missing the human element—the raw emotion—that makes those numbers jump and fall.
Crypto sentiment analysis is your way of opening your ears to that marketplace. It's about tuning into the whispers, the shouts, and the collective anxiety of the crowd to get a clear read on the overall mood. And that mood is a surprisingly powerful force, capable of pushing prices to irrational highs or sending them into a nosedive, often with little regard for an asset's actual value.
The Power of Crowd Psychology
At its heart, the crypto market runs on two primal emotions: fear and greed.
When greed takes over, you see FOMO (fear of missing out) kick in. Everyone piles into an asset, convinced it's their ticket to the moon, and prices soar. But when fear grips the market, it’s a different story. Panic selling starts a domino effect that can lead to a full-blown crash. These emotional swings aren't random; they're predictable patterns of human behavior.
By analyzing the collective psychology of the market, you can often get ahead of major moves. Sentiment analysis gives you a framework to measure these emotions, turning abstract feelings into concrete data that works alongside your technical charts.
This is especially critical in a market as wild as crypto. We’re talking about a global market valued at over $2.5 trillion, and a huge chunk of that is swayed by little more than public perception. Remember when Elon Musk simply added the #Bitcoin hashtag to his Twitter bio? The price shot up from $32,000 to $38,000 in a matter of hours. That single tweet shows just how much social media chatter and influential voices can rock the market. You can find more examples of how sentiment drives crypto prices over at AIMultiple.
Riding the Emotional Waves
Let's be clear: understanding crypto sentiment isn't about having a crystal ball. It’s about learning to ride the market’s emotional waves instead of getting wiped out by them. To do that, you need to keep an eye on a few key things that shape the overall mood:
- Social Media Buzz: What’s the volume and tone of conversations on platforms like X (formerly Twitter) and Reddit? Are people excited or terrified?
- News Headlines: Are major outlets publishing bullish or bearish stories? A single big headline can flip public opinion in an instant.
- Influencer Opinions: What are the big names in the crypto space saying? Their comments, for better or worse, can move markets.
By keeping tabs on these sources, you start to get a much clearer picture of whether the market is overly optimistic or dangerously pessimistic. It’s a skill that’s non-negotiable for anyone serious about navigating the volatile world of crypto.
The Building Blocks of Market Sentiment
So, how do we actually measure something as fuzzy as "market mood"? It's not about slapping a simple "positive" or "negative" label on the market. True crypto sentiment analysis is about breaking down abstract emotions like fear, greed, and excitement into concrete, measurable signals.
Think of it like being a detective. You don't just walk onto a crime scene and guess what happened. You look for hard evidence—fingerprints, witness statements, physical clues. Each piece tells a small part of a bigger story. In the crypto world, our evidence comes from different data sources that, when combined, paint a clear picture of the market's psychological state.
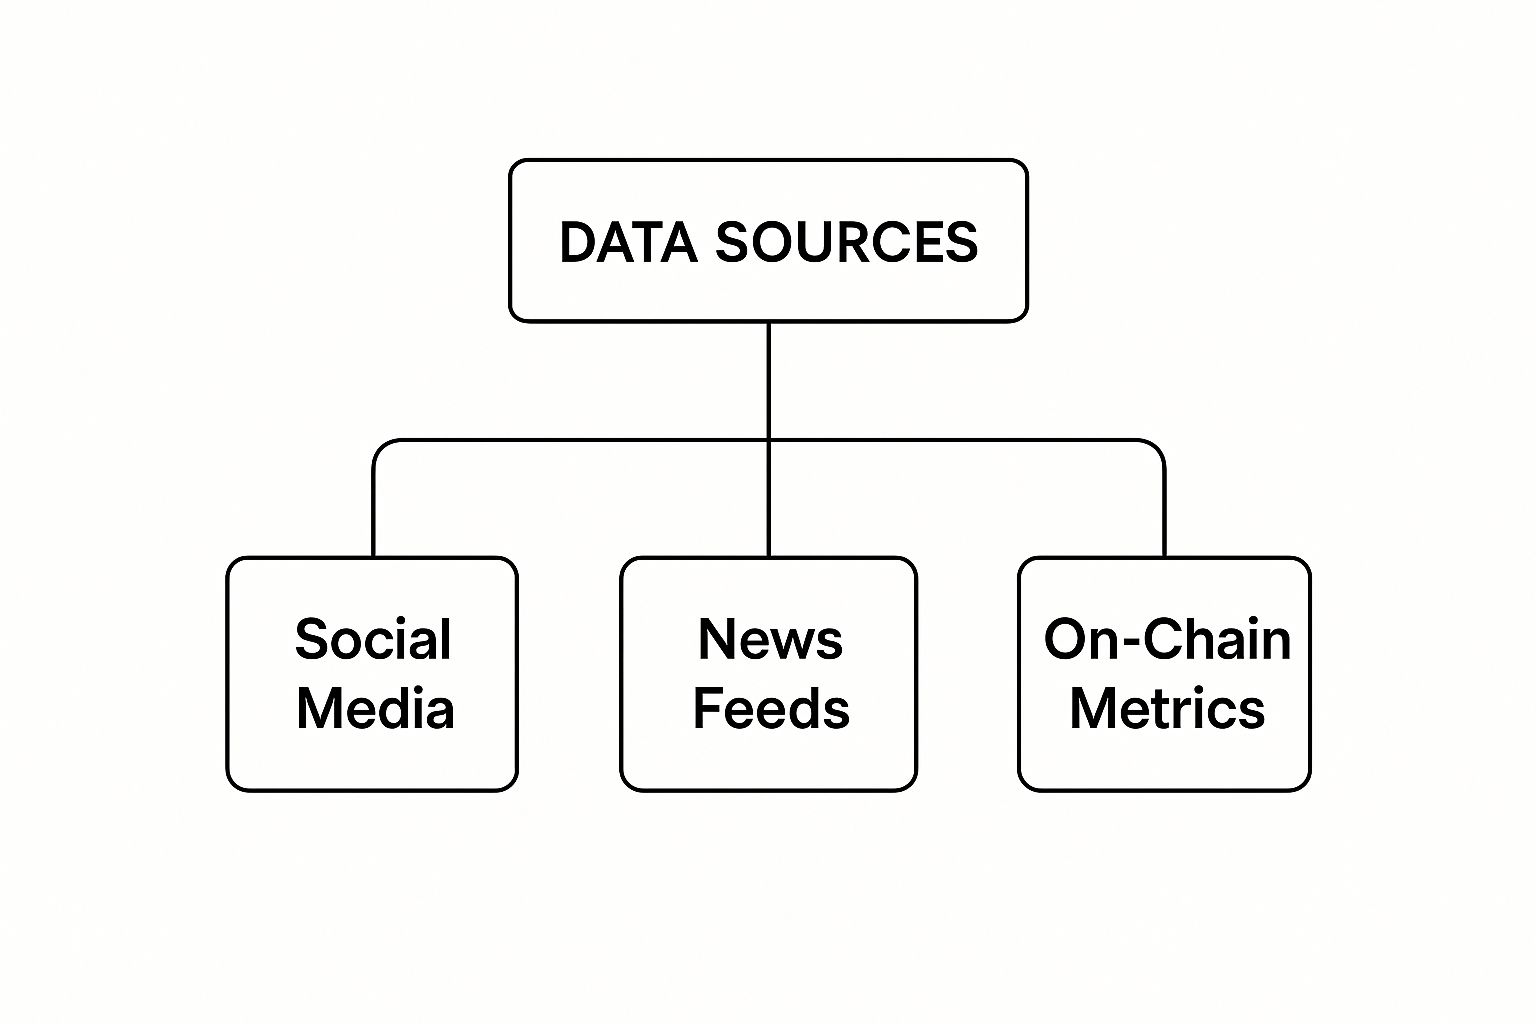
The core of any solid sentiment analysis rests on three main pillars: social media, news, and on-chain data.
Let's dig into what each of these building blocks really tells us.
Social Media: The Digital Town Square
Platforms like X (formerly Twitter), Reddit, and Telegram have become the bustling town squares of the crypto world. It's where millions of traders, die-hard believers, and vocal critics share their unfiltered thoughts in real-time. Tapping into this data is like listening in on the collective chatter of the entire market.
We’re looking for a few key things here:
- Mention Volume: How many people are suddenly talking about a specific coin? A huge spike can signal a new trend or a major event that’s grabbing everyone's attention.
- Sentiment Polarity: Is the conversation overwhelmingly positive (bullish) or are people panicking (bearish)? Good tools can even pick up on sarcasm and other nuances.
- Social Dominance: What slice of the entire crypto conversation is dedicated to one asset? When Bitcoin dominance is high, for example, it means the king is holding the market's focus.
Think of social media volume as the "chatter level" in a physical marketplace. A rising hum of excited voices often comes right before a price rally, while a wave of angry shouts can be a warning sign of a looming sell-off.
News Feeds: The Official Announcements
If social media is the crowd’s raw voice, news feeds are the official announcements blasting over the loudspeakers. Major financial outlets and crypto-native publications have a massive influence on perception and can easily trigger large-scale market moves.
News sentiment isn't just about the headline. It’s about the tone of the article, the credibility of the source, and how far and wide the story spreads. A single negative story about regulation from a trusted source can wipe out billions in market value almost instantly.
This data is vital because it often reflects what institutional players are thinking and can act as the catalyst that turns general crowd sentiment into hard market action.
On-Chain Metrics: Following the Money
While social media and news tell us what people are saying, on-chain data shows us what they're actually doing with their money. This is probably the most objective data source we have, since it tracks assets moving directly on the blockchain. It’s a transparent ledger showing exactly where the capital is flowing.
Key on-chain indicators to watch:
- Transaction Volume: Are more people using the network? A jump in on-chain transactions often points to growing interest and activity.
- Whale Activity: Are the biggest holders (whales) buying up more coins or dumping their bags? Their moves are often a powerful leading indicator.
- Exchange Inflows/Outflows: A flood of crypto moving onto exchanges usually means people are getting ready to sell. When it flows off exchanges and into private wallets, it suggests they’re in it for the long haul.
To get a grip on market sentiment, we need to look at data from all angles. We can't just listen to the social media chatter without also checking the news and, most importantly, following the money on-chain. Below is a quick breakdown of how these sources fit together.
Key Data Sources for Crypto Sentiment Analysis
This table breaks down the primary data streams used to measure market sentiment and the unique insights each one provides.
| Data Source | What It Measures | Example Insight |
|---|---|---|
| Social Media | The real-time, unfiltered opinions of retail traders and influencers. | A sudden 200% spike in mentions for a low-cap altcoin might signal a grassroots rally or a pump-and-dump scheme. |
| News & Media | The narratives shaped by established publications and institutional voices. | A series of positive articles about Ethereum’s scalability upgrades can build institutional confidence and drive investment. |
| On-Chain Data | The actual movement of capital and user activity on the blockchain. | A large outflow of Bitcoin from exchanges to private wallets suggests investors are accumulating for long-term holding. |
By weaving these three data sources together—the social buzz, the official narrative, and the on-chain evidence—we can build a much more reliable and actionable view of the market. To explore the platforms that do this heavy lifting, check out our guide on the top 10 best sentiment analysis tools in 2025.
How AI Makes Sense of All the Crypto Market Chatter
There’s an unbelievable amount of conversation about crypto happening online—millions of tweets, forum posts, and news articles every single day. Trying to keep up with it all manually is a fool's errand. This is where Artificial Intelligence (AI) and machine learning come in, acting like hyper-fluent translators for the market's constant digital buzz.
Think about trying to teach a computer not just to read words, but to feel them. It needs to get the sarcasm in a tweet, the hope in a Reddit post, or the flat-out panic in a news headline. That’s exactly what modern crypto sentiment analysis tools are built to do. They chew through mountains of data, filtering out the noise to find what really matters: the psychological pulse of the market.
The early days of sentiment analysis were, to put it mildly, a bit clumsy. Most tools just used a simple "good word/bad word" checklist. If a post mentioned "buy," "moon," or "bullish," it got a positive score. If it said "sell," "crash," or "scam," it was marked negative.
While that approach gives you a very rough idea, it's easily tricked. It misses all the subtlety of how people actually talk. A sentence like, "I would never sell my Bitcoin, this is a great buy," could get flagged as negative just for containing the word "sell."
The Leap to Actually Understanding Context
This is why today's top-tier systems rely on far more sophisticated AI. Models like BERT (Bidirectional Encoder Representations from Transformers) don't just see words in isolation; they understand how those words relate to each other in a sentence. They read the whole thing to get the real meaning.
This lets them tell the difference between genuine fear and a sarcastic joke—a crucial skill in the crypto world. They can figure out if "the market is on fire" means prices are rocketing up or if it means everything is burning down.
AI-powered sentiment analysis is like upgrading from a simple calculator to a supercomputer. One can do basic math, but the other can model complex systems, spot hidden patterns, and make incredibly accurate predictions because it understands the full context.
This technological jump is what makes modern sentiment tools so powerful. We've moved beyond simple word-counting to a genuinely nuanced reading of the market's collective mood.
How a Machine Learns to Speak "Crypto"
So, how does an AI get smart enough to understand crypto slang and market emotions? It all comes down to a training process using machine learning.
- Gather the Data: First, the system ingests a massive amount of crypto-related text from places like X (formerly Twitter), Reddit, and news sites.
- Teach It the Ropes: A chunk of this data is then labeled by actual humans. Analysts read through posts and tag them as positive, negative, or neutral. This creates a "ground truth" or answer key for the AI to learn from.
- Train the Model: The AI model studies this labeled data, learning the linguistic patterns tied to different feelings. It quickly figures out that "HODL" signals conviction, while "FUD" (Fear, Uncertainty, and Doubt) is a clear sign of negativity.
- Test and Refine: The model is then set loose on new, unlabeled data to see how well it does. Its accuracy is measured, and it's constantly tweaked to get better and adapt to new slang that pops up.
This is the exact process that allows platforms like Fear Greed Tracker to analyze over 50,000 assets in real-time. The AI does all the heavy lifting, giving you an immediate read on the market's vibe without you having to scroll through a single feed.
It’s Not Just About Simple Labels
The best sentiment analysis tools go even deeper. The choice of algorithm makes a huge difference, as different models interpret the same data in unique ways. In fact, research comparing basic lexicon systems to advanced models like BERT shows that the impact of sentiment can change dramatically depending on both the crypto and the algorithm used.
For example, machine learning classifiers like XGBoost and Support Vector Machines (SVM) can produce different results from the same data. Interestingly, some studies have found that adding trading volume into the mix can actually reduce accuracy by introducing more noise. The most reliable tools often combine multiple models into an "ensemble" to get a more stable prediction. If you want to go down that rabbit hole, you can explore a full thesis on sentiment algorithm comparisons.
Ultimately, AI is the engine that turns the chaotic, messy world of market chatter into structured, useful intelligence. It gives us the power to see the forest for the trees and identify the core emotions driving crypto prices.
Decoding the Crypto Fear and Greed Index
So, we've talked about data sources and AI models, but let's get practical. One of the most useful tools you'll find for crypto sentiment analysis is the Crypto Fear & Greed Index. Think of it as the market's emotional dashboard. It takes a ton of complex data and boils it down to a single, straightforward number that tells you if traders are feeling bullish or bearish at a glance.
This isn't just a number pulled from thin air. It’s a carefully calculated score based on several key data points. Once you understand what goes into it, you can stop just looking at the score and start seeing the mechanics behind the market’s mood. That’s when it transforms from a simple temperature check into a powerful strategic tool.
What Goes Into the Index Score?
The Fear & Greed Index doesn't hang its hat on a single metric. It cleverly blends several different data streams, each with its own weighting, to paint a balanced and reliable picture of market sentiment. It’s far more robust than any one indicator could be on its own.
Here are the moving parts that power the index:
- Volatility (25% weight): This compares Bitcoin's current volatility to its average over the last 30 and 90 days. A sudden spike in volatility is a classic sign of a fearful market—it screams uncertainty and panic.
- Market Momentum & Volume (25% weight): This one looks at current trading volume and momentum versus the 30 and 90-day averages. When huge buying volume accompanies a strong rally, it’s a dead giveaway of greedy market behavior.
- Social Media (15% weight): The index scans platforms like X (formerly Twitter), analyzing post volumes and engagement for crypto-related hashtags. A sudden explosion of positive chatter points toward growing greed and FOMO.
- Surveys (15% weight): While they happen less often, weekly crypto polls are factored in to get a broader pulse on investor sentiment. This helps smooth out some of the wilder swings you might see on social media.
- Bitcoin Dominance (10% weight): This simply measures Bitcoin's slice of the total crypto market cap. When Bitcoin's dominance rises, it’s often a sign of fear, as traders dump riskier altcoins for the relative safety of the market leader.
- Google Trends (10% weight): The index also analyzes Google search data for specific crypto keywords. A jump in searches like "Bitcoin price manipulation," for example, clearly signals rising fear in the market.
Each of these components offers a different lens on the market's mood. Put them all together, and you get a much more nuanced and reliable indicator.
Want to see it in action? You can check out the live Crypto Fear and Greed Index on Fear Greed Tracker.
How to Interpret the Signals
The index is super easy to read, running on a simple scale from 0 to 100. 0 means "Extreme Fear," while 100 signals "Extreme Greed." Knowing what these scores mean is how you make them work for you.
The screenshot below gives you a perfect example of a daily reading—a clear, visual snapshot of the current market mood.
This visual layout makes it incredibly simple to see where things stand.
A low score, especially in the "Extreme Fear" zone (usually 0-25), often means investors are hitting the panic button. This widespread fear can push prices to ridiculously low levels, creating what might be a golden buying opportunity for contrarian traders ready to jump in when everyone else is running for the exits.
On the flip side, a high score in the "Extreme Greed" range (typically 75-100) is a warning sign. It suggests the market is getting a little too euphoric, and FOMO has taken over. This is often a sign of overbought conditions, hinting that a correction could be just around the corner. Smart traders might see this as a signal to take some profits or set tighter stop-losses.
By learning to read these emotional tides, you can get much better at timing your moves. The index gives you a data-driven way to follow that timeless piece of trading wisdom: "Be fearful when others are greedy, and greedy when others are fearful." It turns fuzzy market psychology into a clear, actionable number.
Weaving Sentiment Into Your Trading Strategy

Knowing the market’s mood is one thing. Actually using that insight to make better trades is another game entirely. This is where we stop talking theory and start putting sentiment analysis to work in a real trading plan.
The biggest mistake you can make is relying on sentiment alone. Don't do it.
Instead, think of sentiment as the third, powerful layer of your analysis. It doesn’t replace your charts or your fundamental research—it sharpens them. When you blend all three, you get a much fuller picture of what's really happening, letting you pull the trigger with way more confidence.
Combining Sentiment with Technical Analysis
Technical analysis (TA) is all about reading the tea leaves of a chart—finding patterns, support, and resistance. Sentiment analysis gives you the why behind those squiggly lines. It helps confirm the emotional pressure that’s actually moving the price.
Here are a few ways to mesh them together in the real world:
- Confirming a Bounce at Support: Let’s say Bitcoin is plummeting toward a known support level on your chart. You glance at the Fear & Greed Index and see “Extreme Fear.” This tells you the sell-off is likely driven by pure panic, not some fatal flaw in the network. That emotional capitulation is often the perfect fuel for a sharp bounce right off those key technical zones.
- Validating a Breakout: A coin smashes through a major resistance level. Is this the real deal or a classic fakeout? If that breakout is happening alongside a surge in positive social media chatter and rising sentiment scores, you have strong confirmation that the move has genuine momentum.
- Spotting Overbought/Oversold Conditions: Your RSI indicator is screaming that an asset is overbought. But if the market is also flashing "Extreme Greed," it reinforces the idea that a pullback is probably right around the corner. It's a much stronger signal to think about taking some profits off the table.
Sentiment data is your ultimate confirmation tool. When the market’s emotional state lines up with a clear technical signal, the probability of your trade working out goes way up. It’s like a filter for market noise.
Finding Powerful Divergences
One of the most potent ways to use sentiment is to spot a divergence—when the price is doing one thing, but the market's mood is telling a completely different story. These moments are gold because they often signal a major trend reversal is brewing.
There are two main types to hunt for:
- Bullish Divergence: The price of a crypto is grinding down, making new lows. But when you check the sentiment score, you see it’s starting to tick up. This is a huge clue. It suggests that even though the price is falling, the panic is fading and smart money might be quietly buying. A bottom could be very close.
- Bearish Divergence: The price is pushing to new highs, but sentiment is getting weaker or even turning negative. This is a massive red flag. It shows that conviction is drying up on the way up, making the rally fragile and vulnerable to a sharp reversal.
Divergences give you a peek into the market’s underlying psychology—something a price chart alone can never fully capture. To go deeper on these specific setups, check out our guide on how to use market sentiment analysis for trading.
A Simple Framework for Your Strategy
So, how do you make this actionable? The goal is simple: find trades where your technicals, fundamentals, and sentiment all point in the same direction. When the stars align, you've got a high-conviction setup.
And this isn't just a hunch. A growing body of research confirms a strong link between online chatter and market moves. Recent studies comparing sentiment across different social platforms found that Twitter (X) sentiment, in particular, shows significant statistical correlations with crypto prices. The data backs it up.
Here’s a quick mental checklist to run through before you enter any trade:
- Fundamental Check: Does this project actually have a solid use case and good tokenomics?
- Technical Check: Is the price at a key level of support or resistance? Is there a clear chart pattern forming?
- Sentiment Check: Does the market’s mood support your idea? (e.g., fear at support for a long, greed at resistance for a short).
When you get a "yes" on all three, you've stacked the odds firmly in your favor. Nothing is a guarantee in trading, but this is as close as it gets to finding an edge.
One of the smartest ways to get a read on the market is to look at the Fear and Greed Index. Think of it as a quick sentiment check—a single number that tells you whether investors are feeling bold or running for the hills.
The index pulls together a bunch of different market signals into one simple score, ranging from 0 (Extreme Fear) to 100 (Extreme Greed).
Fear and Greed Index: A composite indicator that measures the prevailing emotion in the crypto market. It combines factors like volatility, market momentum, social media trends, and dominance to produce a score from 0 to 100.
Let’s break down what those scores really mean.
The Fear Zone (0-49)
When the index dips below 50, it’s a sign that fear is creeping in. Traders are getting nervous, selling off their assets, and generally bracing for the worst.
- Extreme Fear (0-24): This is pure panic territory. Investors are dumping their crypto, often at a loss, because they're convinced prices will keep falling. For contrarian investors, this can signal a potential buying opportunity—prices are low precisely because everyone else is scared.
- Fear (25-49): The market is on edge, but it’s not a total meltdown. Investors are cautious and uncertain about what’s next.
A fearful market is often oversold, meaning prices have dropped below their actual value. This is where you might start looking for bargains.
The Greed Zone (50-100)
When the score climbs above 50, it means greed is taking over. FOMO (Fear Of Missing Out) is in full swing, and investors are piling in, chasing quick profits.
- Greed (50-74): Confidence is high. People are buying, and the market feels optimistic. It's a sign of a healthy bull run, but it also warrants a bit of caution.
- Extreme Greed (75-100): This is when things get overheated. Everyone is euphoric, convinced the market will only go up. Historically, this level of greed often comes right before a market correction. It might be a good time to consider taking some profits off the table.
Greed often leads to an overbought market—prices are inflated, and a pullback might be just around the corner.
The Real-World Application of the Index
So, how do you actually use this thing? It’s not about making blind decisions based on a single number. Instead, it’s a powerful tool for context.
For example, let’s say you’re thinking about buying Bitcoin. If the index is sitting at 85 (Extreme Greed), it might be a sign to wait. The market is likely over-extended, and a correction could be imminent.
On the other hand, if the index is at 15 (Extreme Fear), that could be your cue. While everyone else is panicking and selling, you might find an excellent entry point. It’s the classic wisdom from Warren Buffett: "Be fearful when others are greedy and greedy when others are fearful."
The Fear & Greed Index from Alternative.me is the go-to source for this data. It gives you a real-time pulse on market sentiment, helping you decide whether to zig when everyone else zags.