
When you're scanning charts, some patterns jump out and scream "watch out!" The reverse cup and handle is one of them. It’s a powerful bearish signal that warns traders of a potential—and often significant—price drop.
Think of it as an upside-down teacup on your chart. This formation is a huge clue that sellers are gaining control and that a prior price decline might be about to pick up steam again.
What Is a Reverse Cup and Handle Pattern?
At its core, the reverse cup and handle is a story unfolding on a price chart. It’s what we call a bearish continuation pattern. This just means it usually shows up after an asset’s price has already been falling, and it hints that the downtrend is ready to make another move lower.
The pattern is made of two distinct parts that tell a tale of shifting market psychology—from weak, hopeful bulls to powerful, controlling bears. Getting a handle on its structure is the first step to using it effectively.
The Two Core Components
The pattern gets its name from its unmistakable shape, which looks just like a teacup that's been flipped over. Let's break down the two pieces that form it.
The Inverted Cup: This is the first and biggest part of the pattern. It looks like a large, rounded top, almost like an upside-down 'U'. This long, arcing shape shows that after an initial price drop, sellers are consistently squashing any buying attempts. They gradually push the price back down, carving out that gentle, rounded peak.
The Handle: After the cup is formed, the price stages a minor, short-lived rally. This small upward or sideways drift is what creates the 'handle'. It represents one last, feeble attempt by buyers to regain control. The key here is that this rally is weak and usually lacks the volume needed to be taken seriously.
The handle is a critical piece of the puzzle. It often acts as a bull trap, luring in optimistic buyers right before the floor gives out. Its failure to push prices much higher is a dead giveaway that sellers are about to take over for good.
Why This Pattern Matters
For traders, the reverse cup and handle is a big deal because it provides a clear, visual warning of incoming selling pressure. When the price finally breaks below the support level formed by the handle, it confirms the bears have won the battle. This breakdown often leads to a swift and substantial price decline.
This isn't just some random shape; it's a reflection of predictable market behavior. And it's not just theory—research backs it up. An analysis of over 556 trades spanning two decades found the pattern has an 82% success rate in forecasting price drops, making it a highly reliable tool. You can dig into the full research on its reliability from Liberated Stock Trader.
To help you spot its key features at a glance, here’s a quick summary.
Reverse Cup and Handle At a Glance
The table below breaks down the essential characteristics of the reverse cup and handle pattern, giving you a quick reference for when you're analyzing charts.
| Attribute | Description |
|---|---|
| Pattern Type | Bearish Continuation |
| Prior Trend | Downtrend |
| Shape | A rounded top (the cup) followed by a slight upward rally (the handle) |
| Volume | Typically decreases during the formation and spikes on the breakdown |
| Indication | Signals that the existing downtrend is likely to continue |
Having these attributes in mind makes it much easier to identify the pattern with confidence and prepare for the potential trading opportunity it presents.
The Market Psychology Driving the Pattern

Every chart pattern tells a story. It's a visual record of the constant tug-of-war between buyers (the bulls) and sellers (the bears). The reverse cup and handle is no different, and understanding the psychology behind its formation is what makes it such a powerful bearish signal.
Think of it as a slow-motion transfer of power from the bulls to the bears. The pattern unfolds in two distinct acts, showing a clear shift from weakening optimism to outright pessimism.
Act One: The Formation of the Inverted Cup
The story starts with the inverted cup. This isn't a sudden, sharp crash. It's a gradual, rounded peak that shows selling pressure is quietly and methodically building in the background.
Initially, buyers might still feel optimistic, trying to push the price higher. But each attempt is met with fresh selling that gently but firmly forces the price back down. This grinding process creates that signature rounded top, representing the slow erosion of bullish confidence as sellers consistently prove their strength. The buyers are still in the game, but their influence is fading fast.
The inverted cup is a visual of sellers systematically absorbing all buying interest. It’s not a panic sell-off but a controlled distribution where optimism slowly dies, setting the stage for what comes next.
Act Two: The Handle and the Bull Trap
After the cup, the handle forms. This is the final, and most deceptive, part of the story. The handle appears as a small, brief rally—what looks like a sign of recovery. In reality, it’s a classic bull trap.
This little price bounce is designed to lure in the last of the hopeful buyers, the ones who think the downtrend is finally over. But this rally is weak. It usually happens on low trading volume, which tells you there's no real conviction behind the move. It’s the market’s last gasp before the breakdown.
The failure of the handle to push prices meaningfully higher is the final confirmation that the bulls are exhausted. At this point, the sellers are in complete control. The breakout below the handle’s support level is the signal that the bears have won the battle.
This whole narrative highlights a critical transition in market control. By learning how to use market sentiment analysis for trading, you can get better at spotting these psychological shifts. When you understand this story—of hope turning into capitulation—you can better anticipate the powerful downward move that often follows this pattern’s completion.
Right, let's move from theory to what this looks like on a live chart. Spotting a reverse cup and handle in real-time isn't about finding a picture-perfect pattern. It's more about recognizing a sequence of events and visual clues that tell you a story about the market's mood.
The first thing you need is context. This pattern is a bearish continuation signal, which means you should be looking for it after the price has already been heading down. Once you've confirmed that prior downtrend, you can start hunting for the pattern's signature shape.
Identifying the Core Shapes
The reverse cup and handle is built on two key parts: the "cup" and the "handle."
First, the cup. You're looking for a gradual, rounded top that looks like an upside-down "U." A sharp, V-shaped peak doesn't count. That rounded shape is important because it shows a slow, grinding transfer of power from the bulls back to the bears, not just a sudden panic sell-off.
After the cup forms, you'll see a small, upward-drifting channel or flag shape. That's the handle. Think of it as a brief pause or a weak relief rally before the price potentially continues its slide. The handle needs to be much smaller than the cup, usually retracing less than a third of the cup's depth.
A critical step here is to draw the support line, often called the 'brim.' This is a horizontal line connecting the low points on both sides of the cup. This line is your trigger. A confirmed break below this level is the signal that sellers have officially taken control.
This visual process flow diagram breaks down the key steps to identifying and acting on the pattern.
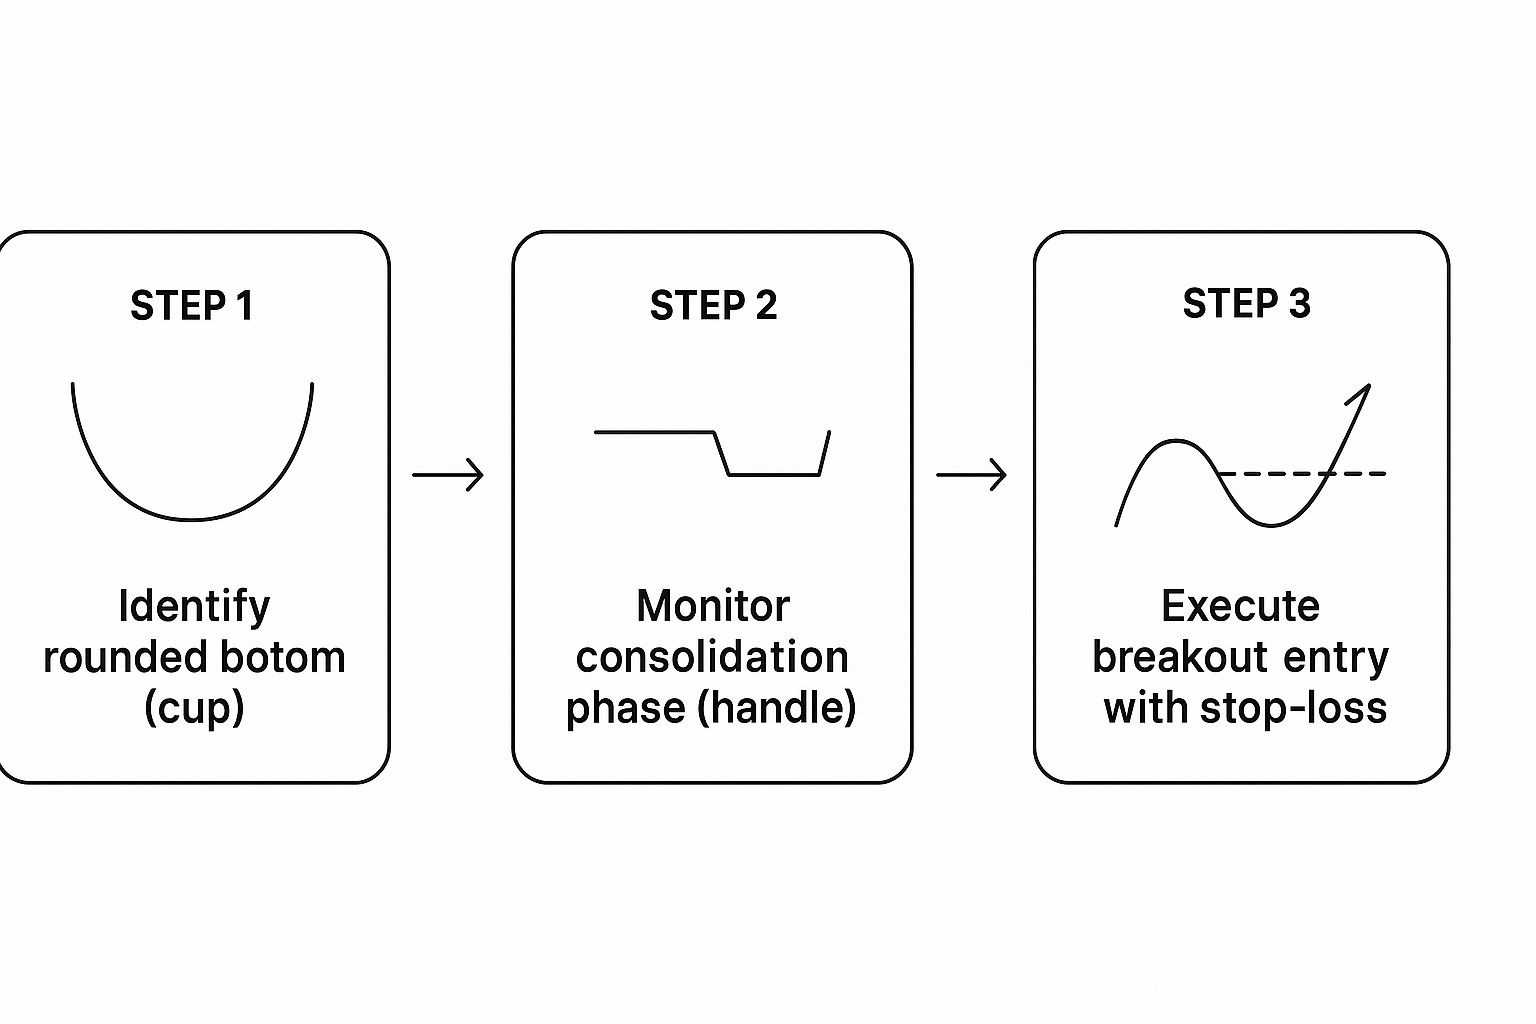
As the diagram shows, trading this pattern is a step-by-step process. You move from spotting the cup and handle to waiting for that confirmed breakdown before you even think about placing a trade.
Confirming with Volume Analysis
A chart pattern without volume is just a pretty shape. You need confirmation, and trading volume is arguably the most powerful tool for the job. Volume tells you how much conviction is behind a price move.
Here's how to think about it:
- During the Cup: As the price grinds out that rounded top, volume should ideally be decreasing. This tells you that the buyers are running out of steam.
- During the Handle: Volume should stay low and quiet. This confirms the brief rally is weak and lacks any real market participation.
- On the Breakdown: This is the moment of truth. When the price slices through that support line (the brim), you need to see a significant spike in volume. That surge is your confirmation that sellers have stormed the market, validating the whole setup.
Combining the classic shape with this volume profile gives you a much more reliable trading signal. Ignoring volume is one of the biggest mistakes traders make with this pattern.
The reverse cup and handle pattern tends to be most reliable on daily and higher timeframes across major markets like US stocks, forex, and commodities. On these charts, you'll often see volume dry up during the cup's formation and then spike on the breakdown, which is exactly what you want. You can discover more insights about these market dynamics on luxalgo.com.
By waiting for that all-important volume confirmation, you can filter out a ton of false signals and trade with much greater confidence.
A Practical Framework for Trading the Pattern
Spotting a high-probability reverse cup and handle pattern is a great start, but a pattern alone won't make you money. To turn that chart observation into a real trade, you need a solid framework with clear rules for when to enter, how to manage your risk, and where to take profits.
This structure is what separates disciplined trading from emotional guesswork. A complete plan for this pattern really boils down to three key decisions: your entry trigger, your stop-loss, and your profit target. Let's break down how to handle each one.
Pinpointing Your Entry Point
The single biggest mistake I see traders make is jumping the gun. The entry signal for a reverse cup and handle isn't the handle forming—it's the confirmed breakdown below the handle. You have to wait for the price to close decisively below that support level.
Patience here is everything. A price that momentarily dips below the support line and then snaps right back up is a classic fake-out, often called a "whipsaw." What you're looking for is a confirmed close below that line, ideally with a noticeable spike in selling volume. That's your green light to consider a short position.
Setting Your Stop-Loss for Protection
No chart pattern works 100% of the time, which is why risk management is non-negotiable. Your stop-loss is your safety net. It's what protects your trading capital when a pattern fails and the market turns against you.
The most logical place to set your stop-loss order is just above the highest point of the handle. This placement makes perfect strategic sense for two main reasons:
- It clearly defines failure. If the price rallies back above the handle, the bearish setup is officially broken. The trade is invalidated.
- It keeps your loss small and defined. You know your exact risk before you even click the "sell" button.
Think of it this way: a tight stop-loss above the handle ensures you get out immediately if the bears lose control and a last-ditch effort from the bulls finds surprising strength. This discipline is what keeps you in the game long-term.
Calculating Your Profit Target
Finally, every trade needs a goal. The standard way to set a profit target for the reverse cup and handle is refreshingly simple and based on the pattern's own geometry.
Here's the two-step process:
- Measure the Depth: Calculate the vertical distance from the very top of the cup down to its brim (the support line).
- Project Downward: Take that same distance and subtract it from the breakout point—the price where it broke below the handle's support. That resulting price is your minimum profit target.
This technique gives you an objective, data-driven target to aim for. Once the price hits that level, you can close the entire position or lock in some profits and let the rest run with a trailing stop. It’s a structured approach that helps you capitalize on the powerful moves this pattern often signals.
Common Mistakes and How to Avoid Them

Even with a solid game plan, trading the reverse cup and handle pattern can be a minefield. I've seen countless traders, both new and seasoned, fall into the same predictable traps that turn a beautiful setup into a frustrating loss.
Knowing what these pitfalls are ahead of time is half the battle. It helps you build the discipline needed to execute your strategy the right way, every time.
One of the most common blunders is misreading the cup's shape. A real inverted cup should look like a gradual, rounded dome, showing a slow, grinding transfer of power from buyers to sellers. Too often, traders mistake a sharp, V-shaped spike for a cup. That's a different beast entirely—it signals a quick sentiment flip, not the drawn-out topping process of a true reverse cup and handle.
Another classic mistake? Jumping the gun. The urge to short the stock while the handle is still forming is incredibly tempting, but it’s a low-probability move. The pattern isn't confirmed until the price makes a decisive break below the handle's support line. Patience is your best friend here. Seriously, wait for the breakdown.
Overlooking Essential Confirmation Signals
A chart pattern without any other evidence is just a bunch of squiggles. Blowing past a few key confirmation signals is a fast track to getting faked out and taking unnecessary losses.
Here are the two things you absolutely cannot ignore:
Ignoring Volume: A valid reverse cup and handle tells a story with volume. Typically, you'll see volume dry up as the cup and handle take shape. Then, on the breakdown, it should spike dramatically. If the price breaks down on weak, uninspired volume, that's a massive red flag. It suggests there's no real conviction behind the move.
Forgetting Market Context: No pattern works in a vacuum. A reverse cup and handle is a bearish continuation pattern, which means it’s most powerful when it shows up inside an already established downtrend. You also need to get a feel for the broader market mood. Are traders feeling fearful or greedy? You can get a better sense of this by understanding the Fear and Greed Index in our trading guide, which is great for gauging overall market sentiment.
A reverse cup and handle appearing in a roaring bull market is far less reliable than one forming during a period of widespread fear or bearishness. Always consider the bigger picture before committing to a trade.
By consciously sidestepping these mistakes—insisting on a rounded cup, waiting for a confirmed breakdown, demanding volume confirmation, and checking the market context—you tilt the odds firmly in your favor. This disciplined approach is what separates consistently profitable traders from the rest of the pack.
Frequently Asked Questions
Even with the best guides, questions always pop up when you're trying to master a new chart pattern. The reverse cup and handle is no different. Let's tackle some of the most common questions traders have about this powerful bearish signal.
How Reliable Is the Reverse Cup and Handle Pattern?
The reverse cup and handle is considered one of the more reliable bearish patterns out there, especially when it forms cleanly and ticks all the boxes. While no pattern is a crystal ball, trading literature and backtesting often point to a high success rate—sometimes over 80%—in predicting a drop when the setup is perfect.
But its reliability isn't just about the shape. The signal gets much stronger when other factors line up. A big spike in trading volume when the price breaks down is a huge confirmation. The pattern forming within an existing downtrend also adds a lot of weight to the bearish case.
Remember, reliability is about probability, not certainty. Even the most picture-perfect patterns can fail. That’s why disciplined risk management, like always using a stop-loss, isn't just a suggestion—it's a requirement for every single trade.
Can This Pattern Be Used in All Markets?
Yes, absolutely. The beauty of technical patterns like the reverse cup and handle is that they reflect human psychology—the universal tug-of-war between buyers and sellers. That dynamic plays out in every liquid market.
This means you can spot and trade it across different asset classes:
- Stocks: It's a classic formation for calling tops or flagging bearish continuations in equities.
- Forex: The pattern works very well in currency markets, particularly on the higher timeframes.
- Commodities: Assets like crude oil and gold are no strangers to this bearish setup.
- Cryptocurrencies: You'll see it frequently in the volatile crypto markets, but a word of caution is needed here.
With something as volatile as crypto, you have to be extra careful. Confirming the breakdown with a massive surge in volume is non-negotiable if you want to avoid getting faked out by sharp, sudden reversals, often called "whipsaws."
How Is This Different from a Head and Shoulders Pattern?
Great question. Both are major bearish topping patterns that scream "a trend reversal might be coming!" The key difference is in their structure and the story they tell on the chart.
The reverse cup and handle has a single, rounded top (the cup) followed by a smaller, sideways drift (the handle). Think of it as a slow, grinding process where sellers gradually wrestle control away from buyers.
In contrast, the head and shoulders pattern is built from three distinct peaks:
- A lower peak (the left shoulder).
- A higher peak in the middle (the head).
- Another lower peak (the right shoulder).
Both patterns are confirmed when the price breaks a critical support level—the "brim" for the cup and handle, and the "neckline" for the head and shoulders. While they both signal that sellers are winning, their shapes are completely different.
What Is the Best Timeframe to Use?
As a general rule, the reverse cup and handle is much more reliable and significant on longer timeframes. When you see this pattern form on a daily, weekly, or even monthly chart, it’s telling a much bigger story about the shift in market control. A pattern that takes months to build represents a more fundamental and trustworthy change in sentiment from bullish to bearish.
Sure, the pattern can show up on intraday charts like the 1-hour or 4-hour, but it's far more prone to "market noise" and false breakouts on those shorter durations. If you're a swing or position trader, stick to the daily and weekly charts. You'll find the highest-quality setups there. It also helps to see if the pattern aligns with what the crowd is thinking; you can learn more about that in our guide on what is social sentiment.
Ready to stop guessing what the market is thinking? The Fear Greed Tracker platform gives you a powerful edge by turning complex market sentiment into a simple, actionable score. Track over 50,000 stocks and cryptos in real-time and know exactly when fear and greed are driving the market. Make smarter, data-driven decisions and find your next big opportunity by visiting us at https://feargreedtracker.com today.