
Ever heard the saying, “Be fearful when others are greedy, and greedy when others are fearful”? That famous bit of wisdom from Warren Buffett is the whole idea behind the Greed and Fear Index.
Think of it as a mood ring for the market. It takes the emotional temperature of investors and boils it all down to a simple score from 0 to 100. This one number tells you if the market is being driven more by logic or by gut feelings like panic or euphoria.
What Is the Greed and Fear Index?
Imagine you’re in a packed stadium during the final seconds of a championship game. The collective roar of the crowd can swing from a deafening cheer to a groan of despair in an instant. The Greed and Fear Index does something very similar for the financial markets—it listens in on the emotional state of millions of investors and translates all that noise into one clear score.
The index is built on a powerful concept from behavioral finance: emotions often hijack our investment decisions. When fear grips the market, investors tend to dump assets without thinking, pushing prices way below what they’re actually worth. On the flip side, when greed takes over, the fear of missing out (FOMO) kicks in, and people start buying like there’s no tomorrow, inflating prices to bubble-like levels.
The index is best used as a contrarian indicator. It gives you a data-driven way to follow Buffett's advice—to zig when everyone else zags. When the score screams fear, it might be time to look for bargains. When it's oozing greed, it might be time to be cautious.
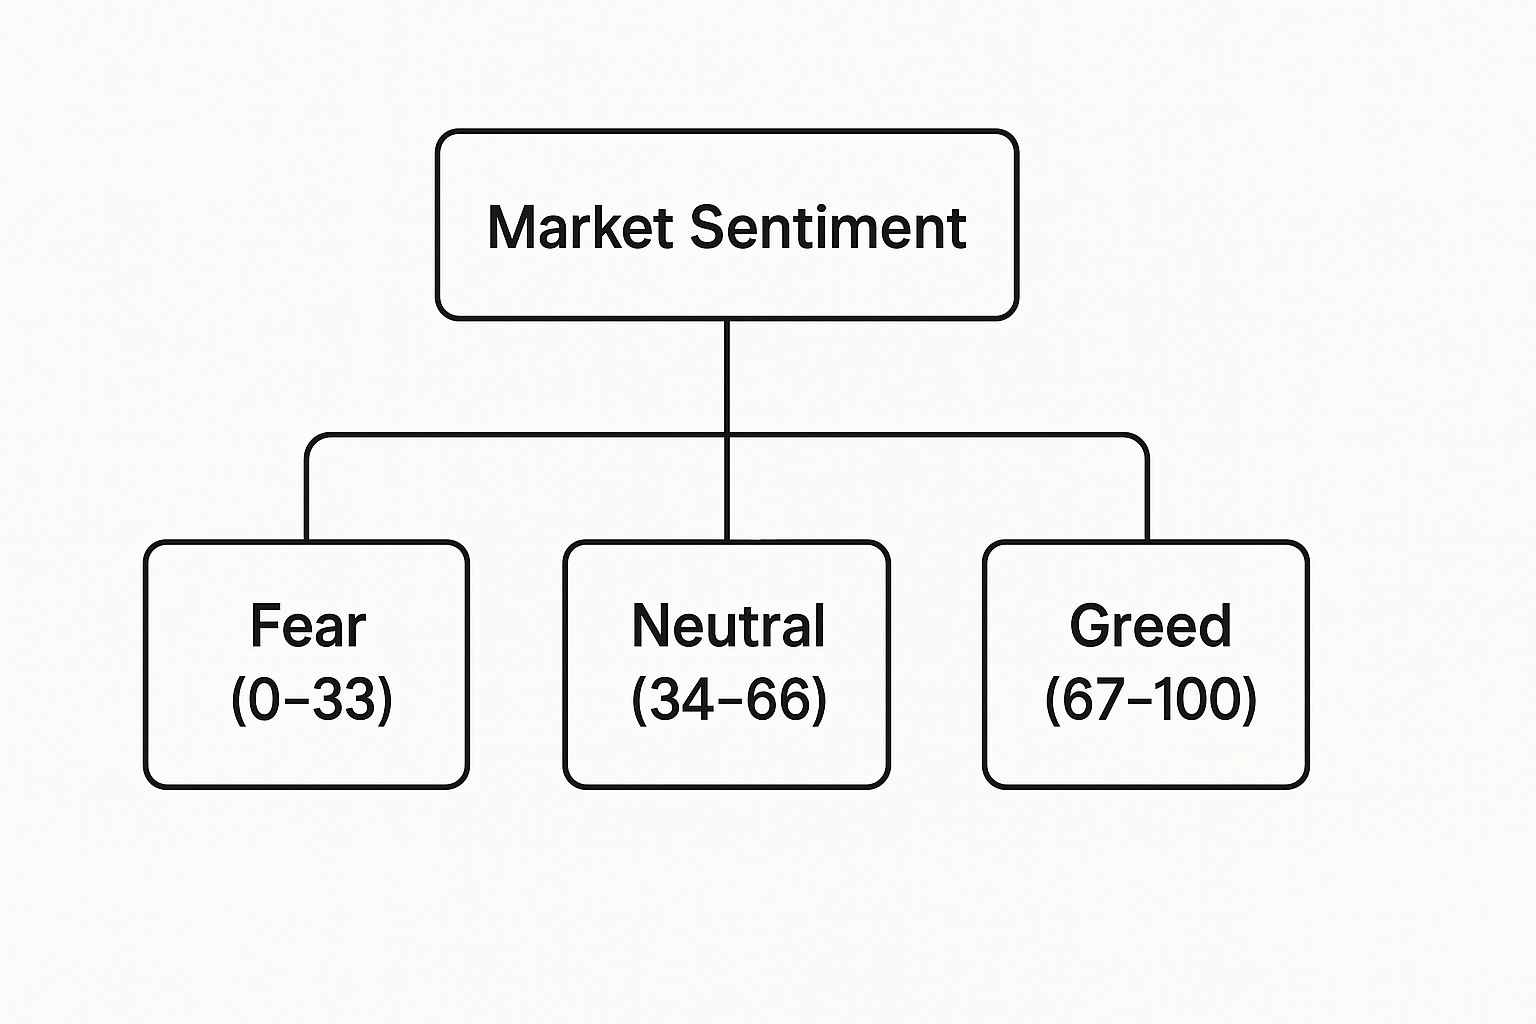
The scale is straightforward: 0 means Extreme Fear, and 100 means Extreme Greed. This simple score makes it incredibly easy to get a snapshot of the market’s psychological state without getting lost in the weeds.
Understanding the Emotional Scale
Every number on the scale tells a story about what’s going through investors’ minds. Learning to read these zones is the first step to putting the index to work for you.
0-24 (Extreme Fear): This is panic mode. Investors are capitulating and selling everything that isn’t nailed down, often without looking at the fundamentals. For a contrarian, this can be a flashing green light, signaling that great assets might be on sale.
25-44 (Fear): Caution is the word of the day. It’s not a full-blown meltdown, but investors are definitely nervous. This typically leads to choppy markets and a “risk-off” attitude.
45-55 (Neutral): The market is in a state of equilibrium. Neither emotion has the upper hand, so stock movements are more likely driven by actual company news and economic data.
56-75 (Greed): Optimism is running high. Investors are buying confidently and taking on more risk, hoping for bigger gains. While this can fuel powerful rallies, it also sets the stage for a potential correction.
76-100 (Extreme Greed): We’ve hit peak euphoria. Speculative behavior is common, and many believe prices can only go up. This is a massive warning sign that the market is overbought and could be headed for a sharp pullback.
Here's a quick cheat sheet to help you interpret the score at a glance.
What the Greed and Fear Index Scale Means
| Index Reading | Sentiment Level | Potential Market Implication |
|---|---|---|
| 0-24 | Extreme Fear | Investors are panicking. Potential buying opportunity for contrarians. |
| 25-44 | Fear | Caution is high. Market may be undervalued. |
| 45-55 | Neutral | Market is balanced. Fundamentals are likely driving prices. |
| 56-75 | Greed | Optimism is growing. Market could be getting overbought. |
| 76-100 | Extreme Greed | Euphoria has set in. High risk of a market correction. |
This table provides a simple framework, but remember, context is everything. The index is a guide, not a crystal ball.
Over the long haul, the market tends to find its balance. Historical data shows the index has an average reading of around 49.15, but it’s the wild swings away from this average that create both risk and opportunity. If you're curious, you can dive into more of the numbers and charts over at Finhacker.cz.
The Seven Factors That Power the Index
The Fear & Greed Index isn't just pulling numbers out of thin air. Think of it as a finely tuned instrument that listens to everything from the market's whispers to its loudest shouts. It combines seven distinct ingredients, each telling a different part of the story, to paint one clear picture of what's driving investors.
To really get what makes the index tick, you have to look under the hood. These components track everything from the speed of price changes to the appetite for risky bonds. Together, they reveal whether greed or fear is calling the shots.
Stock Price Momentum
First up is Stock Price Momentum. This is a pretty straightforward one. It simply looks at the S&P 500—the go-to benchmark for the U.S. stock market—and compares it to its average price over the last 125 trading days.
When the S&P 500 is trading well above that average, it’s a sign of confidence. Investors are feeling good and pushing prices higher. That's greed. But if the index slips below its 125-day moving average, it suggests momentum is stalling, and traders are getting nervous. Fear could be creeping in.
Stock Price Strength
Next, we have Stock Price Strength. This indicator zooms in on individual stocks, counting how many are hitting new 52-week highs versus those sinking to 52-week lows on the New York Stock Exchange.
If you see a huge number of stocks hitting new peaks, it tells you the optimism is widespread. That’s a greedy market. On the flip side, if more stocks are hitting rock bottom than new highs, it’s a red flag that the weakness is spreading.
Stock Price Breadth
Similar to strength, Stock Price Breadth looks at trading volume. It measures the amount of money flowing into stocks that are rising versus the volume flowing into stocks that are falling.
When advancing stocks are seeing way more volume than declining ones, it’s a powerful sign of greed. Investors aren't just hopeful; they're putting serious cash behind their bets. When declining volume takes over, sellers are in control—a classic symptom of fear.
Put and Call Options
This is where we see how investors are actually betting. A put option is a bet that prices will fall, while a call option is a bet they'll rise. The index keeps an eye on the ratio between the two.
If traders are buying up more puts than calls, it’s a clear signal that fear is on the rise. They’re either protecting their portfolios or actively betting on a downturn. When calls are dominating, it means optimism is high, and people expect the rally to keep going. You can learn more about how it works and the math behind it on our explainer page.
Junk Bond Demand
What investors do with their riskiest assets tells you a lot. Junk Bond Demand measures the gap in returns between safe, investment-grade bonds and riskier junk bonds.
When investors get greedy, they’re willing to take on more risk for a bigger payout, so they pile into junk bonds. This shrinks the yield gap. But when fear sets in, they dump the risky stuff and run for safety, causing the spread to widen. It’s a classic "flight to quality."
Market Volatility
You’ve probably heard of this one: the Cboe Volatility Index (VIX). It’s often called the market's "fear gauge" for a good reason. The VIX basically measures the market’s expectation of turbulence over the next 30 days.
A low VIX suggests a calm and confident market—a sign of greed or neutrality. But a spiking VIX means uncertainty and fear are ramping up fast.
Safe Haven Demand
Finally, Safe Haven Demand looks at how stocks are performing compared to Treasury bonds over the last 20 trading days. During scary times, investors often sell their stocks and park their money in the safety of government bonds.
If bonds are outperforming stocks, it shows investors are more worried about protecting their money than growing it—a clear fear signal. When stocks are leaving bonds in the dust, it means investors are confident and ready to embrace risk.
What History Teaches Us About Market Emotions
A financial tool is only as good as its performance under pressure. The real power of the Fear & Greed Index isn’t just in its daily reading, but in how it behaves during the market’s most dramatic moments. Looking back, we can see a clear pattern: collective emotion drives massive opportunities and risks.
These moments from the past offer solid proof of the index's ability to signal turning points that most emotionally-driven investors miss. They provide a data-driven lens for understanding the wisdom behind Warren Buffett’s famous advice to be "fearful when others are greedy, and greedy when others are fearful."
The 2008 Global Financial Crisis
The meltdown of 2008 was a masterclass in market panic. As the crisis unfolded, fear wasn't just a feeling—it was a force that sent shockwaves through the global economy. Terrified by the collapse of major financial institutions, investors sold off everything, indiscriminately.
The Fear & Greed Index captured this overwhelming sentiment perfectly. It plunged deep into Extreme Fear, bottoming out at a reading of just 12 in September 2008. At that exact moment, when it felt like the world was ending, the market was offering once-in-a-generation buying opportunities for anyone who could see past the panic.
The index's dive to 12 was a clear, quantitative signal of maximum pessimism. It showed that fear had pushed asset prices far below their actual worth, creating the perfect setup for contrarian investors to step in.
This historic low on the index lined up almost perfectly with what we now recognize as the market bottom. Investors who used this signal to start buying were handsomely rewarded in the years that followed.
The 2020 Pandemic Crash
History repeated itself, only much, much faster, in March 2020. As the COVID-19 pandemic brought the world to a halt, markets experienced one of the most rapid and severe sell-offs ever recorded. Uncertainty was off the charts, and the emotional response was immediate and brutal.
The Fear & Greed Index captured this terror in real-time, hitting a historic low of just 2. A score like that represents a level of fear rarely seen, indicating that investors were in a state of complete and total capitulation. They weren't just selling; they were liquidating positions at any price just to get out. For a detailed look at how the Fear & Greed Index for the stock market behaves during these events, our dedicated guide offers more charts and analysis.
Once again, this moment of peak fear marked a major market turning point. The recovery that followed was just as swift as the crash, and those who recognized the signal had a chance to benefit from the incredible rebound.
Contrasting Fear with Greed
The index is just as effective at flagging when things get too hot. During the tech stock rallies of 2017, for instance, investor euphoria was palpable. FOMO (Fear Of Missing Out) was the dominant emotion, driving valuations to levels that just weren't sustainable.
During these bull runs, the index often climbed above 80, pushing deep into Extreme Greed territory. These peaks served as a clear warning that the market was becoming overbought and that a correction could be just around the corner.
These historical snapshots reveal the index's critical role in identifying turning points. Its performance during major crises has been particularly insightful. It plunged to 12 during the 2008 financial crisis and hit a rock-bottom low of 2 in the March 2020 pandemic crash. These examples underscore how extreme fear readings often precede significant market bottoms, offering a powerful counter-signal to the prevailing panic.
If you think the stock market runs on emotion, the crypto market is a whole other level of drama. It’s not just tech and adoption rates moving the needle here—it's raw, powerful waves of FOMO (Fear Of Missing Out) and FUD (Fear, Uncertainty, and Doubt). To make any sense of this chaos, a specialized tool was born: the Crypto Fear & Greed Index.
This isn't just a copy-paste of the stock market version. It’s custom-built for the wild world of digital assets. While the original index cares about things like junk bond demand, the crypto version tunes into signals that actually matter in this space, like the buzz on social media and Bitcoin's influence over the entire market. It gives you a daily score that acts like a sentiment compass, helping you get a read on the extreme emotions that can send prices soaring or crashing in a matter of hours.
Why Crypto Needs Its Own Index
Let's be real: the crypto market is a different beast entirely. It never sleeps, running 24/7, and is ridiculously sensitive to community sentiment. A single tweet from the right (or wrong) person can spark a massive price swing. The Crypto Fear & Greed Index is designed for exactly this environment, pulling in a unique set of data points.
- Social Media Sentiment: The index literally scours platforms like X (formerly Twitter) to analyze the volume and tone of the conversation. A flood of bullish posts can be a dead giveaway that greed is creeping in.
- Bitcoin Dominance: This metric tracks Bitcoin's slice of the total crypto market pie. When its dominance rises, it’s often a sign of fear, as traders dump their riskier altcoins and run for the relative safety of Bitcoin.
- Volatility: Wild price swings are just part of the game in crypto. The index watches for unusual spikes in volatility compared to recent averages, which can signal extreme fear or irrational exuberance.
The Crypto Fear & Greed Index gives a score from 0 (extreme fear) to 100 (extreme greed), generated from six core indicators. Historically, you can see it swinging wildly right alongside Bitcoin's price, perfectly mirroring the emotional rollercoaster of the community. When Bitcoin takes a nosedive, the index often plummets into extreme fear, which can be a huge spotlight on potential buying opportunities. If you want to get into the weeds, you can check out the data behind the crypto index yourself.
Reading the Signals in a Volatile Market
For crypto traders, this index is an incredible contrarian tool. When the score drops into the single digits, it’s a sign of widespread panic. For a savvy investor, that might be the perfect moment to start buying, especially if you think the sell-off has gone too far. On the flip side, a score screaming past 80 suggests the market is getting dangerously greedy and overheated. That could be your cue to start thinking about taking some profits off the table.
Keep in mind, the Crypto Fear & Greed Index is not a crystal ball. Think of it as a sentiment gauge—one tool in your toolkit. It works best when you use it alongside other analysis, like technical charts and solid fundamental research.
Take a look at the historical chart from alternative.me below. It’s a perfect visual of the market's emotional journey.
See how those sharp dips into "Extreme Fear" (the red zones) often line up with price bottoms, right before a major rally? Those are the moments of maximum pessimism that often create the best entry points.
A classic example was the collapse of the FTX exchange back in November 2022. The index cratered to a low of 12 as pure panic gripped the market, and Bitcoin's price plunged below $17,000. Traders who recognized this as a moment of capitulation and started buying were perfectly positioned for the recovery that followed. It’s a powerful lesson in how the index can help you stay objective when everyone else is losing their cool. To see how this applies to different assets, dive into our full guide on using the Fear & Greed Index in the crypto market.
Putting the Fear and Greed Index to Work
Knowing the Fear and Greed Index score is one thing, but turning that number into smarter investment decisions is where the real magic happens. Let's move past the theory and get into actionable strategies that help you read the market's emotional tides. The idea isn't to use the index as a crystal ball, but as a compass for contrarian thinking.
This means learning to zig when the rest of the market zags. When the index is flashing red with widespread panic, a contrarian investor starts sniffing around for a potential sale on quality assets. On the flip side, when euphoria takes over and the index shows Extreme Greed, that's your cue to be more cautious, not more aggressive.
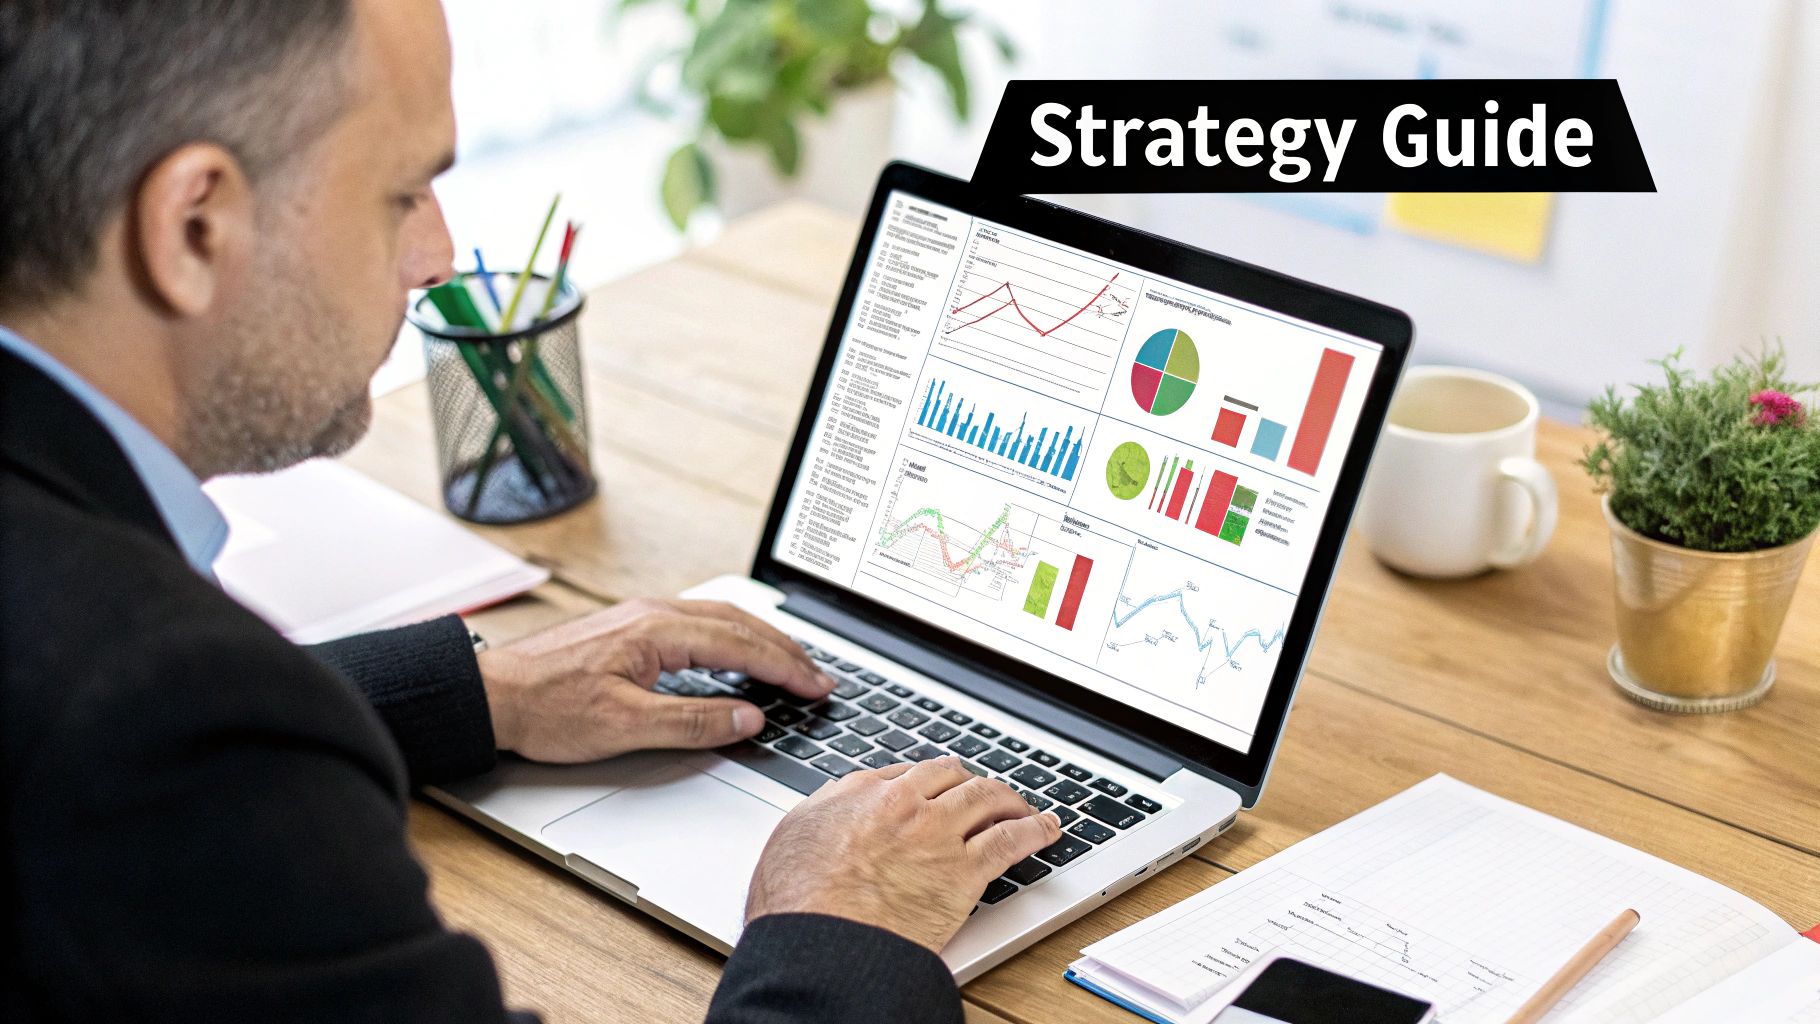
Building a Framework for Action
The best way to use the index is to set your rules before emotions get the best of you. By creating a clear plan, you avoid making impulsive moves in the heat of the moment. Your framework should link specific index levels to specific actions you’ll take.
For example, you might make a rule to start researching buying opportunities anytime the index dips into the "Extreme Fear" zone (a score below 25). This doesn’t mean you buy blindly; it means you start hunting for fundamentally solid assets that got unfairly dragged down by the market’s panic.
Likewise, you could set a rule to review your portfolio and consider taking some profits off the table when the index soars into "Extreme Greed" (above 75). This helps you lock in gains when the market is overbought and ripe for a cooldown, keeping you from getting swept up in the hype.
Practical Strategies for Different Scenarios
A one-size-fits-all approach won't work here. You need to adapt based on what the index is telling you about the market's mood. Here are a few ways to think about it.
When Fear Dominates (Index 0-44): This is your homework time. Build a watchlist of assets you believe in for the long haul. When the index screams fear, see if anything on your list is trading at a discount. This is your chance to be "greedy when others are fearful."
When the Market is Neutral (Index 45-55): In a neutral zone, sentiment isn't the main driver. This is a good time to get back to basics and focus on fundamental analysis—company earnings, economic reports, and industry trends are more likely to move the needle.
When Greed Takes Over (Index 56-100): Time for discipline. Fight the FOMO and resist chasing prices that are going vertical. Instead, you might trim positions that have run up significantly or set tighter stop-loss orders to protect your profits if things turn sour.
The key is to use the index as a trigger for action, not as the action itself. An "Extreme Fear" reading is a signal to start hunting for bargains, not a command to buy everything in sight.
This balanced approach keeps you objective. You're using the market's emotional state as just one piece of the puzzle to guide your research and timing, rather than letting it call all the shots.
Common Pitfalls to Avoid
The Fear and Greed Index is a powerful tool, but it's also easy to misuse. Falling into a few common traps can lead to some really bad decisions.
One of the biggest mistakes is relying on the index alone. It should always be a supplement to your other analysis. A low fear reading doesn’t magically make a struggling company a great investment.
Another classic error is overreacting to daily swings. The index can be volatile. Making huge portfolio changes based on a single day’s score is a recipe for getting whipsawed. Look for sustained trends, not every little blip.
Finally, remember the index is a snapshot of short-term sentiment. While that’s great for timing your entries and exits, it shouldn’t be the foundation of your long-term investing philosophy. A solid strategy is built on fundamentals, not fleeting market moods.
Answering Your Top Questions
Let's clear up a few common questions that pop up when people start using the Greed & Fear Index. Think of this as a quick FAQ to help you use this powerful tool with more confidence.
We'll tackle how reliable it really is, the best way to check it without driving yourself crazy, and who gets the most value out of it.
How Reliable Is the Index as a Predictor?
This is the big one, and the honest answer isn't a simple yes or no. The Greed & Fear Index isn't a crystal ball—it won't tell you the exact day the market will hit its peak or bottom out.
Instead, think of it as an emotional barometer for the market. Its real strength is showing you when sentiment has been stretched to an unsustainable extreme. It’s a classic contrarian indicator. Time and again, historical data shows a clear link between periods of "Extreme Fear" and the market bounces that followed. The same is true for "Extreme Greed," which often shows up right before a correction.
The index doesn't predict what will happen. It gives you a strong signal about when the psychological conditions are ripe for a reversal. Its reliability is in flagging moments of maximum opportunity or maximum risk.
It’s a high-level guide. While you should never use it in isolation, its performance during major market events like the 2008 financial crisis and the 2020 COVID crash proves just how valuable it is for spotting potential turning points.
How Often Should I Check the Score?
Checking the index too often can backfire. You can get stuck in "analysis paralysis" or, worse, get caught up in the very emotional reactions you’re trying to avoid. The goal is to use it strategically, not as a minute-by-minute trading signal.
For most people, this rhythm works best:
- Daily Glance: A quick peek each day keeps you in tune with the market’s mood and helps you notice if a new trend is forming.
- Weekly Review: Take a closer look once a week. This helps you see the bigger picture of how sentiment is shifting and filters out the meaningless daily noise.
Obsessively refreshing the page is a trap. The index becomes most powerful when you watch its score move into the extreme zones and stay there for a few days or weeks. That’s a sign of a real, significant shift in market psychology.
Is It More for Long-Term Investors or Short-Term Traders?
One of the best things about the Greed & Fear Index is how versatile it is. It offers something for everyone, whether you’re holding for years or trading for days.
For Long-Term Investors: The index is a fantastic tool for spotting great entry points. If you’re a long-term investor, you’re not trying to time the market perfectly. But seeing a score dip into "Extreme Fear" can be a clear signal that it’s a good time to buy quality assets at a deep discount. It helps you stick to the "buy low" mantra with data backing you up.
For Short-Term Traders: Traders can use the index to get a feel for the market's immediate direction and manage their risk. A reading of "Extreme Greed" might be a signal to tighten your stop-losses or cash in some profits before things turn. On the flip side, a sudden drop into fear territory could hint that a short-term bounce is on the horizon.
Ultimately, the index is for anyone looking to make more rational, less emotional decisions, no matter how long they plan to hold their investments.
Ready to see the market's mood in real-time? With Fear Greed Tracker, you get live sentiment scores for over 50,000 stocks and cryptocurrencies, powered by a proprietary 16-indicator algorithm. Stop guessing and start making data-driven decisions by visiting https://feargreedtracker.com to track your favorite assets today.