
Navigating the financial markets requires powerful tools, but the cost of premium analytics can be a significant barrier for many investors. This guide cuts through the noise to identify the best free stock analysis software available today. Whether you're a day trader needing advanced charting, a long-term investor performing deep fundamental research, or a beginner learning the ropes, the right platform can dramatically improve your decision-making process without costing a dime.
We have meticulously reviewed the top free services, moving beyond marketing claims to provide a practical, hands-on assessment. For each platform, you will find a detailed breakdown of its core features, honest pros and cons, and specific use-case scenarios to help you match the tool to your trading style. From the powerful charting of TradingView and ThinkorSwim to the comprehensive screening capabilities of Finviz and Stock Rover, this resource is designed for efficiency.
Each entry includes screenshots for a visual preview and direct links to get you started immediately. Our goal is to equip you with a curated list of reliable, no-cost solutions, helping you analyze market data, identify opportunities, and execute your strategy with greater confidence. Let's explore the tools that can elevate your investment analysis.
1. Fear Greed Tracker
Fear Greed Tracker stands out as a premier choice for best free stock analysis software, offering a unique and powerful approach centered on market sentiment. It transforms the often-overlooked psychological aspect of trading into a quantifiable metric, giving investors a distinct analytical edge. The platform’s core strength lies in its proprietary 16-indicator algorithm, which synthesizes complex data into an intuitive Fear & Greed score.
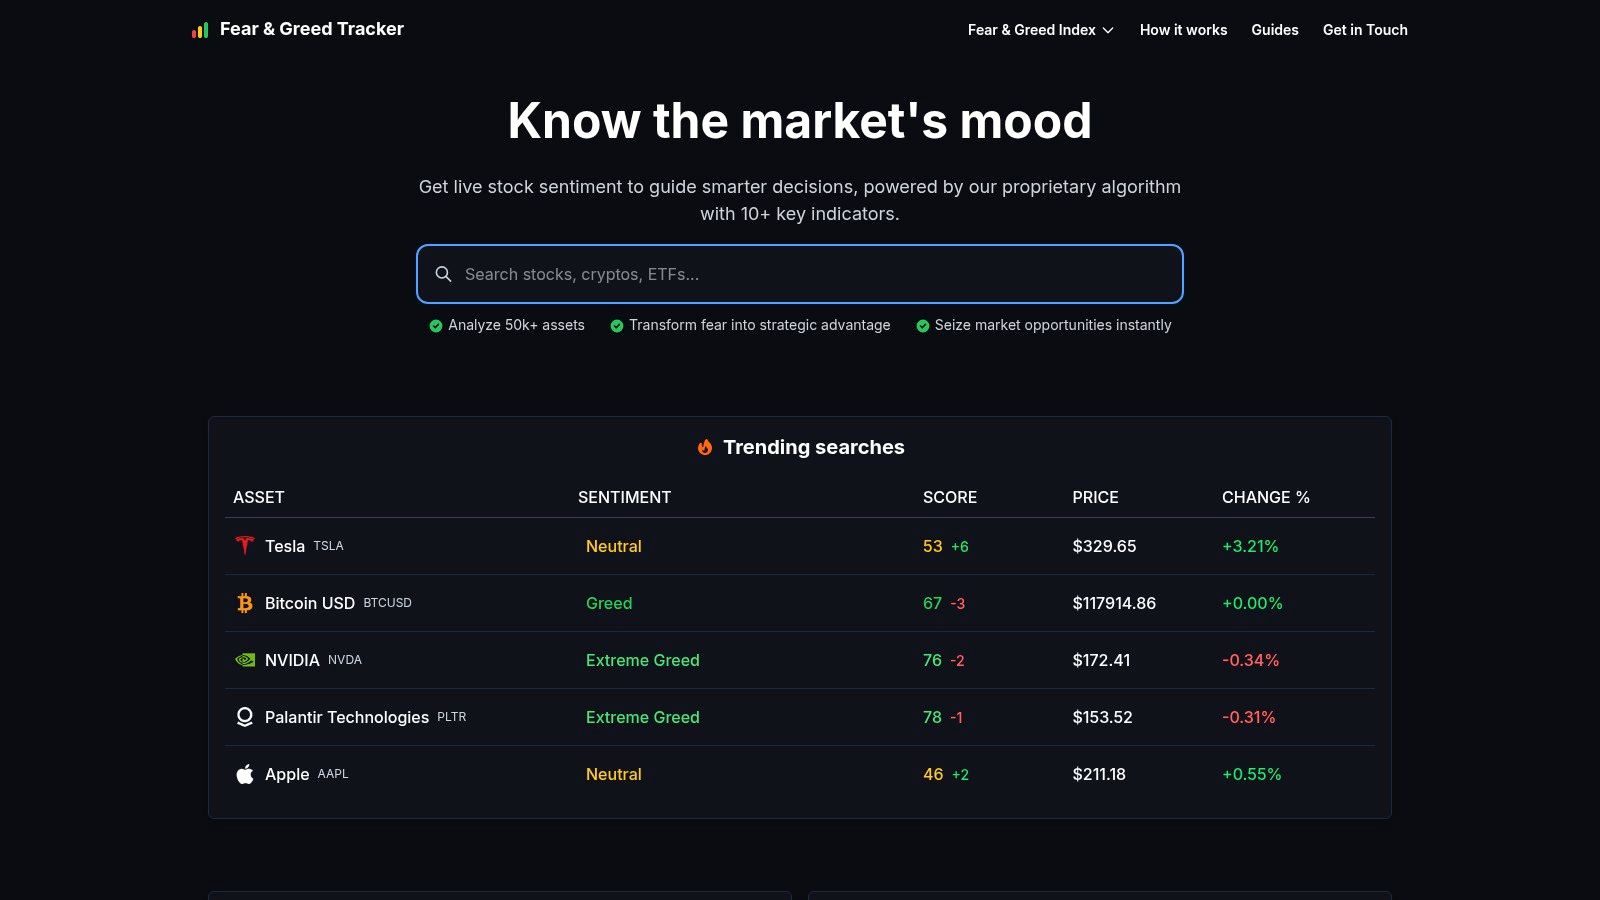
This tool excels by providing real-time sentiment analysis for an astonishing range of over 50,000 stocks and cryptocurrencies. This comprehensive coverage, which includes major indices like the S&P 500 and leading digital assets like Bitcoin, is unparalleled in the free software space. The user-friendly interface makes navigating this vast amount of data straightforward, even for novice investors.
Key Strengths and Use Cases
One of the most practical features is the customizable alert system. Users can set notifications for specific assets, receiving immediate updates when market sentiment shifts. This capability is invaluable for timing entries and exits, especially in volatile market conditions.
- Ideal for Contrarian Investors: Use the "Extreme Fear" signal to identify potentially undervalued assets that the market is overly pessimistic about.
- Risk Management Tool: Monitor "Extreme Greed" levels in your portfolio to recognize when assets may be overbought and due for a correction.
- Day and Swing Trading: Leverage real-time sentiment shifts to make rapid, data-driven trading decisions throughout the day.
The platform also provides robust fundamental and technical analysis data alongside its sentiment scores, offering a holistic view of any asset. For those new to this type of analysis, the site includes detailed educational guides. You can explore their guide to learn how to effectively use market sentiment analysis for trading.
| Feature | Benefit |
|---|---|
| Real-Time Sentiment Scores | Provides an immediate emotional snapshot of the market for timely decisions. |
| 50,000+ Assets Covered | Ensures comprehensive analysis across equities, indices, and cryptocurrencies. |
| Customizable Alerts | Enables proactive risk management and opportunity spotting. |
| Integrated Analysis | Combines sentiment, technical, and fundamental data for a 360-degree view. |
| Educational Resources | Empowers users to master sentiment analysis and improve their strategies. |
While the platform is free to use, direct pricing information for any premium tiers is not publicly listed, which may require direct contact for more advanced features. It is also important to remember that the insights are for informational purposes and do not constitute direct financial advice.
Website: https://feargreedtracker.com
2. TradingView
TradingView stands out as a titan in the world of market analysis, blending powerful charting capabilities with a social network for traders. It is arguably the best free stock analysis software for users who prioritize technical analysis and community collaboration. The platform's core strength lies in its highly customizable and interactive charts, which are not only intuitive for beginners but also robust enough for seasoned professionals. Users can apply hundreds of pre-built indicators or dive into a massive library of community-created scripts using Pine Script, TradingView's proprietary programming language.
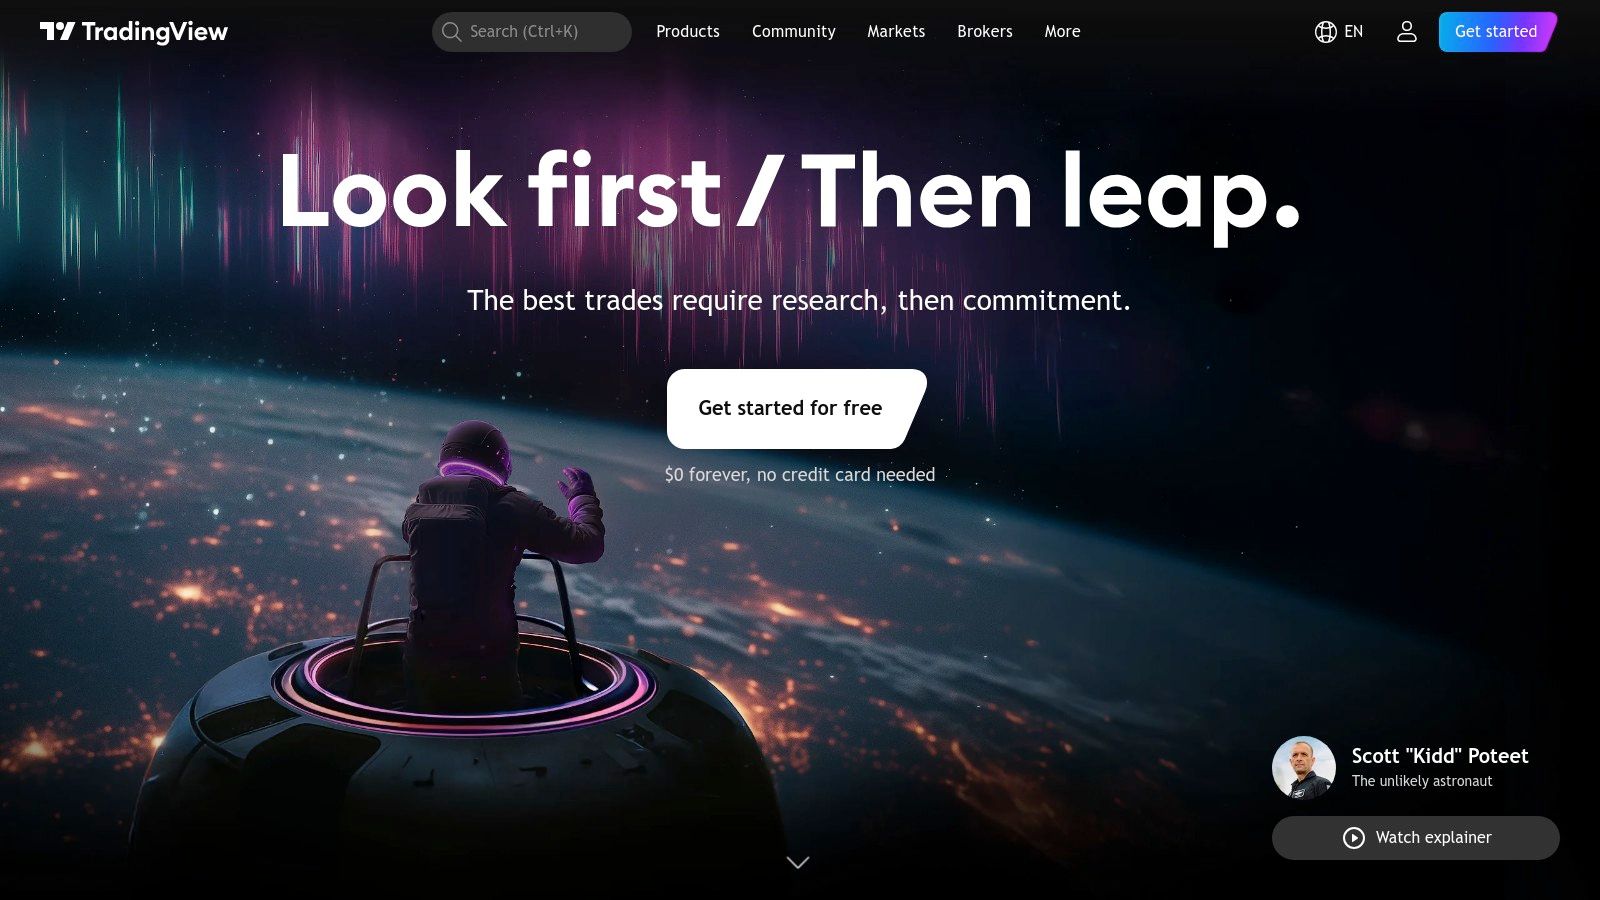
The platform’s social features allow you to follow other traders, share your own chart analyses, and get feedback, creating a dynamic learning environment. While the free "Basic" plan is incredibly generous, it comes with ads and limitations, such as the number of indicators per chart and the frequency of data refresh. For those just starting, learning the fundamentals is key; you can explore this beginner's guide to technical analysis to make the most of TradingView's tools.
Key Information:
- Best For: Technical analysts, chart-focused traders, and those seeking community insights.
- Unique Feature: An unparalleled combination of advanced charting tools and a social media-like community for traders.
- Pricing: A powerful free plan is available. Paid plans start at $14.95/month for more features and ad-free access.
- Access: https://www.tradingview.com
3. Finviz
Finviz excels in its ability to present a vast amount of financial data in a highly visual and scannable format, making it a top contender for the best free stock analysis software for traders who need to find opportunities quickly. Its standout feature is an incredibly robust stock screener, which allows users to filter thousands of stocks by over 60 different fundamental and technical metrics. This makes it exceptionally easy to pinpoint companies that match a specific investment strategy, from value investing to growth-focused trades.
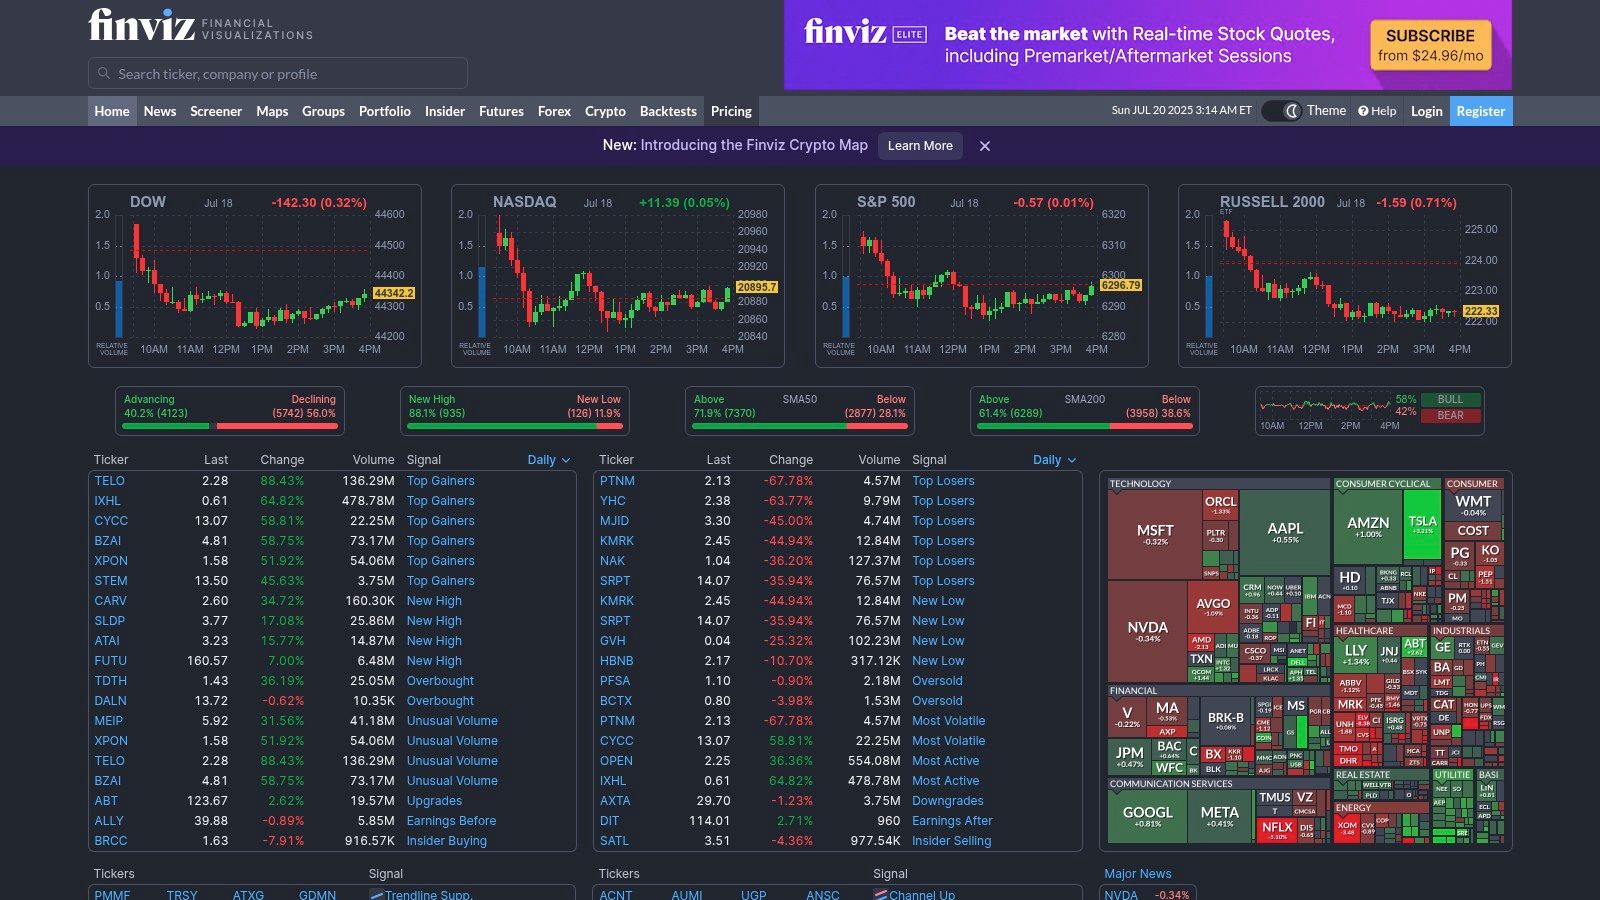
The platform’s iconic heat maps provide an at-a-glance overview of market performance, visualizing sectors and industries to help users instantly identify trends and outliers. While the free version is powerful, it does come with ads and uses delayed data. For basic screening and market research, the free access is more than sufficient and notably requires no registration, allowing for immediate use.
Key Information:
- Best For: Investors and traders focused on screening, fundamental data, and visual market overviews.
- Unique Feature: An elite-level stock screener combined with intuitive heat maps for rapid market analysis.
- Pricing: A comprehensive free plan is available. Finviz Elite (paid plan) offers real-time data and advanced features starting at $24.96/month.
- Access: https://finviz.com
4. Yahoo Finance
Yahoo Finance has long been a household name, serving as a reliable first stop for millions of investors. It excels as a comprehensive hub for financial news, basic data, and portfolio management, making it one of the best free stock analysis software options for those who value accessibility and breadth over deep technical complexity. The platform integrates real-time quotes, fundamental company data like financial statements and key ratios, and breaking news from various reputable sources, all within an easy-to-navigate interface. Its strength lies in consolidating everything a fundamental investor needs to stay informed in one place.
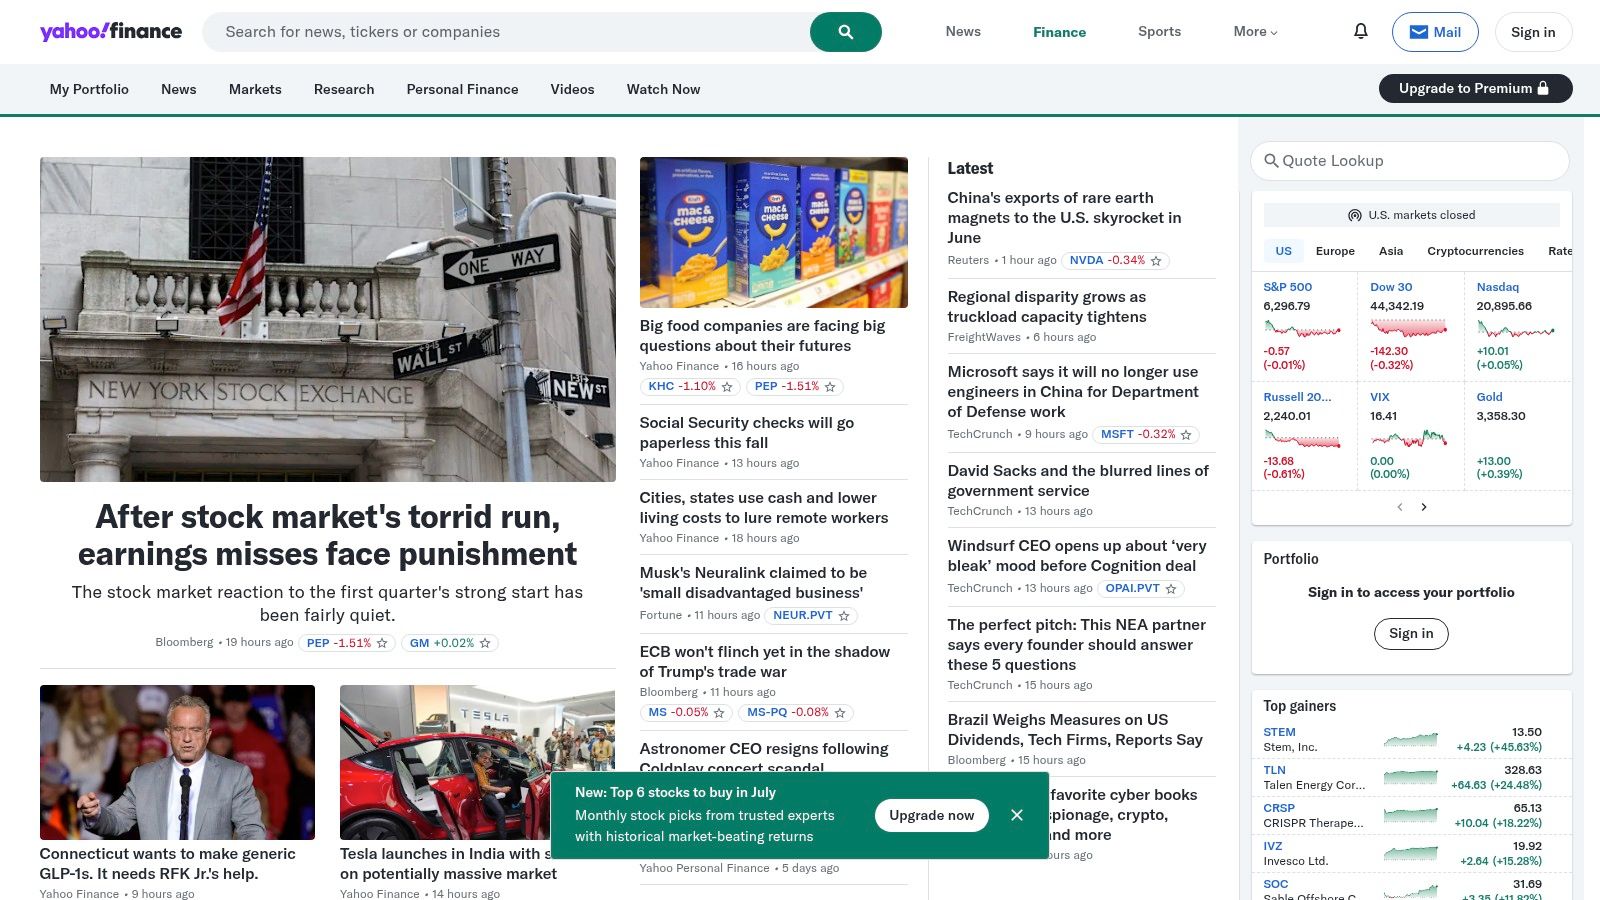
While its interactive charts are functional for basic trend analysis, they lack the advanced tools and customization found on platforms like TradingView. However, its portfolio and watchlist features are excellent, allowing users to link brokerage accounts for a consolidated view of their holdings. This makes it ideal for long-term investors who want to track their portfolio's performance and stay updated on market-moving news without needing a specialized charting application. The free version is robust but supported by ads.
Key Information:
- Best For: Fundamental investors, beginners, and those needing a central hub for news and portfolio tracking.
- Unique Feature: Seamless integration of comprehensive financial news, portfolio tracking, and essential market data in a user-friendly package.
- Pricing: Free ad-supported version is widely used. Premium plans with advanced features start at $20.83/month (billed annually).
- Access: https://finance.yahoo.com
5. Stock Rover
Stock Rover excels in the realm of fundamental analysis, making it a top contender for value investors and long-term portfolio managers searching for the best free stock analysis software. The platform’s core strength is its powerful and highly detailed stock screener, which allows users to filter through thousands of companies using over 500 different financial metrics. It provides extensive historical data, analyst ratings, and customizable dashboards, enabling deep dives into a company's financial health. While its technical charting tools are not as advanced as platforms like TradingView, its focus on fundamental data is unparalleled in the free tier.
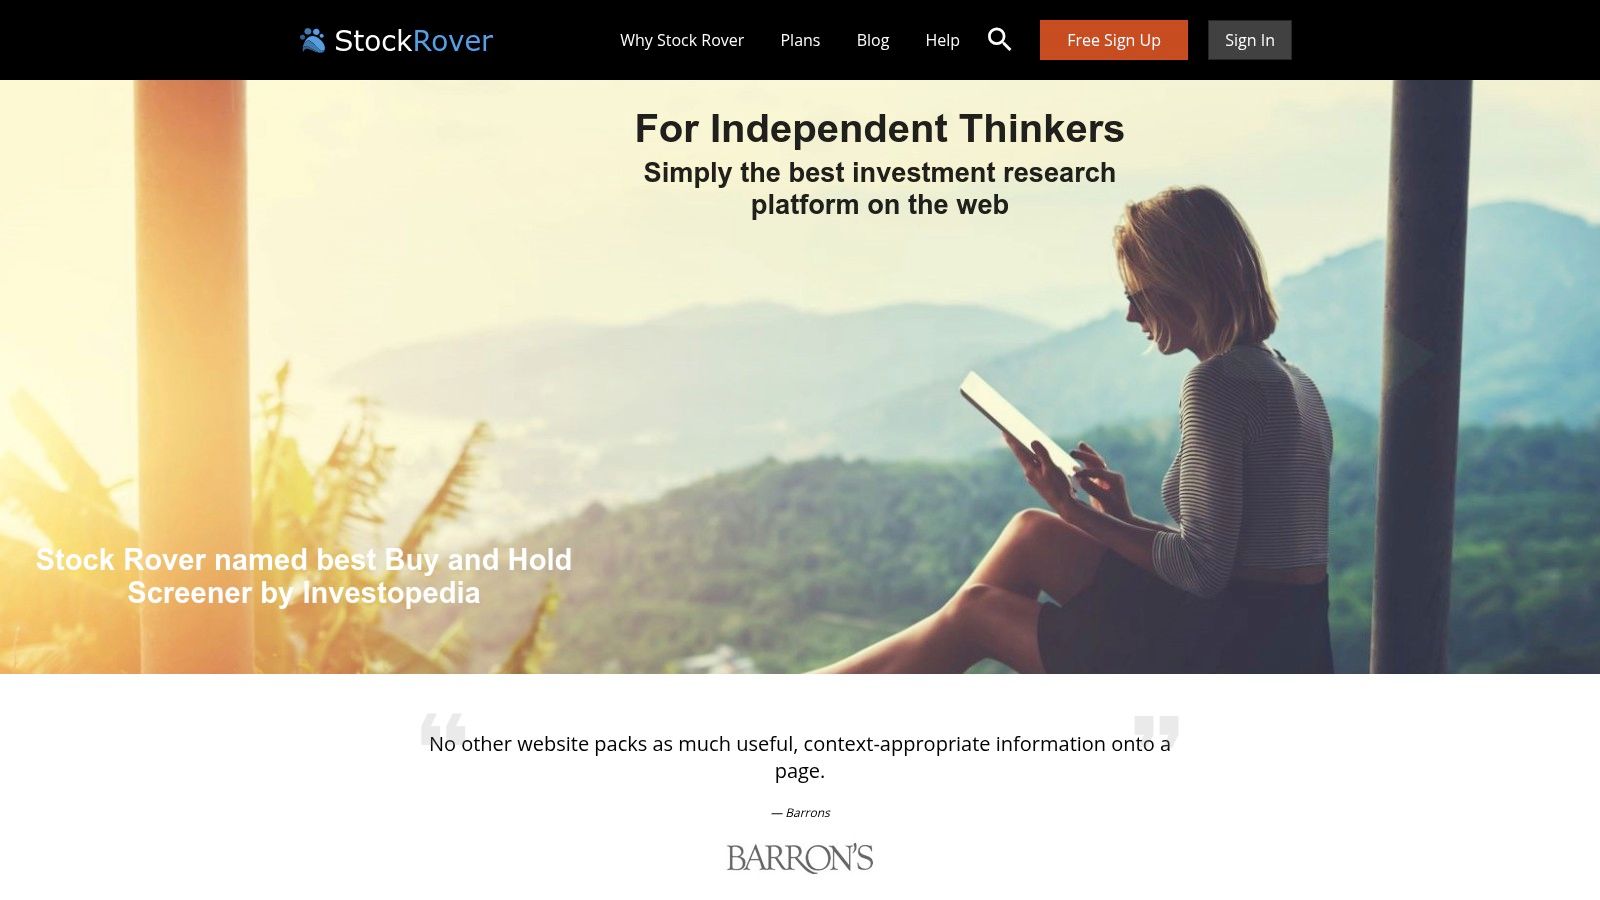
The interface, which resembles a spreadsheet, is incredibly data-rich and can be tailored to display the specific metrics you care about most. Stock Rover also offers robust portfolio analysis tools, allowing you to link your brokerage accounts for a comprehensive view of your holdings. The free version is remarkably capable, offering a substantial toolkit for serious research, though some of its most powerful screening and portfolio features are reserved for premium subscribers.
Key Information:
- Best For: Value investors, long-term investors, and anyone focused on fundamental data.
- Unique Feature: An exceptionally powerful stock screener with over 500 filterable metrics and extensive historical financial data.
- Pricing: A generous free plan is available. Paid plans start at $7.99/month for advanced features.
- Access: https://www.stockrover.com
6. Barchart
Barchart serves as a comprehensive market data hub, offering a broad spectrum of tools that cater to both fundamental and technical analysts. It excels in providing extensive data across various asset classes, including stocks, ETFs, futures, and options, making it a versatile choice for investors with diverse portfolios. The platform provides robust stock screeners, advanced charting capabilities with numerous technical indicators, and customizable watchlists, positioning it as a strong contender for the best free stock analysis software for all-around market research.
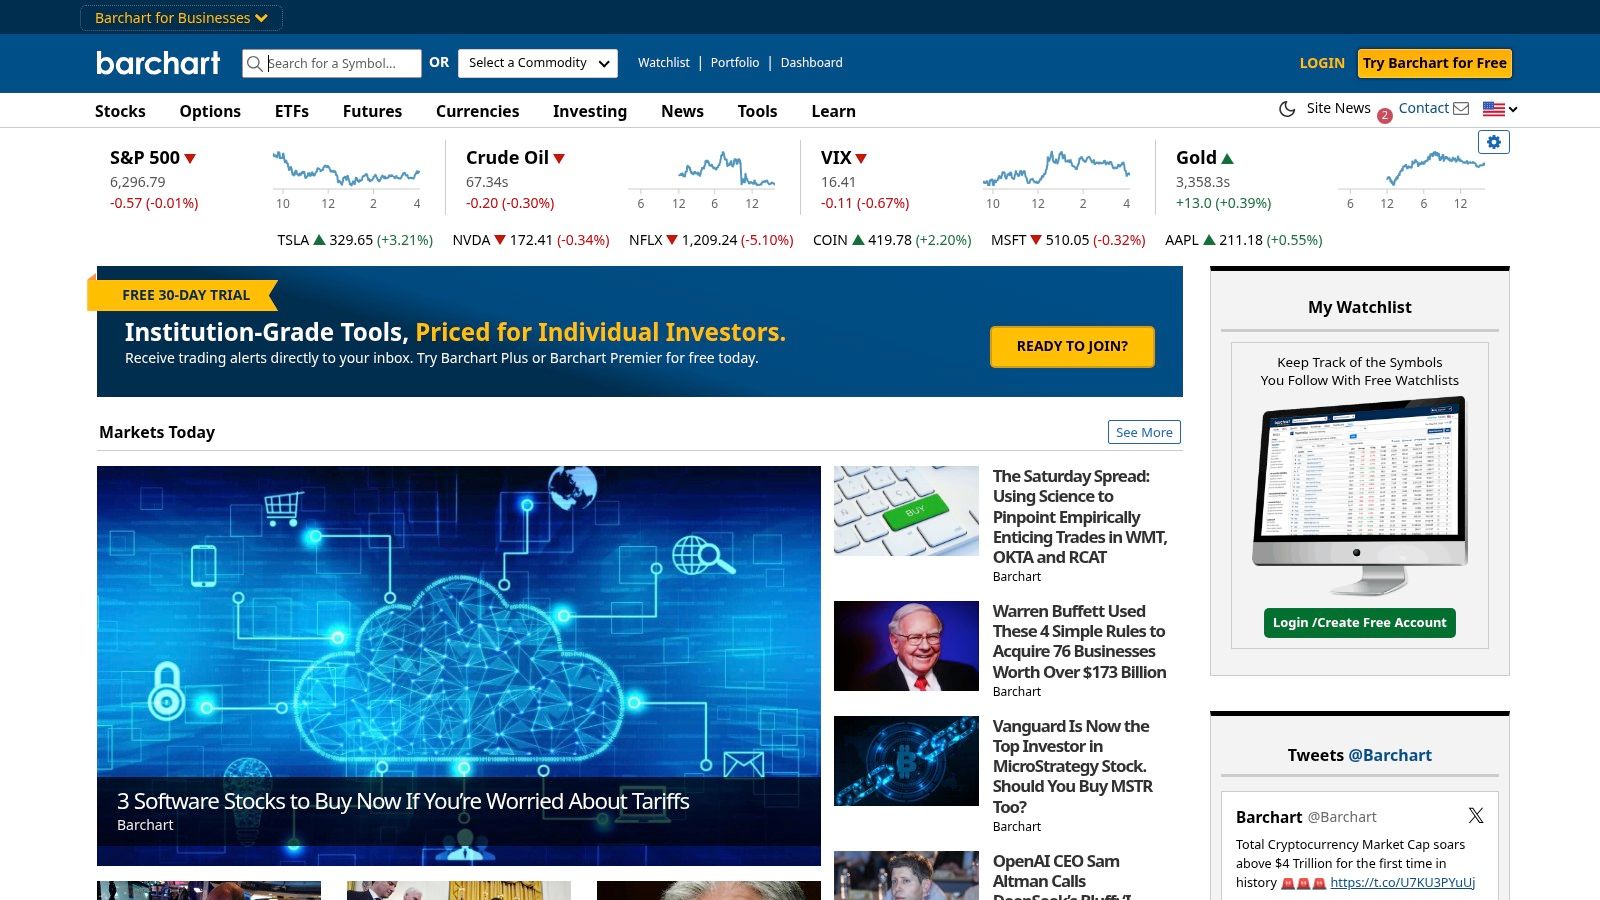
While Barchart offers a significant portion of its toolset for free, users must register for an account to unlock features like saved portfolios and custom chart templates. The interface is data-rich yet remains relatively user-friendly, presenting complex information in an accessible format. For those needing more advanced real-time data or specialized tools, a premium subscription is available, but the free version provides more than enough functionality for the average retail investor to conduct thorough analysis.
Key Information:
- Best For: Investors needing comprehensive data across multiple asset classes and powerful screening tools.
- Unique Feature: Extensive market coverage beyond just stocks, including detailed options and futures data, all within a free platform.
- Pricing: A generous free version is available with registration. Barchart Premier starts at $29.95/month for advanced features.
- Access: https://www.barchart.com
7. Investing.com
Investing.com positions itself as an all-in-one financial portal, offering a comprehensive suite of tools that go far beyond just stock analysis. It is an excellent free resource for global investors who need a broad overview of markets, including real-time data for stocks, commodities, cryptocurrencies, and forex. The platform’s strength lies in its sheer breadth of information, consolidating live quotes, breaking financial news, and a detailed economic calendar into one accessible hub. For those who want a complete market picture without juggling multiple tabs, this is a top-tier choice.
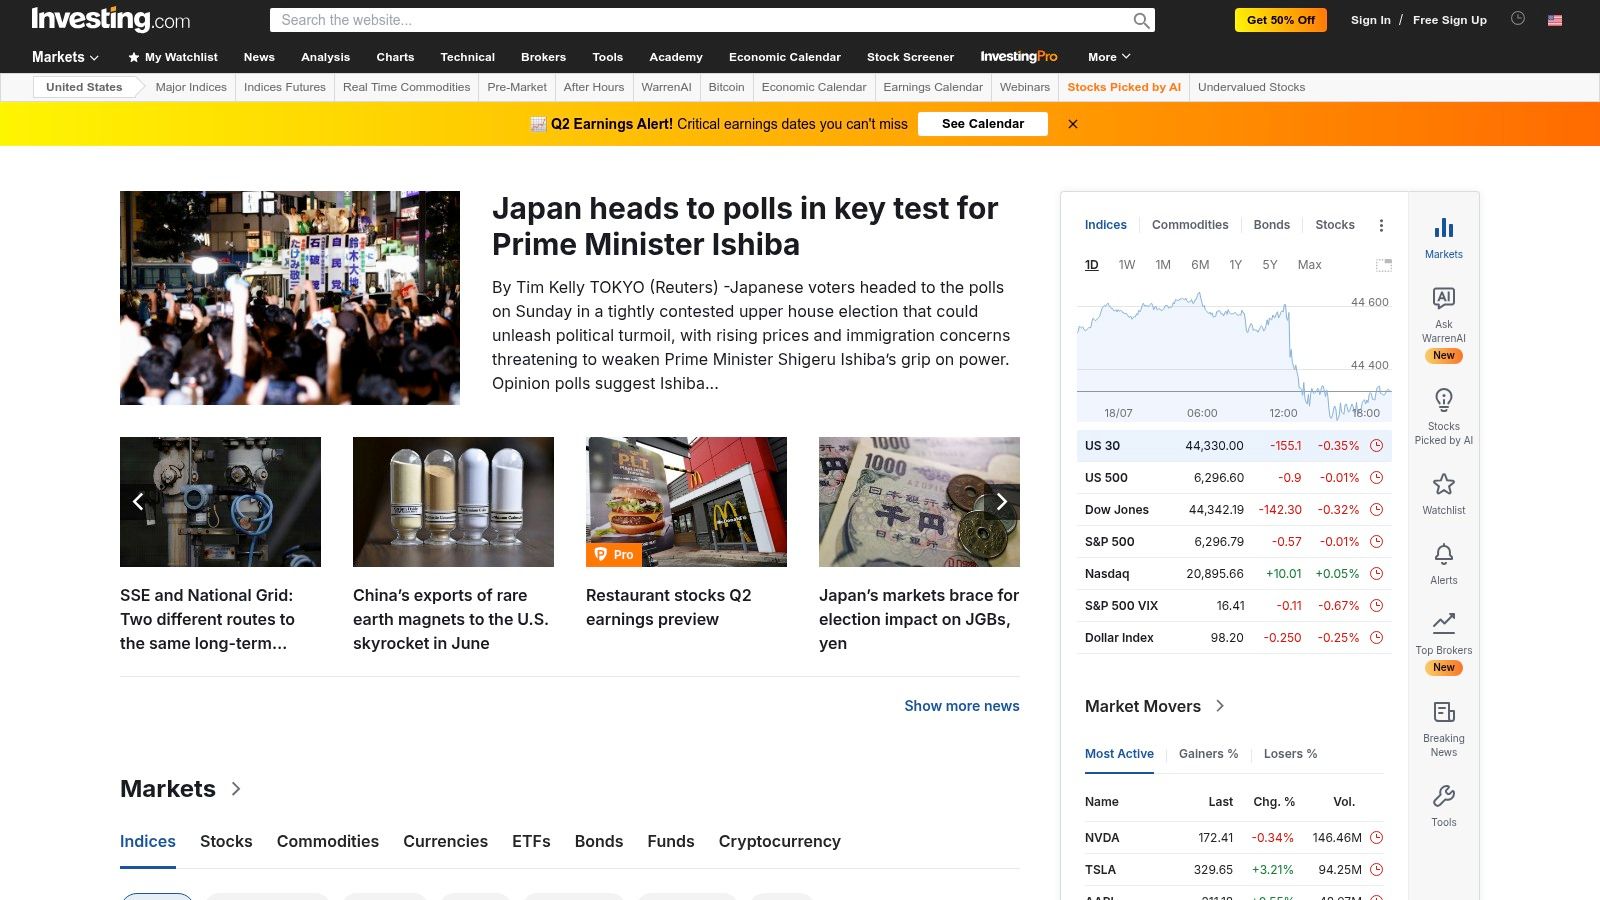
The user experience is generally straightforward, with customizable portfolio trackers and alerts available on both its website and a highly-rated mobile app. While its charting tools are solid and include a good range of technical indicators, they may not feel as advanced or fluid as those on specialized platforms like TradingView. The free version is supported by ads, which can be intrusive, but the amount of data and tools provided without a fee makes it a contender for the best free stock analysis software for the globally-minded investor.
Key Information:
- Best For: Global investors and traders who need comprehensive market data, news, and an economic calendar in one place.
- Unique Feature: Extensive coverage of a wide range of international financial instruments and a robust, integrated economic calendar.
- Pricing: Most tools and data are free with ads. An ad-free "InvestingPro" subscription with advanced features is available.
- Access: https://www.investing.com
8. ChartMill
ChartMill excels by offering a powerful and highly customizable stock screener that seamlessly integrates both technical and fundamental analysis. It's an excellent platform for investors who want to systematically find stocks that meet very specific criteria, from P/E ratios to complex technical chart patterns. The interface is designed to be intuitive, making it one of the more approachable options for those new to screening, while still packing enough filters to satisfy experienced analysts. Its combination of screening power and user-friendliness makes it a top contender for the best free stock analysis software.
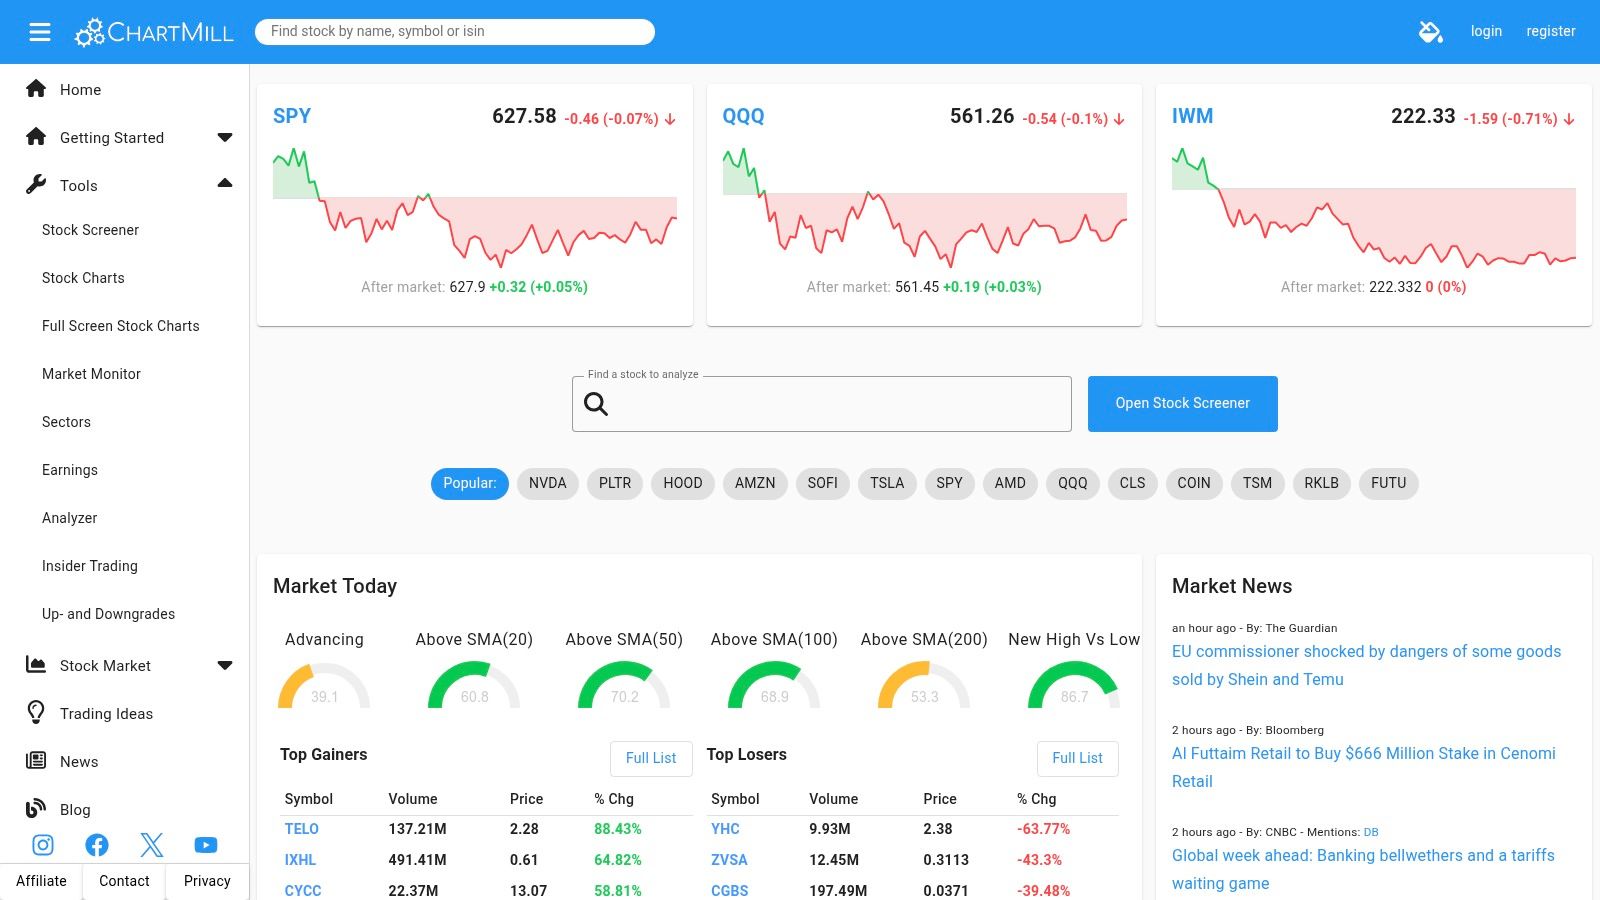
The platform also provides solid charting tools and portfolio management features, allowing users to track their discoveries and performance directly. While the free version is robust, providing access to most core features with end-of-day data, a subscription is necessary for real-time data and some of the more advanced analytical tools. The inclusion of educational tutorials helps flatten the learning curve, making it a valuable resource for traders looking to refine their stock-picking strategies based on data-driven insights.
Key Information:
- Best For: Investors focused on discovering new opportunities through detailed stock screening.
- Unique Feature: An exceptionally comprehensive and customizable stock screener that combines fundamental and technical filters.
- Pricing: A generous free plan is available. A paid subscription is required for real-time data and advanced features.
- Access: https://www.chartmill.com
9. StockCharts.com
StockCharts.com is a venerable name in online charting, dedicated to providing high-quality tools for technical analysts. It has long been a go-to resource for traders who value clean, precise, and highly customizable charting without the social noise of other platforms. The platform's strength is its ChartSchool, an extensive educational resource that helps new and experienced traders alike understand complex technical concepts, making it more than just a tool, but a complete learning ecosystem.
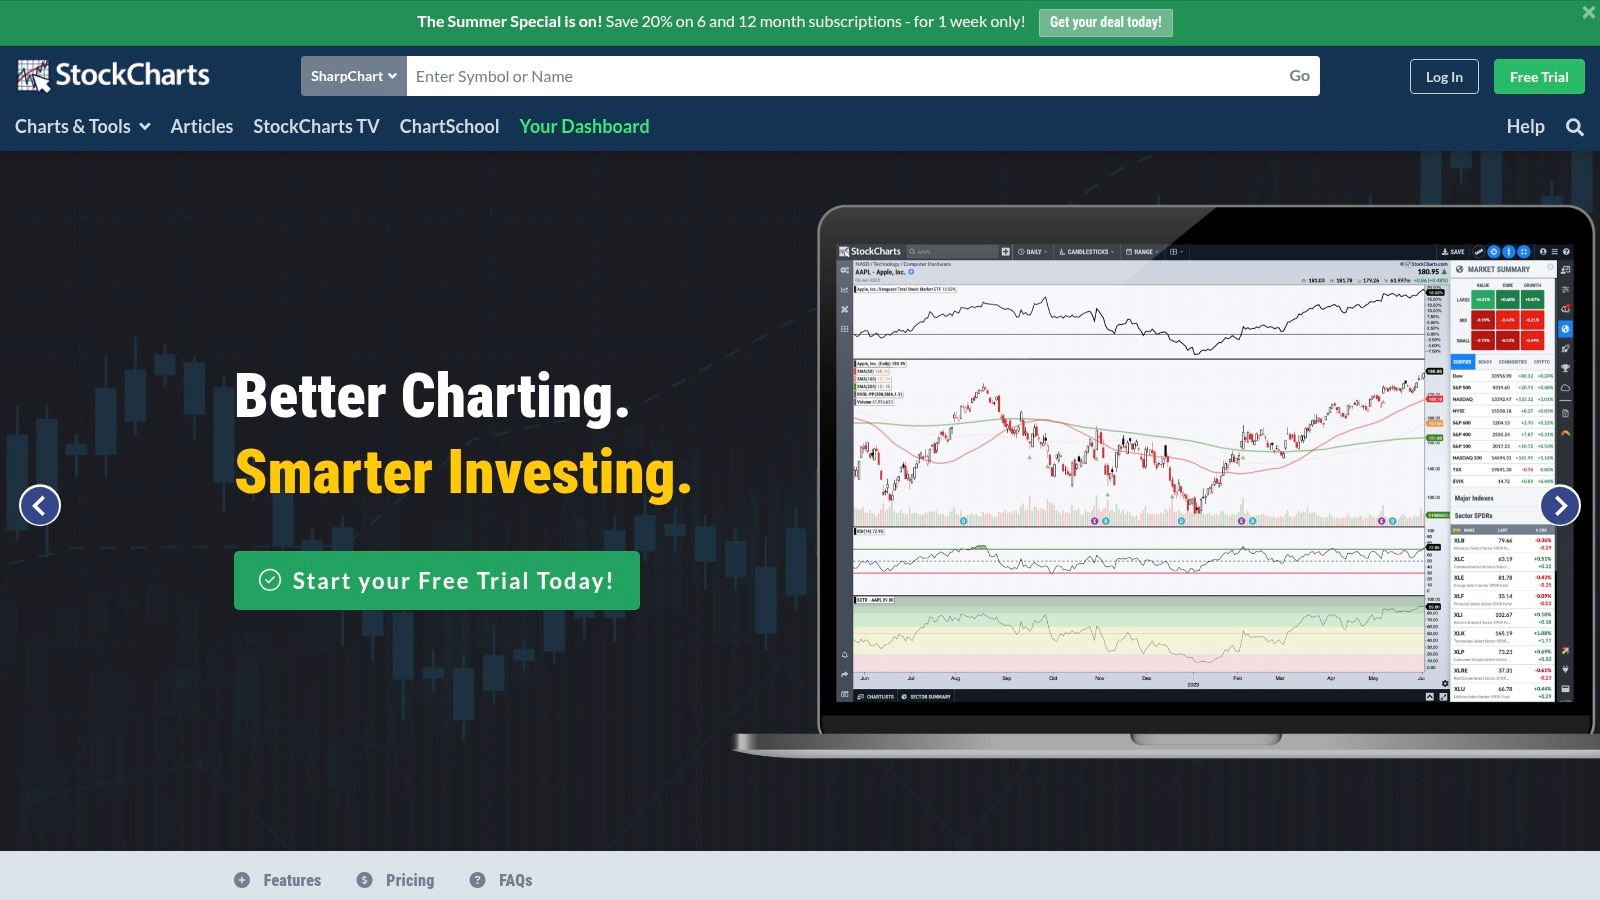
While the user interface might feel less modern than some newer competitors, its focus on function over form is appreciated by serious technicians. The free version offers robust basic charting capabilities, allowing users to apply multiple indicators and access predefined scans. For those who want to truly master chart analysis, StockCharts.com stands out as one of the best free stock analysis software options that pairs powerful tools with deep educational content, though its most advanced features and real-time data require a paid subscription.
Key Information:
- Best For: Serious technical analysts and traders focused on education and mastering charting techniques.
- Unique Feature: An extensive "ChartSchool" educational section that provides in-depth articles on virtually every aspect of technical analysis.
- Pricing: Free plan with basic charting is available. Paid plans with advanced features start at $14.95/month.
- Access: https://stockcharts.com
10. ThinkorSwim by TD Ameritrade
ThinkorSwim, now part of Charles Schwab following its acquisition of TD Ameritrade, offers a professional-grade trading and analysis platform completely free of charge. It is a powerhouse designed for serious and active traders, providing a level of depth that rivals many premium paid services. The platform excels with its advanced charting capabilities, which include an extensive library of technical studies and drawing tools, alongside the ability to create custom indicators using its proprietary ThinkScript language. This makes it some of the most robust free stock analysis software for those who demand institutional-quality tools without the cost.
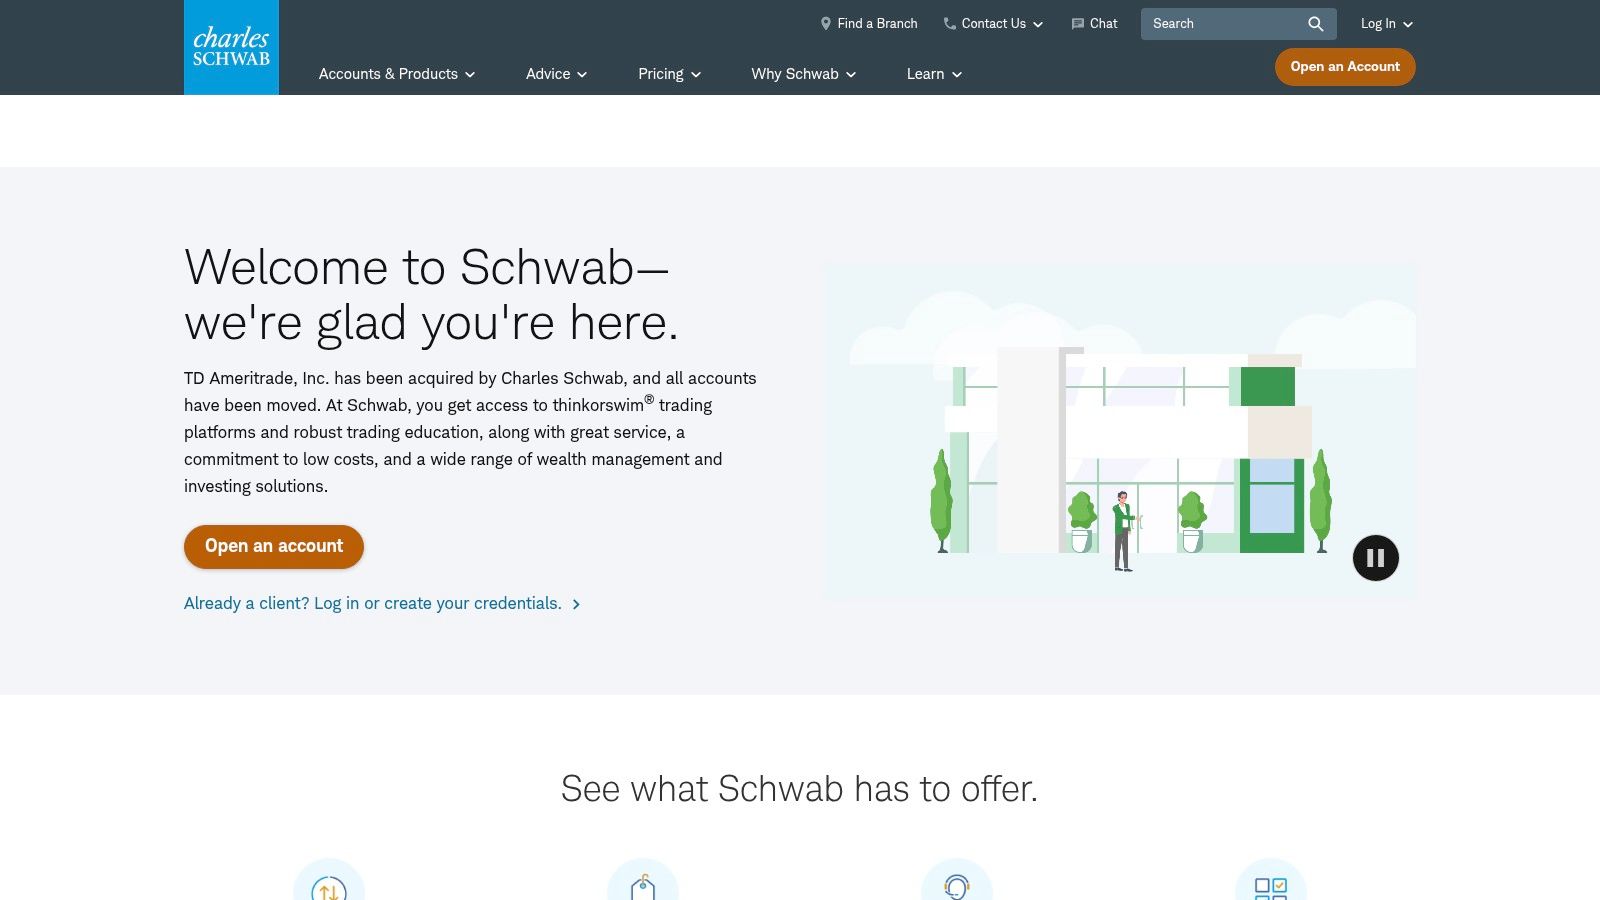
One of its most acclaimed features is the "paperMoney" simulator, which allows users to practice trading strategies with virtual funds in a live market environment. This is invaluable for testing complex options strategies or getting accustomed to the platform's extensive features. While the sheer number of tools can present a steep learning curve for beginners, the investment in learning the software pays dividends. Accessing its full, real-time capabilities requires a funded brokerage account, but the platform’s power and depth are undeniable.
Key Information:
- Best For: Active traders, options traders, and technical analysts who want professional-level tools.
- Unique Feature: A comprehensive suite of institutional-grade analysis tools, including advanced options strategy analysis and custom scripting, available for free.
- Pricing: Free to use for Charles Schwab/TD Ameritrade account holders.
- Access: https://www.tdameritrade.com/tools-and-platforms/thinkorswim.html
11. Investopedia Stock Simulator
For those looking to transition from theory to practice without risking capital, the Investopedia Stock Simulator is an unparalleled educational tool. It provides a hyper-realistic, risk-free virtual trading environment where beginners can learn the ropes and experienced investors can test new strategies. Users receive a virtual cash sum to build a portfolio, executing trades with real-time market data for a wide range of stocks. It’s not just a simulator; it’s a comprehensive learning ecosystem integrated with Investopedia's vast library of articles and tutorials.
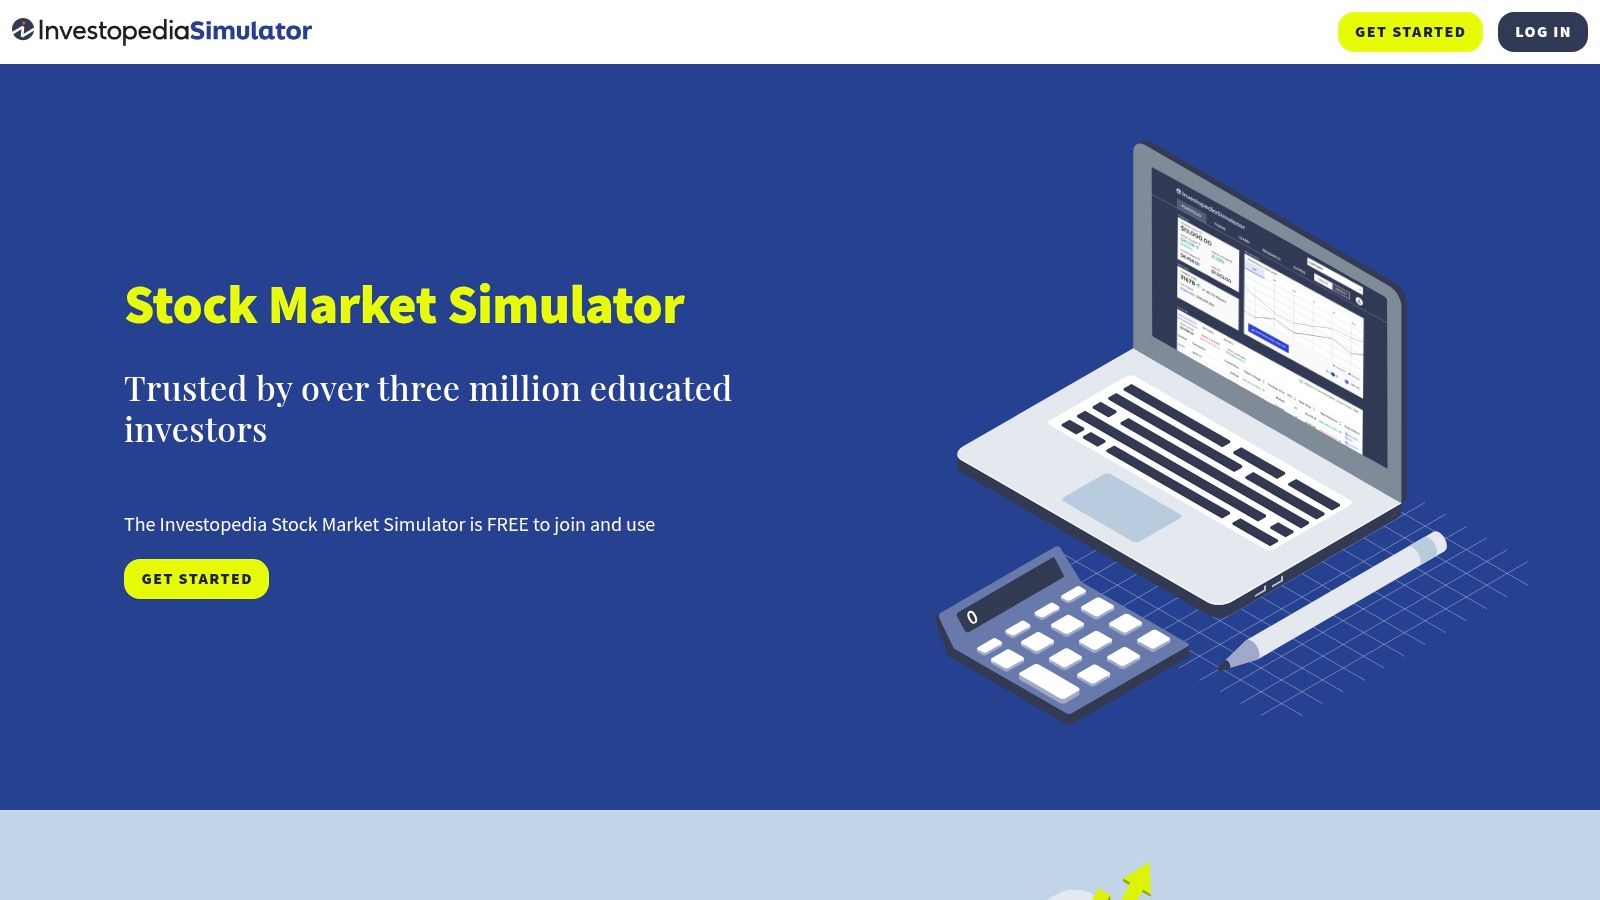
The platform stands out by fostering a sense of community through public and private trading challenges. You can compete against thousands of other users, see how your strategies stack up on leaderboards, and join specific groups to discuss tactics. While it's not designed for direct market analysis like other platforms, its value lies in applying analysis in a practical setting. This makes it an essential piece of any new trader's toolkit and a contender for the best free stock analysis software for educational purposes.
Key Information:
- Best For: Beginners learning to trade, students, and investors testing new strategies risk-free.
- Unique Feature: A robust trading simulator fully integrated with extensive educational resources and competitive trading challenges.
- Pricing: Completely free to use.
- Access: https://www.investopedia.com/simulator
12. Zacks Investment Research
Zacks Investment Research carves out its niche by focusing intensely on corporate earnings estimates and analyst revisions. It operates on the principle that earnings estimate revisions are the most powerful force impacting stock prices. This makes it an excellent free stock analysis software for fundamental investors who want to go beyond standard financial metrics and dive into the predictive power of earnings data. The platform's centerpiece is the proprietary Zacks Rank, a quantitative stock-rating system that has a proven, long-term track record of outperforming the S&P 500.
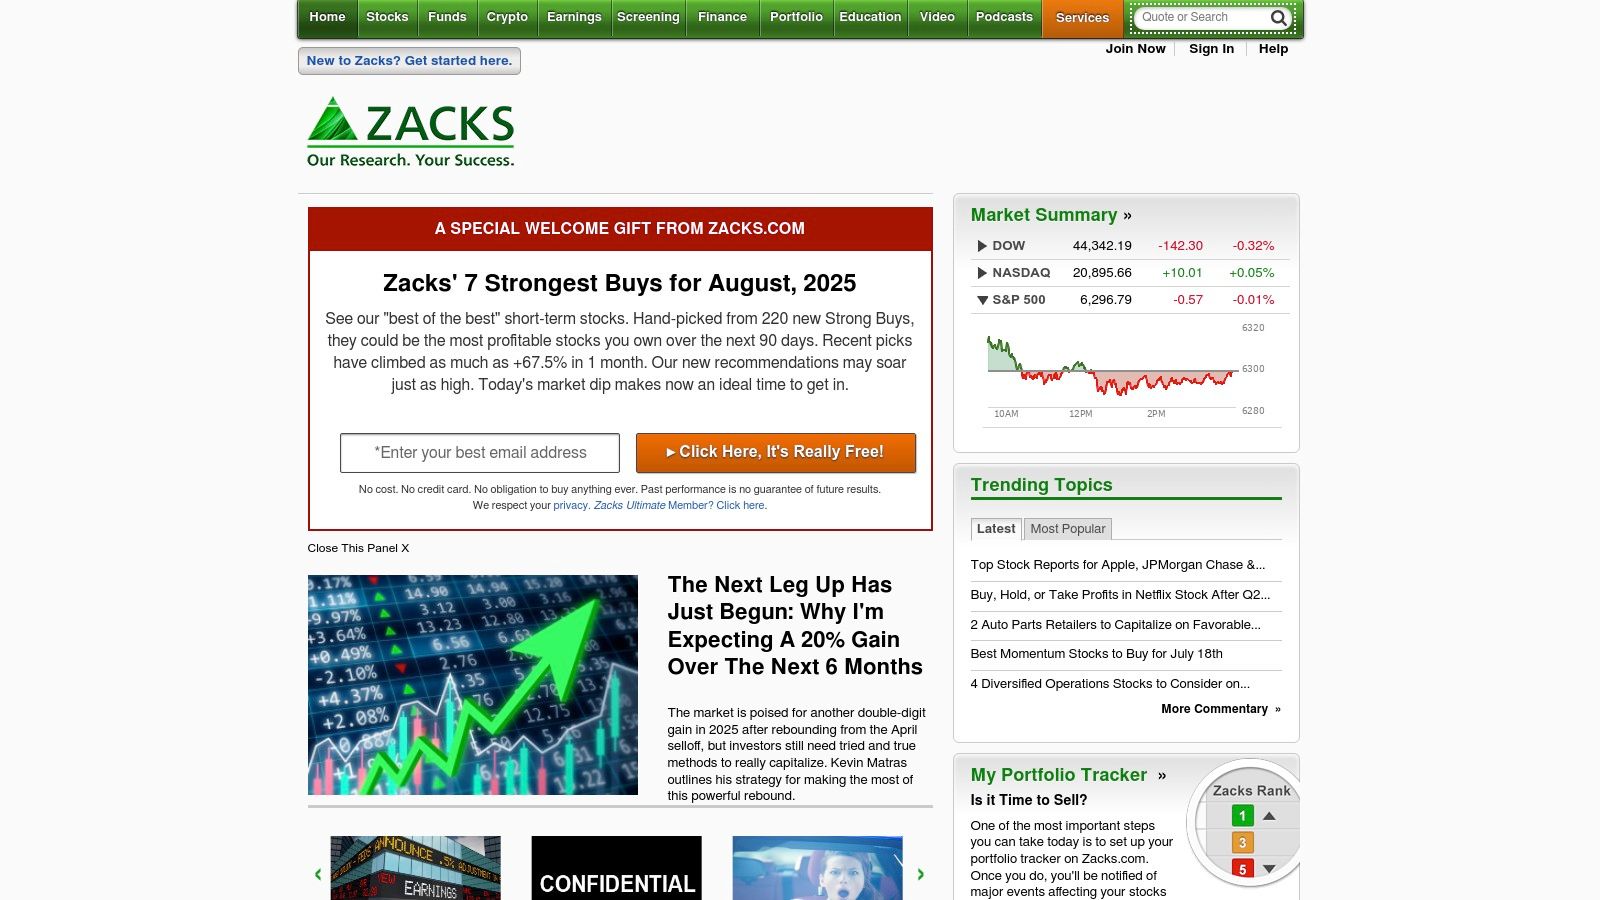
While much of the in-depth research and premium screening tools are behind a paywall, the free version still provides significant value, including access to the basic Zacks Rank for thousands of stocks. Users can also see earnings surprise data and basic analyst ratings. To get the most out of the platform, it's beneficial to understand how to interpret analyst ratings and integrate them into your research process. However, new users might find the interface slightly dated and less intuitive compared to more modern platforms.
Key Information:
- Best For: Fundamental investors prioritizing earnings data and quantitative ratings.
- Unique Feature: The Zacks Rank system, which grades stocks based on earnings estimate revisions.
- Pricing: A free version offers access to basic ranks and data. Zacks Premium starts at $249/year for full access.
- Access: https://www.zacks.com
Key Features Comparison of 12 Free Stock Analysis Tools
| Platform | Core Features / Coverage | User Experience / Quality ★ | Value Proposition 💰 | Target Audience 👥 | Unique Selling Points ✨ |
|---|---|---|---|---|---|
| Fear Greed Tracker 🏆 | Real-time Fear & Greed scores for 50,000+ assets, 16-indicator algo | ★★★★☆ | Contact for pricing 💰 | Retail investors, traders, advisors 👥 | Proprietary sentiment index, customizable alerts ✨ |
| TradingView | Advanced charting, 100+ indicators, social trading | ★★★★☆ | Freemium, paid for advanced 💰 | Beginners to advanced traders 👥 | Extensive script library, broker integration ✨ |
| Finviz | Stock screener, heat maps, insider data | ★★★☆☆ | Free with ads; subscription for real-time 💰 | Stock screeners, visual analysts 👥 | Fast screening, heat maps ✨ |
| Yahoo Finance | Real-time quotes, news, portfolio tracking | ★★★☆☆ | Free with ads 💰 | Casual investors, portfolio trackers 👥 | Broad financial news, easy interface ✨ |
| Stock Rover | Fundamental analysis, 500+ filters, portfolio tools | ★★★★☆ | Freemium; premium features 💰 | Value investors, long-term investors 👥 | Deep fundamental data, analyst ratings ✨ |
| Barchart | Market data, charts, stock/ETF/options screeners | ★★★☆☆ | Free basic, subscription advanced 💰 | Multi-asset traders, analysts 👥 | Multi-asset coverage, customizable alerts ✨ |
| Investing.com | Market data, charts, news, economic calendar | ★★★☆☆ | Mostly free; paywall for some tools 💰 | General investors, active traders 👥 | Wide instrument coverage, mobile app ✨ |
| ChartMill | Screening, tech & fundamental analysis, portfolio management | ★★★☆☆ | Free with paid advanced features 💰 | Beginners to intermediate investors 👥 | User-friendly tutorials, screening filters ✨ |
| StockCharts.com | Advanced charting, scans, alerts, education | ★★★★☆ | Freemium; subscription for full 💰 | Technical traders, educators 👥 | Rich educational resources, predefined scans ✨ |
| ThinkorSwim by TD Ameritrade | Pro-grade charting, paper trading, scripting | ★★★★☆ | Free with TD Ameritrade account 💰 | Professional traders, advanced users 👥 | Custom scripting, integrated brokerage ✨ |
| Investopedia Stock Simulator | Virtual trading, real-time data, educational content | ★★★☆☆ | Free 💰 | Learners, beginners, strategy testers 👥 | Risk-free practice, community competitions ✨ |
| Zacks Investment Research | Stock rankings, earnings estimates, analyst reports | ★★★☆☆ | Freemium; subscription for reports 💰 | Data-driven investors, research analysts 👥 | Proprietary Zacks Rank system, earnings focus ✨ |
Final Thoughts
Navigating the world of stock market analysis no longer requires a significant financial investment in expensive software. As we've explored, the landscape is rich with powerful, free tools that can level the playing field for retail investors, day traders, and even seasoned financial advisors. The key takeaway from our deep dive into these platforms is that there is no single "best" solution; instead, the ideal choice is deeply personal and depends entirely on your individual investing style, goals, and technical comfort level.
From the comprehensive charting capabilities of TradingView and ThinkorSwim to the powerful screening functions of Finviz and Stock Rover, the diversity of options is remarkable. You have access to everything you need to build a robust analytical framework without spending a dime. The journey to finding the right software begins with a clear understanding of your own needs.
How to Choose Your Ideal Free Stock Analysis Software
Selecting the right tool from this extensive list can feel overwhelming. To simplify the process, start by asking yourself a few critical questions:
- What is my primary investment strategy? Are you a long-term, value-focused investor who needs deep fundamental data like that found on Yahoo Finance or Zacks? Or are you a short-term trader who lives and dies by technical indicators, making platforms like TradingView or ChartMill more suitable?
- How important are real-time data and advanced charting? If you're a day trader, the near-real-time data and sophisticated tools offered by platforms like ThinkorSwim are non-negotiable. For a passive investor who checks in weekly, the standard delayed data on most free platforms is perfectly adequate.
- What is my technical skill level? Beginners might find the user-friendly interface and educational resources of Yahoo Finance or the Investopedia Stock Simulator most approachable. More advanced users will appreciate the deep customization and complex screening criteria available on platforms like Finviz or StockCharts.com.
- Do I need a community or social features? Platforms like TradingView and Investing.com have built-in social components, allowing you to share ideas and see analyses from other traders, which can be a valuable learning tool.
Answering these questions will narrow down the options significantly. Your goal is to create a personalized toolkit. Don't be afraid to combine platforms; many successful investors use one tool for screening (like Finviz), another for charting (like TradingView), and a third for fundamental data (like Yahoo Finance).
Implementing Your Toolkit for Success
Once you've selected a few platforms to try, the real work begins. The most powerful best free stock analysis software is useless if not implemented correctly. Dedicate time to learning the ins and outs of your chosen tools. Watch tutorials, read help documentation, and practice using the features in a risk-free environment, perhaps with a paper trading account.
Ultimately, these platforms are just that: tools. They provide data, visualization, and analytical capabilities, but they do not make decisions for you. Your success will be determined by how you interpret the information they provide and integrate it into a disciplined, well-researched investment strategy. The path to confident, informed investing is an ongoing process of learning and refinement, and these free resources are your indispensable companions on that journey.
To supplement your technical and fundamental analysis, understanding market sentiment is a critical, often overlooked, piece of the puzzle. For a unique and powerful perspective on market psychology, consider adding the Fear Greed Tracker to your arsenal. It visualizes the emotional state of the market, helping you identify potential tops and bottoms by tracking when investors are overly fearful or greedy. Check out the Fear Greed Tracker to gain an edge by analyzing the one variable most traditional software overlooks: human emotion.