
Swing trading is a strategic approach that captures short-to-medium-term gains in a financial asset over a period of a few days to several weeks. Unlike day trading, which relies on intraday price fluctuations, swing trading focuses on identifying the "swing highs" and "swing lows" in a market's momentum. Success in this discipline hinges on one critical skill: accurately interpreting market signals to predict where the price is headed next. This is where technical indicators become indispensable tools, not just abstract lines on a chart.
This guide is designed to provide a comprehensive, no-nonsense breakdown of the best swing trading indicators used by seasoned traders. We move beyond basic definitions to offer actionable insights and practical implementation strategies. You will learn how to identify overbought or oversold conditions, confirm trend strength, spot potential reversals, and manage risk more effectively. Each indicator is presented as a distinct component of a complete trading toolkit, with clear explanations of its strengths, weaknesses, and ideal use cases.
Instead of just telling you what these indicators are, we will show you how to use them. We will explore how to combine different indicators to create a robust and confluent trading strategy. Whether you trade stocks, forex, or cryptocurrencies, mastering these tools can significantly enhance your ability to make informed, data-driven decisions. By the end of this article, you will have a clear framework for selecting and applying the right indicators to your specific swing trading style, helping you navigate market volatility with greater confidence and precision. The goal is to equip you with the knowledge to build a system that works for you.
1. Relative Strength Index (RSI)
The Relative Strength Index (RSI) is a cornerstone momentum oscillator for swing traders, celebrated for its effectiveness in identifying potential market turning points. Developed by J. Welles Wilder Jr. in 1978, it measures the speed and magnitude of recent price changes to evaluate overbought or oversold conditions in the price of a stock or other asset. The indicator oscillates between 0 and 100, providing clear, quantifiable signals that are ideal for capturing price swings over a 3 to 10-day period.
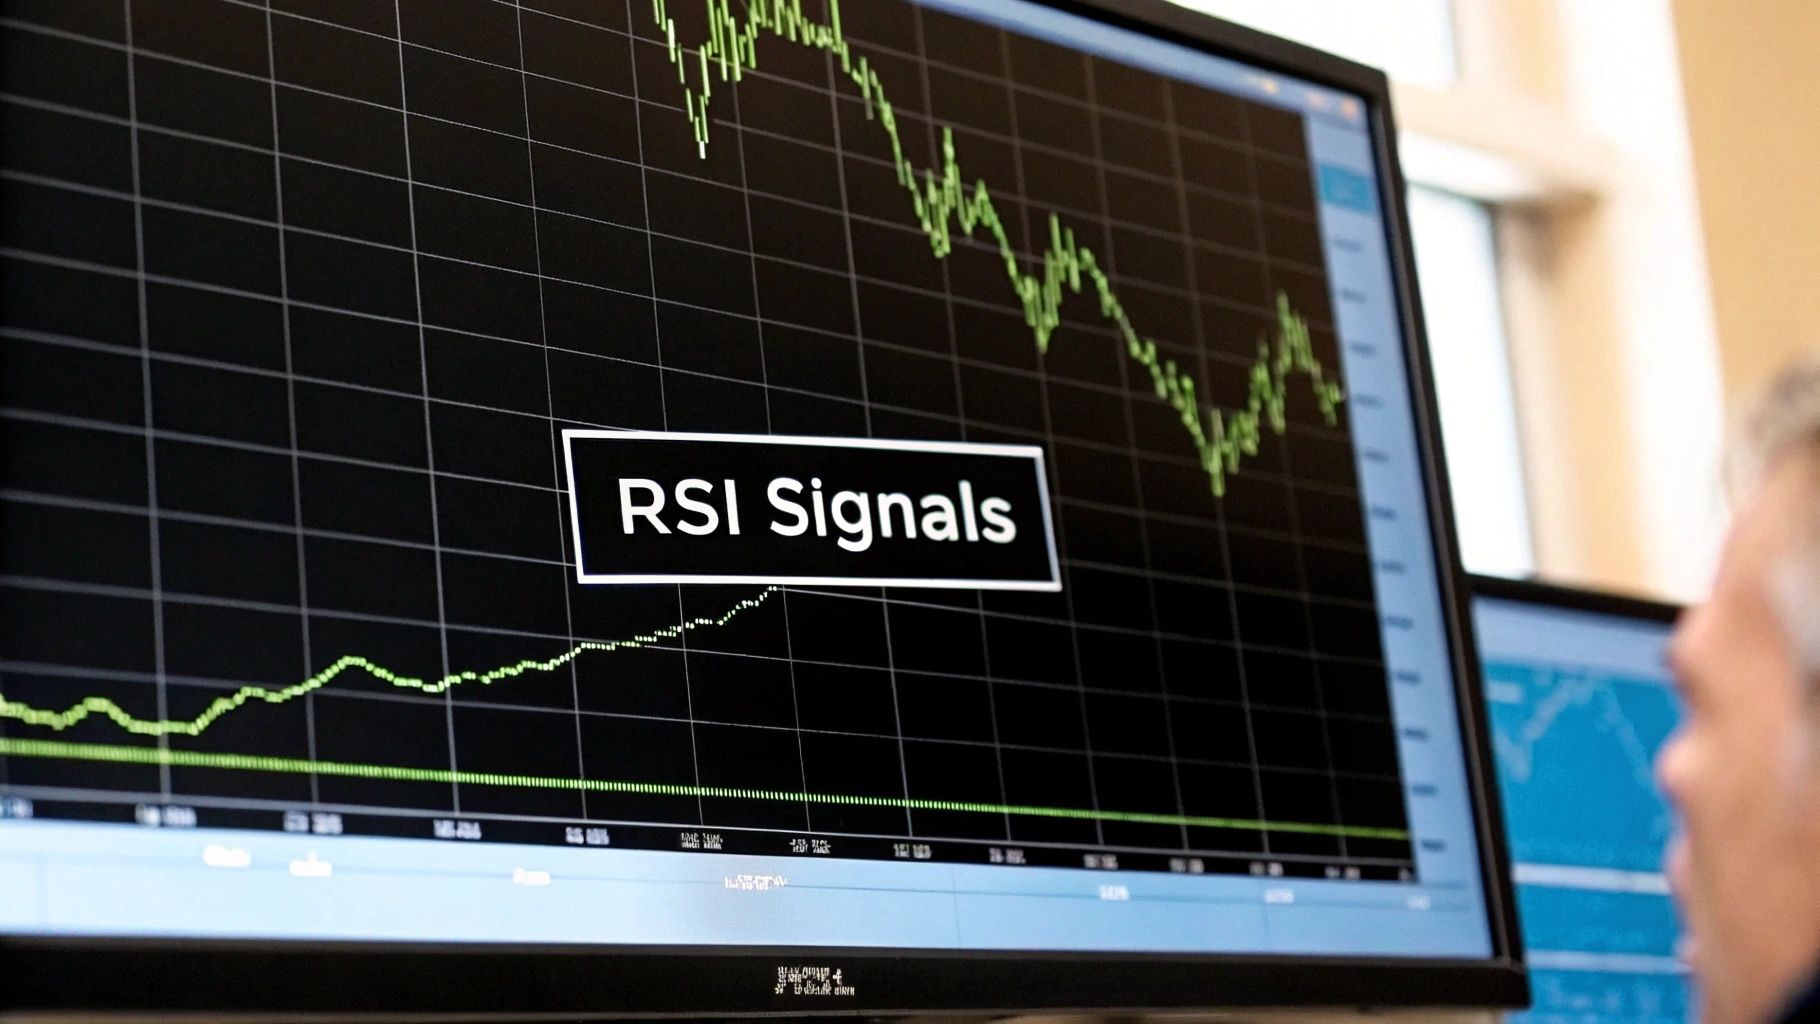
The RSI is one of the best swing trading indicators because it directly addresses a core challenge: timing entries and exits. When the RSI rises above 70, an asset is often considered overbought and may be due for a price correction. Conversely, a reading below 30 suggests it is oversold and could be poised for a rebound. This simple framework allows traders to anticipate potential reversals with a higher degree of confidence.
How to Use RSI for Swing Trading
For swing traders, the classic 70/30 levels are starting points, not absolute rules. A common mistake is selling immediately when RSI hits 70 in a strong uptrend, as momentum can carry prices higher. Instead, a more nuanced approach yields better results.
- Look for Confirmation: Wait for the RSI to not only enter the oversold area (below 30) but to cross back above 30 before entering a long position. This confirms that buying momentum is returning. Similarly, wait for it to cross back below 70 to confirm a potential short entry.
- Trade with the Trend: Use RSI signals to enter trades in the direction of the primary trend. For example, in a long-term uptrend, use oversold RSI readings (near 30) as opportunities to buy the dip.
- Identify Divergences: An RSI divergence is a powerful early warning signal. A bullish divergence occurs when the price makes a new low, but the RSI makes a higher low, signaling that downside momentum is weakening. A bearish divergence happens when the price hits a new high, but the RSI forms a lower high, indicating that the uptrend may be losing steam. For instance, Apple (AAPL) stock showed a notable bearish RSI divergence just before its 15% correction in March 2023.
Key Insight: Many professional traders, including Linda Raschke, advocate for using RSI not just as an overbought/oversold tool but as a broader momentum gauge. Its ability to show divergences makes it a leading indicator, often signaling a trend change before it's obvious on the price chart.
For those new to this concept, understanding the fundamentals is crucial. You can learn more about technical analysis tools like the RSI to build a solid foundation for your trading strategy.
2. Moving Average Convergence Divergence (MACD)
The Moving Average Convergence Divergence (MACD) is a versatile, trend-following momentum indicator that serves as a staple for swing traders. Created by Gerald Appel in the late 1970s, it illuminates the relationship between two exponential moving averages (EMAs) of an asset's price, typically the 12-period and 26-period EMAs. The resulting MACD line, plotted against a 9-period EMA signal line, provides clear signals for momentum shifts, trend direction, and potential reversals.
The MACD is one of the best swing trading indicators because it offers multiple layers of information through its three core components: the MACD line, the signal line, and the histogram. This multi-faceted approach helps traders identify entry and exit points with greater context than a single-line oscillator might provide. It excels at capturing the momentum that drives price swings over several days or weeks, making it ideal for the swing trading timeframe.
How to Use MACD for Swing Trading
Effective use of the MACD for swing trading involves looking beyond simple crossovers. By combining its signals, traders can build a more robust picture of market momentum and potential trend changes.
- Trade Signal Line Crossovers: The most common signal is the crossover. When the MACD line crosses above the signal line, it’s a bullish signal suggesting upward momentum is increasing. Conversely, a cross below the signal line is bearish. For a higher probability trade, look for bullish crossovers to occur when the MACD is below the zero line, and bearish crossovers when it is above the zero line.
- Use the Histogram for Momentum: The histogram, popularized by Thomas Aspray, visually represents the distance between the MACD and signal lines. An expanding histogram indicates strengthening momentum, while a shrinking histogram suggests momentum is fading, often preceding a crossover. For example, during Microsoft's strong uptrends, the histogram consistently expands, confirming the trend's power.
- Spot Divergences for Reversals: Like the RSI, the MACD provides powerful divergence signals. A bearish divergence occurs when the price makes a new high, but the MACD line fails to do so, signaling a potential top. For instance, gold showed a clear bearish MACD divergence before its significant $200 decline in 2022. A bullish divergence (price makes a new low, MACD makes a higher low) can signal a potential market bottom. A bullish crossover in Amazon's (AMZN) MACD in October 2023 was preceded by such a divergence, leading into a 12% rally.
Key Insight: As highlighted by Dr. Alexander Elder in his influential book "Trading for a Living," the MACD histogram is not just a secondary tool; it reveals the balance of power between bulls and bears. He taught traders to view the slope of the histogram as a leading indicator of a trend's health, often identifying a shift in market control before it's reflected in price action.
3. Bollinger Bands
Bollinger Bands are a dynamic and versatile volatility indicator, making them a favorite among swing traders who need to adapt to changing market conditions. Created by John Bollinger in the 1980s, this tool consists of three lines: a 20-period simple moving average (SMA) in the middle, and upper and lower bands that are typically set two standard deviations away from the SMA. These bands expand when volatility increases and contract when it decreases, providing a visual representation of market sentiment.
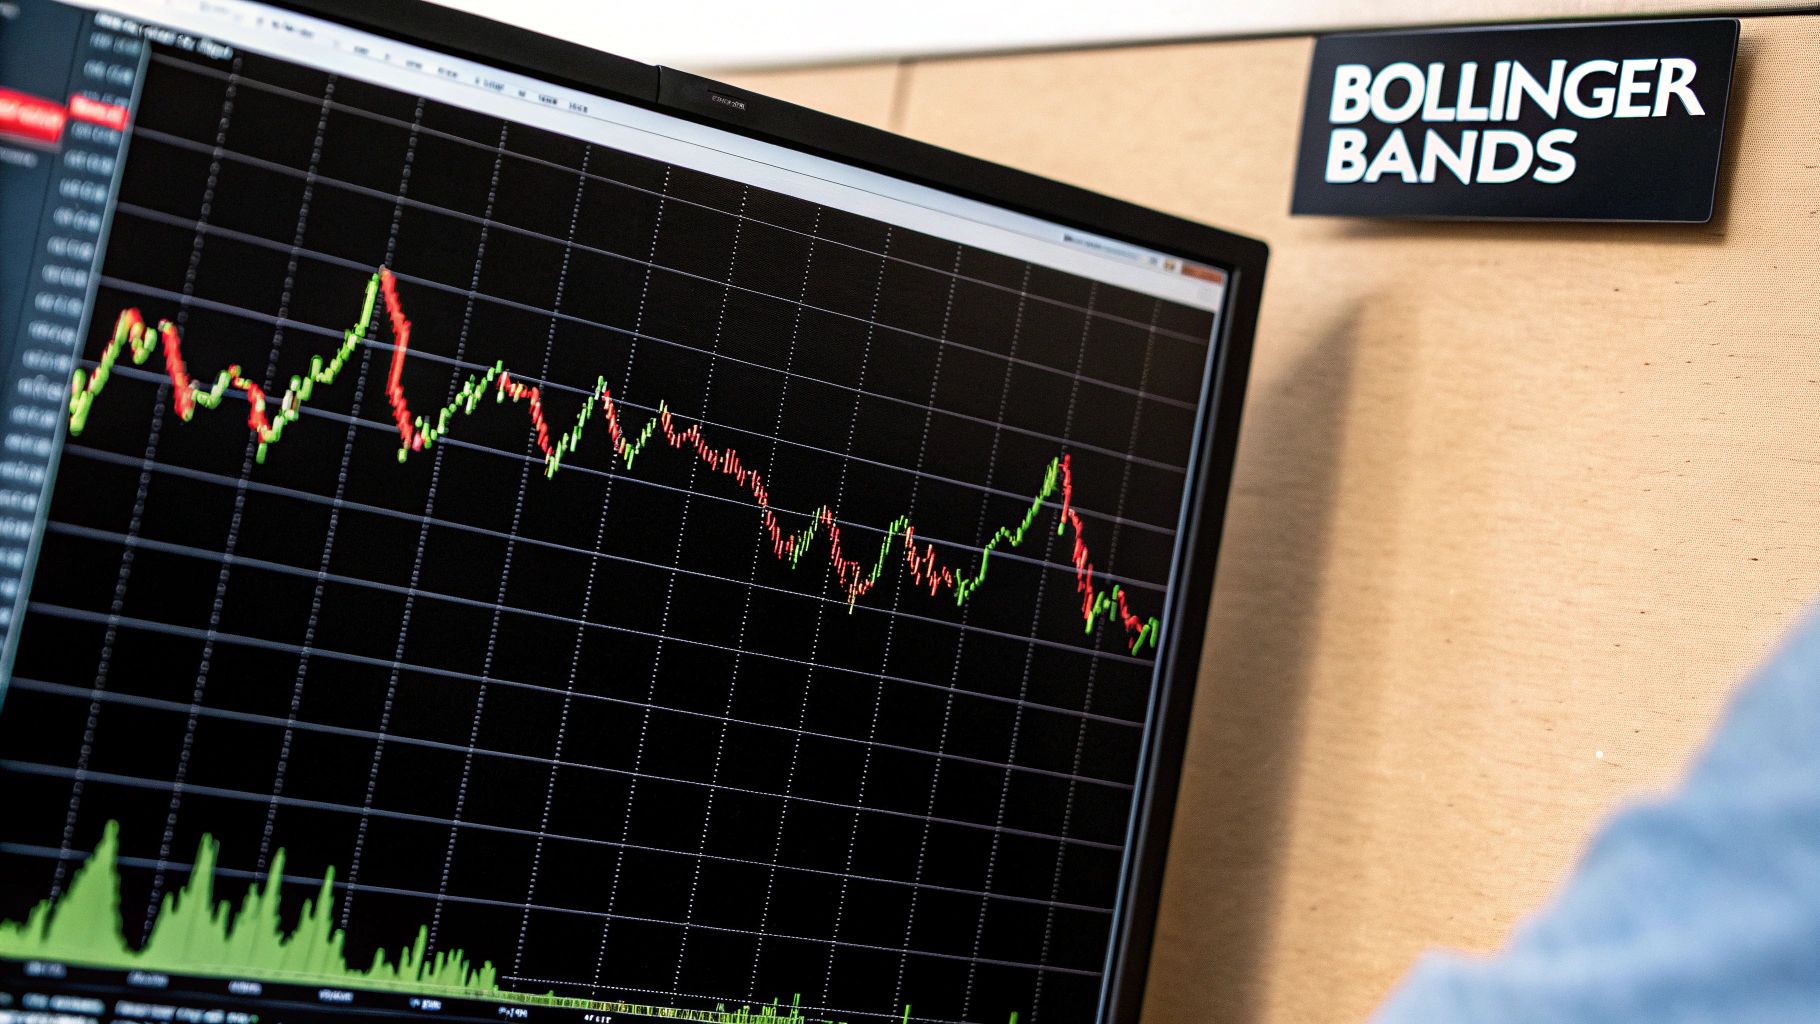
This indicator is one of the best swing trading indicators because it offers multiple trading signals within a single framework. It helps identify periods of high and low volatility, as well as potential overbought and oversold levels. The bands act as relative price boundaries, allowing traders to gauge whether prices are high or low on a relative basis, which is invaluable for timing entries and exits in a swing trade.
How to Use Bollinger Bands for Swing Trading
Effective use of Bollinger Bands goes beyond simply buying at the lower band and selling at the upper band. A sophisticated approach involves understanding market context and looking for specific patterns.
- Identify Reversal Points with Confirmation: A touch of the upper or lower band is a signal, not a command. Wait for price action to confirm a reversal. For example, after touching the lower band, look for a bullish candlestick pattern before entering a long position. In December 2022, Netflix (NFLX) stock bounced strongly off its lower Bollinger Band, leading to an 18% gain after showing initial signs of reversal.
- Trade the Squeeze: A "Bollinger Band Squeeze" occurs when volatility falls to a low level and the bands contract tightly. This often precedes a significant price move. Traders watch for a breakout above the upper band or below the lower band as a signal to enter a trade in the direction of the breakout. The SPY ETF experienced a notable squeeze in early January 2023 just before a major rally.
- Use the Middle Band as a Trend Guide: The 20-period SMA (the middle band) acts as a crucial support and resistance level. In an uptrend, price will often find support near the middle band, presenting a good "buy the dip" opportunity for swing traders.
Key Insight: John Bollinger himself emphasizes that the bands should be used to confirm price action, not to generate direct signals. He suggests combining them with other indicators, like volume or momentum oscillators, to validate potential trade setups. This multi-indicator approach filters out weaker signals and increases the probability of a successful trade.
4. Stochastic Oscillator
The Stochastic Oscillator is a classic momentum indicator that helps swing traders identify potential trend reversals by comparing a security's closing price to its price range over a specific period. Developed by George Lane in the 1950s, it operates on the principle that momentum often changes direction before price. The indicator consists of two lines, %K and %D, that oscillate between 0 and 100, signaling overbought and oversold conditions.
The Stochastic Oscillator is considered one of the best swing trading indicators because of its sensitivity to recent price action, making it highly effective for short-term market timing. When the indicator rises above 80, an asset is considered overbought and may be due for a pullback. Conversely, when it falls below 20, it is considered oversold and could be setting up for a bounce. This clear framework helps traders pinpoint entry and exit points for swing trades.
How to Use the Stochastic Oscillator for Swing Trading
Effective use of the Stochastic Oscillator goes beyond simply reacting to the 80/20 levels. A more strategic application involves confirming signals and aligning them with broader market trends.
- Wait for Crossover Confirmation: Instead of entering a trade as soon as the indicator enters an extreme zone, wait for the faster %K line to cross back above the slower %D line in the oversold zone (below 20). This crossover confirms that momentum is shifting upward. For a short position, wait for %K to cross below %D in the overbought zone (above 80). For example, a crossover in Apple (AAPL) stock while below 20 can often precede a multi-day rally.
- Focus on the Dominant Trend: In a strong uptrend, use oversold readings below 20 as buying opportunities. In a downtrend, use overbought readings above 80 to initiate short positions. This prevents you from fighting the primary market direction.
- Spot Divergences: Like the RSI, the Stochastic Oscillator is powerful for identifying divergences. A bullish divergence occurs when the price makes a new low, but the indicator forms a higher low, suggesting downside momentum is fading. A bearish divergence, where price hits a new high but the indicator makes a lower high, can warn of an impending top. Google (GOOGL) showed a classic bullish divergence in late 2023, with the Stochastic at a higher low before a 10% price bounce.
- Use Slower Settings: The default (14, 3, 3) setting is often preferred by swing traders. These "slower" parameters smooth out the indicator's movements, helping to filter out market noise and reduce the frequency of false signals.
Key Insight: Prominent trader Larry Williams, who developed his own versions of the indicator, emphasized using Stochastics to find "setups" rather than direct buy/sell signals. The indicator tells you when conditions are ripe for a reversal, but confirmation should come from price action itself, such as a breakout above a recent high or a bullish candlestick pattern.
5. Ichimoku Cloud (Ichimoku Kinko Hyo)
The Ichimoku Cloud, or Ichimoku Kinko Hyo ("one-look equilibrium chart"), is a comprehensive, all-in-one indicator that provides a multi-faceted view of the market. Developed by Japanese journalist Goichi Hosoda in the late 1930s, it consolidates information on trend direction, momentum, and dynamic support and resistance levels into a single, visual framework. This density of information makes it a powerhouse for swing traders aiming to make well-rounded decisions quickly.
The indicator is composed of five distinct lines: the Tenkan-sen (Conversion Line), Kijun-sen (Base Line), Senkou Span A (Leading Span A), Senkou Span B (Leading Span B), and the Chikou Span (Lagging Span). The area between Senkou Span A and B forms the "Kumo" or Cloud, a core element that provides a predictive glimpse into future support and resistance zones.
The Ichimoku Cloud is one of the best swing trading indicators because it offers a complete trading system. Rather than combining multiple disparate indicators, traders can use Ichimoku alone to gauge market sentiment, identify entry triggers, and confirm trend strength. Its forward-looking cloud component gives traders an edge by projecting potential price barriers before they are reached.
How to Use the Ichimoku Cloud for Swing Trading
At first glance, the Ichimoku Cloud can appear complex, but its signals are quite definitive once understood. Swing traders can leverage its components to build a robust, rules-based strategy.
- Determine the Trend: The primary signal comes from the price's location relative to the cloud. If the price is trading above the cloud, the overall trend is bullish. If it's below the cloud, the trend is bearish. Trading within the cloud often signifies consolidation or choppy price action.
- Use the Tenkan/Kijun Cross for Entries: Similar to a moving average crossover, the cross between the Tenkan-sen (faster line) and Kijun-sen (slower line) provides entry signals. A bullish cross (Tenkan crossing above Kijun) below the cloud is a weak signal, but one that occurs above the cloud is a strong confirmation to enter a long position.
- Assess Cloud Thickness: The thickness of the Kumo (Cloud) indicates the strength of the support or resistance it represents. A thick cloud suggests a strong barrier that will be difficult for the price to penetrate, while a thin cloud offers weaker support or resistance.
- Confirm with the Chikou Span: The Chikou Span (Lagging Span) is the current closing price plotted 26 periods in the past. If the Chikou Span is above the price from 26 periods ago, it confirms bullish momentum. This acts as a final filter before committing to a trade. For example, Tesla (TSLA) showed a classic bullish breakout in early 2023 when its price, Tenkan/Kijun cross, and Chikou Span all moved decisively above the cloud.
The following infographic highlights the three core concepts traders should master first when using the Ichimoku Cloud.
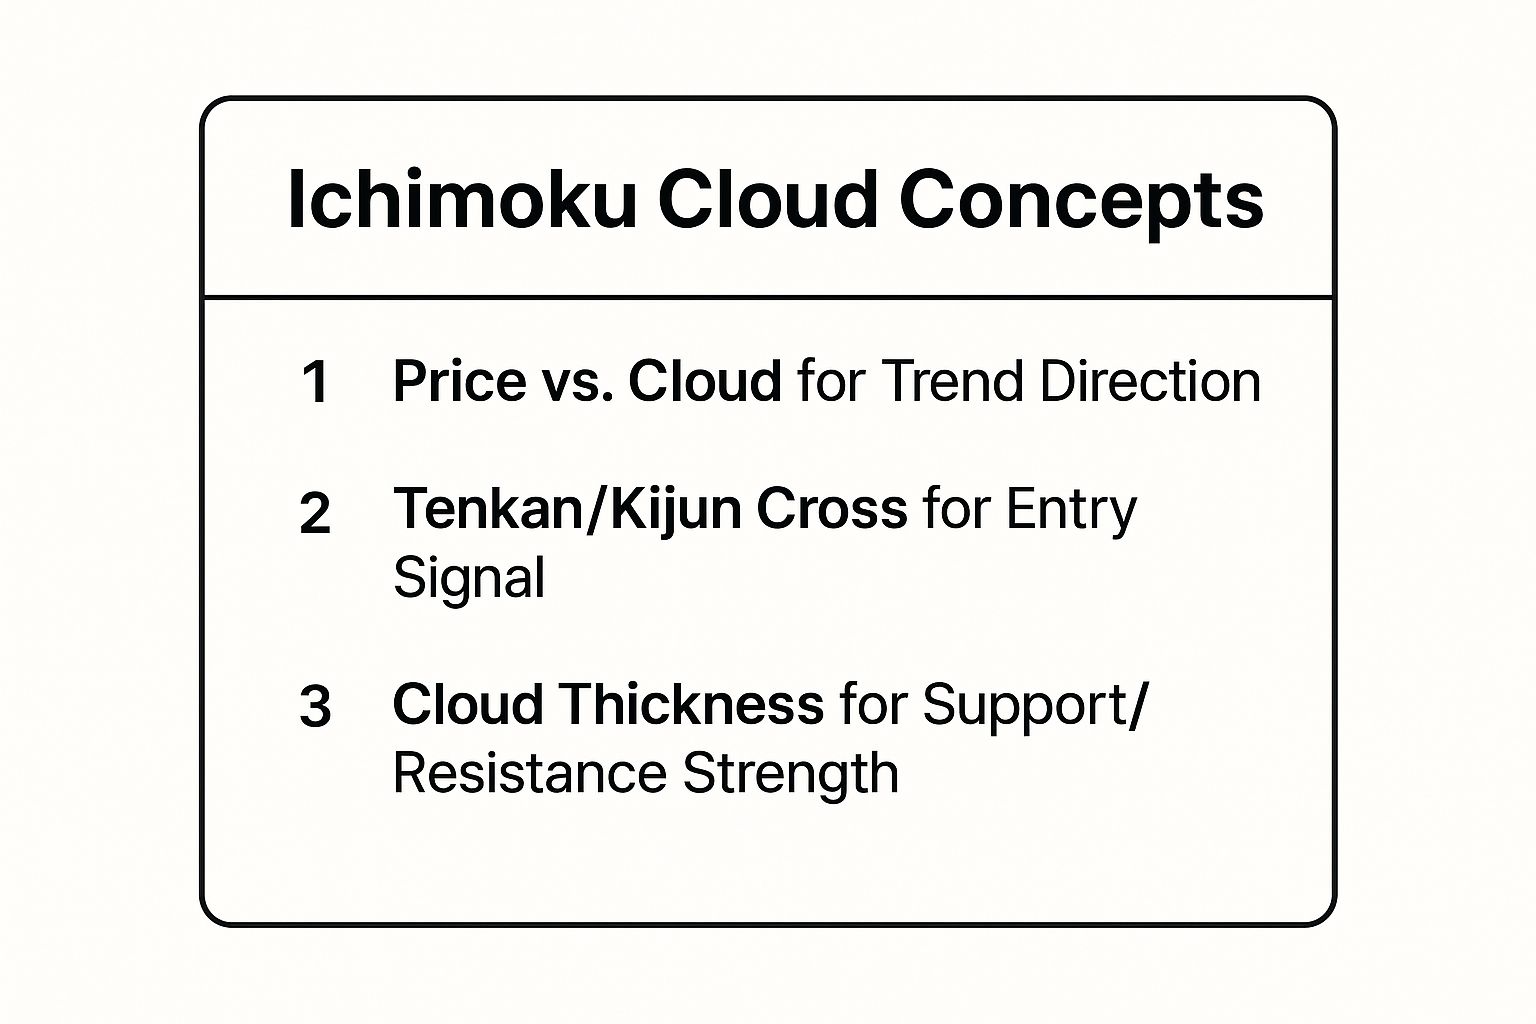
Mastering these three elements provides a solid foundation for interpreting the cloud's signals for trend, entry, and risk management.
For a deeper dive into how these components work together in real-time, the video below provides a practical demonstration.
Key Insight: Traders like Nicole Elliott, who helped popularize Ichimoku in the West, emphasize its role as a "one-glance" system. The goal isn't to analyze each line in isolation but to see the whole picture. When the price is above a green cloud, and the Tenkan-sen is above the Kijun-sen, and the Chikou Span is in open space, all signals are aligned for a high-probability bullish swing trade.
6. Williams %R
The Williams %R is a powerful and fast-acting momentum oscillator developed by famed trader Larry Williams. It functions similarly to the Stochastic Oscillator but operates on an inverted scale from 0 to -100. This design allows it to measure overbought and oversold levels with exceptional speed, making it highly sensitive to recent price movements and ideal for pinpointing short-term swing trading opportunities.
The Williams %R is one of the best swing trading indicators because it excels at identifying exhaustion points in a trend. When the indicator moves above -20, it signals that an asset is potentially overbought and its price may be stretched too far to the upside. Conversely, a reading below -80 suggests the asset is oversold and could be nearing a bottom, presenting a potential buying opportunity for swing traders looking to capitalize on a price rebound.
How to Use Williams %R for Swing Trading
Due to its sensitivity, Williams %R can produce frequent signals. A strategic approach is necessary to filter out noise and identify high-probability trades. A common mistake is acting on every single overbought or oversold signal without considering the broader market context.
- Adjust the Lookback Period: While the default setting is often 14 periods, swing traders can benefit from using longer periods like 21 or 34. This smooths out the indicator's line, reducing false signals and highlighting more significant momentum shifts.
- Focus on 'Failure Swings': This is a key technique where the indicator fails to reach a previous extreme. For example, in an uptrend, if the price makes a new high but the Williams %R fails to move above its prior high (e.g., only reaches -30 instead of -15), it signals that buying momentum is fading and a reversal may be imminent.
- Combine with Volume: An oversold reading below -80 gains significant credibility when it's accompanied by a spike in trading volume. This combination suggests capitulation selling has occurred and strong buying interest is stepping in, confirming a potential bottom. For example, Meta (META) stock showed a deep Williams %R oversold reading in late 2022, which, combined with high volume, preceded a major recovery.
- Use Multiple Timeframes: Confirm signals on your trading chart (e.g., daily) by checking the Williams %R on a higher timeframe (e.g., weekly). If both timeframes show oversold conditions, the probability of a successful long trade increases substantially.
Key Insight: Larry Williams designed the %R to be a leading indicator, often reaching extremes and turning up or down several days before the price does. Linda Raschke, another trading legend, has extensively used it to anticipate trend exhaustion, emphasizing its value in timing entries just as momentum begins to shift.
Understanding how to layer indicators like Williams %R with other market data is crucial. You can learn more about using market sentiment for trading to enhance your analysis and build a more robust strategy.
7. Average True Range (ATR)
The Average True Range (ATR) is a pure volatility indicator, a critical tool for risk management in swing trading. Created by J. Welles Wilder Jr., the same mind behind the RSI, the ATR measures market volatility by calculating the average of true ranges over a specified period, typically 14 days. Unlike momentum oscillators, it does not provide directional signals but instead quantifies the degree of price movement, helping traders adapt their strategies to current market conditions.
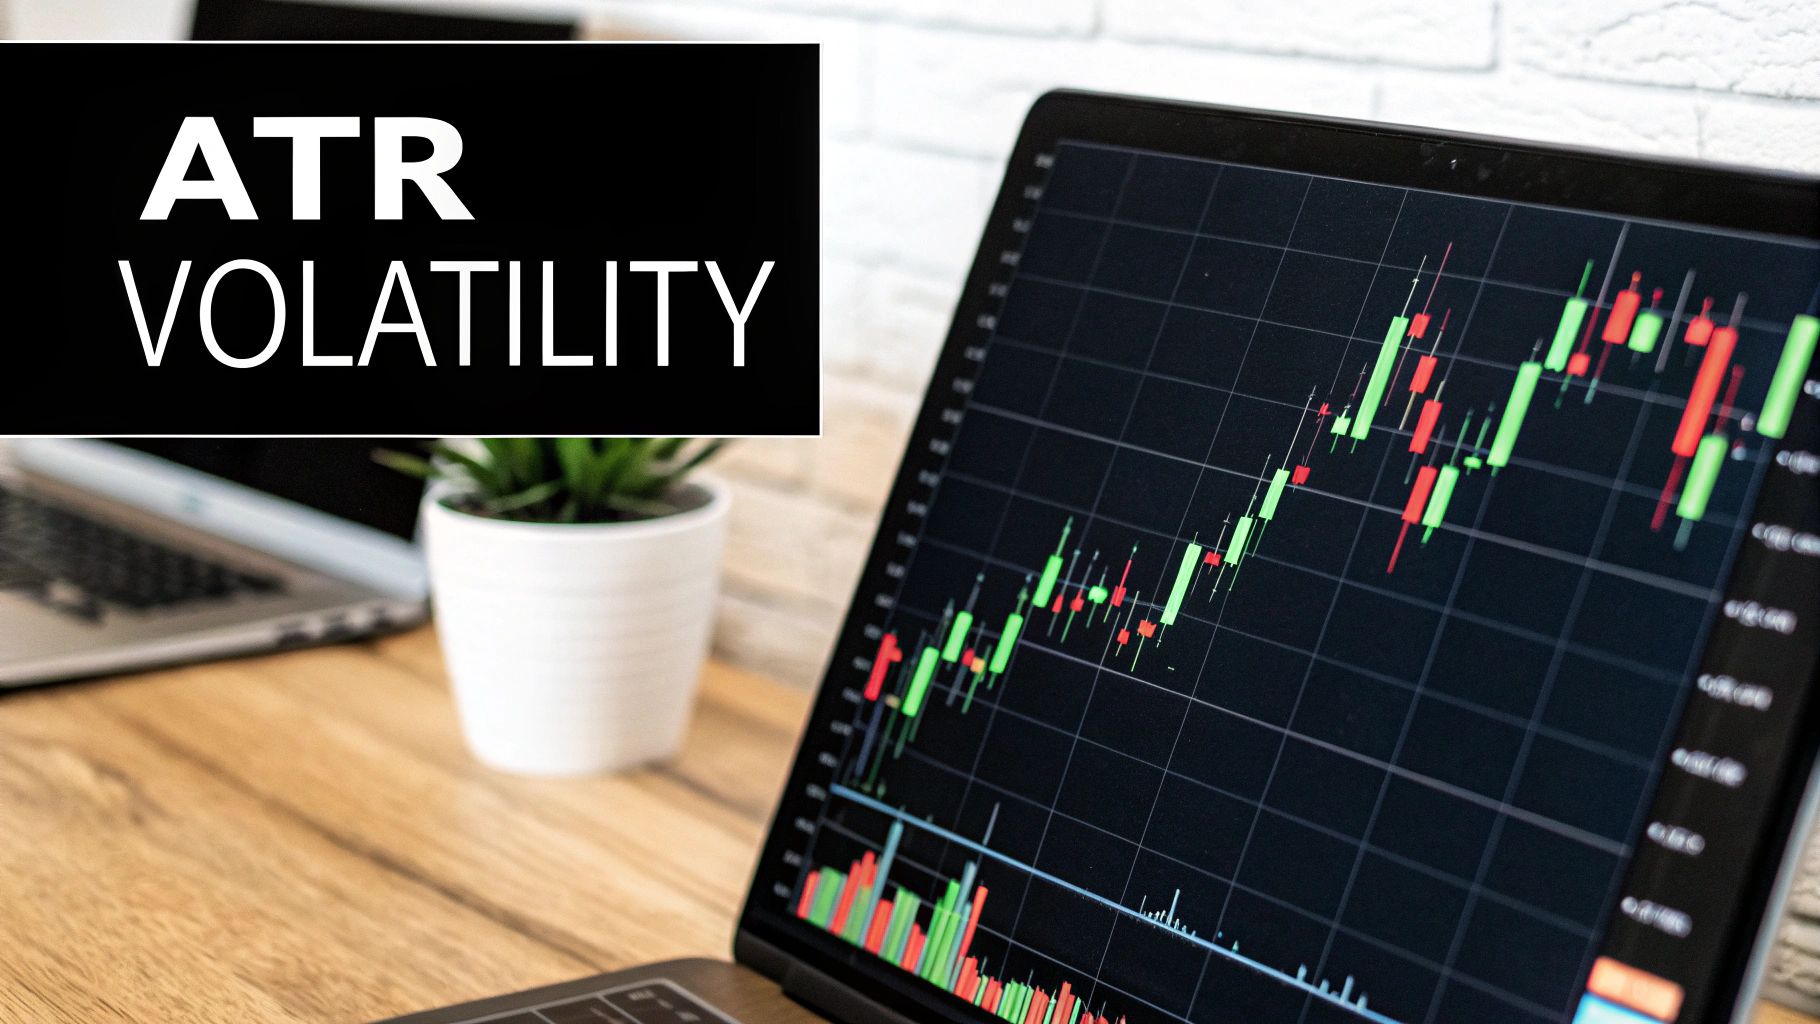
The ATR is one of the best swing trading indicators because it directly answers the vital question: "How much can this asset move in a typical day?" This information is indispensable for setting realistic stop losses and profit targets. A stock with a high ATR is more volatile and requires a wider stop loss to avoid being prematurely shaken out of a trade, while a low ATR asset allows for tighter stops. This adaptability makes it a cornerstone of dynamic risk management.
How to Use ATR for Swing Trading
The primary application of ATR for swing traders is in managing risk and setting trade parameters. It provides an objective measure of volatility, removing guesswork from stop-loss placement and position sizing.
- Set Dynamic Stop Losses: A popular method is to place a stop loss at a multiple of the ATR value below your entry for a long position (or above for a short). For example, setting a stop at 2x the ATR value gives the trade enough room to breathe and withstand normal volatility without getting stopped out.
- Identify Breakout Potential: Periods of low volatility, indicated by a contracting or flat ATR, often precede explosive price moves. When the ATR begins to expand rapidly from a low base, it can signal the start of a new, strong trend, confirming a potential breakout.
- Adjust Position Size: In highly volatile conditions (high ATR), it is prudent to reduce your position size to maintain a consistent dollar-risk per trade. Conversely, in low volatility environments (low ATR), you can take on a larger position for the same level of risk.
- Set Profit Targets: The ATR can also be used to project potential profit targets. For instance, a common target could be set at 2x or 3x the ATR value above your entry price, providing an objective goal based on the asset's typical price range.
Key Insight: Renowned trading coaches like Van Tharp and Alexander Elder have championed the use of ATR for sophisticated risk and position sizing models. They teach that adapting your trade size and stop distance based on an asset's current volatility (its ATR) is a hallmark of professional trading, moving beyond static-percentage risk rules.
Properly managing risk is fundamental to long-term success. You can discover more about advanced risk management techniques to further refine your trading plan.
8. Volume Weighted Average Price (VWAP)
The Volume Weighted Average Price (VWAP) is a dynamic benchmark favored by institutional traders that has become invaluable for swing traders. It calculates the true average price of a stock by factoring in the volume of shares traded at each specific price point throughout the day. Unlike a simple moving average, VWAP gives more weight to price levels with higher trading volume, providing a more accurate representation of the asset's "fair value" for that session. This indicator resets at the start of each trading day, making it a pure intraday tool.
The VWAP is one of the best swing trading indicators because it helps traders gauge institutional sentiment and identify key intra-day support and resistance levels. When the price is trading above VWAP, it suggests that buyers are in control and the market sentiment is bullish for the session. Conversely, a price below VWAP indicates that sellers are dominant, and the outlook is bearish. This clarity helps swing traders make more informed decisions about entry and exit points within a single day or over a few days.
How to Use VWAP for Swing Trading
While VWAP is traditionally an intraday indicator, swing traders can leverage it to pinpoint optimal entry and exit timing for trades held over several days. The key is to understand its role as a liquidity benchmark.
- Trade with the Trend: A core strategy is to look for long entry opportunities when a stock's price pulls back to and holds the VWAP line in a strong uptrend. This often represents a point where institutions are defending a position. For short trades, a rejection from the VWAP in a downtrend provides a high-probability entry.
- Identify Strength or Weakness: A strong, decisive break above the VWAP on high volume, like a move seen in Tesla (TSLA) on a breakout day, signals institutional buying and the potential for continued upside. The opposite is true for a break below.
- Use as a Target for Reversion Trades: If a stock moves significantly far away from its VWAP, it may be overextended. Swing traders can use the VWAP line as a logical profit target for mean-reversion trades, anticipating that the price will eventually gravitate back toward this average.
- Combine with Multi-Day VWAP: For a longer-term swing perspective, traders can plot a "rolling" or "anchored" VWAP starting from a significant date, like an earnings release or a major news event. This helps identify key support or resistance levels over a multi-day or multi-week period.
Key Insight: Prominent traders like Brian Shannon and Scott Redler have popularized using VWAP not just as a reactive indicator but as a proactive tool. They emphasize that the market is a two-way auction, and VWAP represents the fairest price agreed upon by both buyers and sellers for the session. Trading on the "right" side of it aligns you with the dominant institutional flow.
Top 8 Swing Trading Indicators Comparison
| Indicator | Implementation Complexity 🔄 | Resource Requirements ⚡ | Expected Outcomes 📊 | Ideal Use Cases 💡 | Key Advantages ⭐ |
|---|---|---|---|---|---|
| Relative Strength Index (RSI) | Moderate - simple oscillator setup | Low - uses price data | Identifies overbought/oversold; signals reversals | Swing trading, ranging markets | Clear signals, divergence detection |
| MACD | Moderate - calculates multiple lines | Moderate - requires moving averages | Trend and momentum signals; crossover timing | Medium-term swings, trending markets | Combines trend & momentum, multiple signals |
| Bollinger Bands | Moderate - moving averages and std deviation | Moderate - price and volatility data | Volatility-based support/resistance; breakout signals | Volatility cycles, mean reversion | Adapts to volatility, dynamic bands |
| Stochastic Oscillator | Moderate - dual line oscillator | Low - price range data | Overbought/oversold with crossover signals | Ranging markets, entry/exit timing | Sensitive, multiple signal methods |
| Ichimoku Cloud | High - five lines and cloud plotting | Moderate to High - multiple calculations | Trend direction, support/resistance, momentum in one | Trend identification, complex setups | Comprehensive, future support/resistance |
| Williams %R | Low to Moderate - similar to Stochastic but inverted | Low - price data | Short-term reversal timing; overbought/oversold | Short-term swings, momentum shifts | Highly sensitive, simple interpretation |
| Average True Range (ATR) | Low - volatility calculation | Low - price data | Measures volatility for risk management and sizing | Stop loss setting, volatility analysis | Excellent risk management tool |
| Volume Weighted Average Price (VWAP) | Moderate - intraday volume-price weighted | Moderate - requires volume data | Fair value benchmark, dynamic support/resistance | Intraday trading, institutional setups | Incorporates volume, institutional benchmark |
Final Thoughts
Navigating the world of swing trading without the right tools is like trying to sail across an ocean without a compass. The indicators we have explored - from the momentum-gauging power of the RSI and MACD to the volatility-mapping precision of Bollinger Bands and ATR - are the essential instruments in your navigational toolkit. Each one offers a unique lens through which to view market dynamics, helping you identify potential entry and exit points with greater clarity and confidence.
We've moved beyond simple definitions, diving deep into the practical application of these tools. You now understand not just what the Stochastic Oscillator is, but how to use its crossovers in trending markets versus its overbought/oversold signals in ranging markets. You've seen how the Ichimoku Cloud provides a comprehensive, all-in-one snapshot of momentum, support, and resistance, and how VWAP acts as an institutional benchmark, revealing where the "smart money" is positioned. The goal was never to present a magic formula, but to equip you with a versatile framework for analysis.
Synthesizing Indicators for a Robust Strategy
The true power of these indicators is unlocked not in isolation, but in confluence. A single indicator might give you a signal, but a combination of signals across different categories provides a much stronger, more reliable thesis for a trade. This is the cornerstone of developing a robust trading strategy.
A potential workflow could look like this:
- Trend Identification: Start with a longer-term moving average (like the 50-period or 200-period) or the Ichimoku Cloud to establish the primary market direction. You only want to trade with the prevailing trend.
- Entry Signal: Look for a pullback to a key level. This could be a moving average, a Bollinger Band, or a VWAP level. Then, use an oscillator like the RSI or Stochastic to signal that the pullback is losing steam (e.g., RSI moving out of oversold territory in an uptrend).
- Confirmation: Use a final confirmation tool. A bullish MACD crossover above the signal line or a candlestick pattern confirming a reversal can serve as your final trigger to enter the trade.
- Risk Management: Use the ATR to set a logical stop-loss that respects the asset's current volatility, placing it far enough away to avoid being stopped out by normal market noise but close enough to protect your capital.
This multi-layered approach filters out low-probability setups and forces you to build a compelling case for each trade you take. It transforms you from a trader who reacts to single alerts into a strategist who executes a well-rounded plan.
From Knowledge to Mastery
The journey to becoming a proficient swing trader is a marathon, not a sprint. The indicators discussed are powerful, but they are not infallible. They lag, they produce false signals, and their effectiveness can vary across different market conditions and asset classes. The key takeaway is to embrace a mindset of continuous learning and adaptation.
Your next steps should involve hands-on practice. Open a demo account or start with very small position sizes. Apply the indicator combinations we've discussed to historical charts and then to live markets. Keep a detailed trading journal, noting which indicators and setups work best for your chosen assets and your personal trading style. This empirical feedback loop is where theoretical knowledge transforms into practical skill.
Ultimately, the best swing trading indicators are the ones you have mastered, back-tested, and can interpret with nuance and discipline. By combining their quantitative signals with an understanding of broader market sentiment and a disciplined approach to risk management, you position yourself to not just survive in the markets, but to thrive.
Ready to elevate your analysis by integrating real-time market sentiment with your technical indicators? The Fear Greed Tracker platform provides comprehensive data on market emotion, helping you confirm your indicator signals and avoid trading against powerful crowd psychology. Supercharge your strategy by visiting Fear Greed Tracker to see how sentiment analysis can provide the ultimate edge.