
In the fast-paced world of day trading, success hinges on quick, data-driven decisions. While raw price action tells part of the story, technical indicators act as your analytical toolkit, translating chaotic market movements into actionable insights. These tools help identify trend direction, measure momentum, gauge volatility, and pinpoint potential entry and exit points with greater precision. Mastering a select few can transform your approach from guesswork to a calculated strategy, giving you the edge needed to navigate intraday volatility.
This guide moves beyond generic definitions to provide a practical breakdown of the most essential day trading indicators. You will learn not just what each tool is, but exactly how to apply it within a cohesive trading plan. We'll explore specific setups, advanced interpretation techniques, and how to combine indicators for a more robust analysis.
By the end of this article, you will have a clear understanding of the following key indicators and how they function in real-world trading scenarios:
- Moving Average Convergence Divergence (MACD)
- Relative Strength Index (RSI)
- Bollinger Bands
- Stochastic Oscillator
- Volume Weighted Average Price (VWAP)
- Average True Range (ATR)
- Williams %R
- Commodity Channel Index (CCI)
- Parabolic SAR (Stop and Reverse)
1. Moving Average Convergence Divergence (MACD)
The Moving Average Convergence Divergence (MACD) is a versatile momentum indicator that helps day traders identify trend direction and potential reversals. Developed by Gerald Appel, it visualizes the relationship between two exponential moving averages (EMAs). By subtracting the 26-period EMA from the 12-period EMA, the MACD line reveals changes in an asset's price strength, direction, and momentum.
This indicator is more than just a trend-following tool; it excels at highlighting potential shifts in market sentiment before they become obvious on the price chart. Its core strength lies in its ability to generate clear buy and sell signals through crossovers and divergences, making it one of the most trusted day trading indicators available.
How MACD Works in Practice
The MACD consists of three primary components that work together to provide actionable trading signals. The interaction between these elements is what gives the indicator its predictive power.
The infographic below summarizes the three key components of the MACD indicator for quick reference.
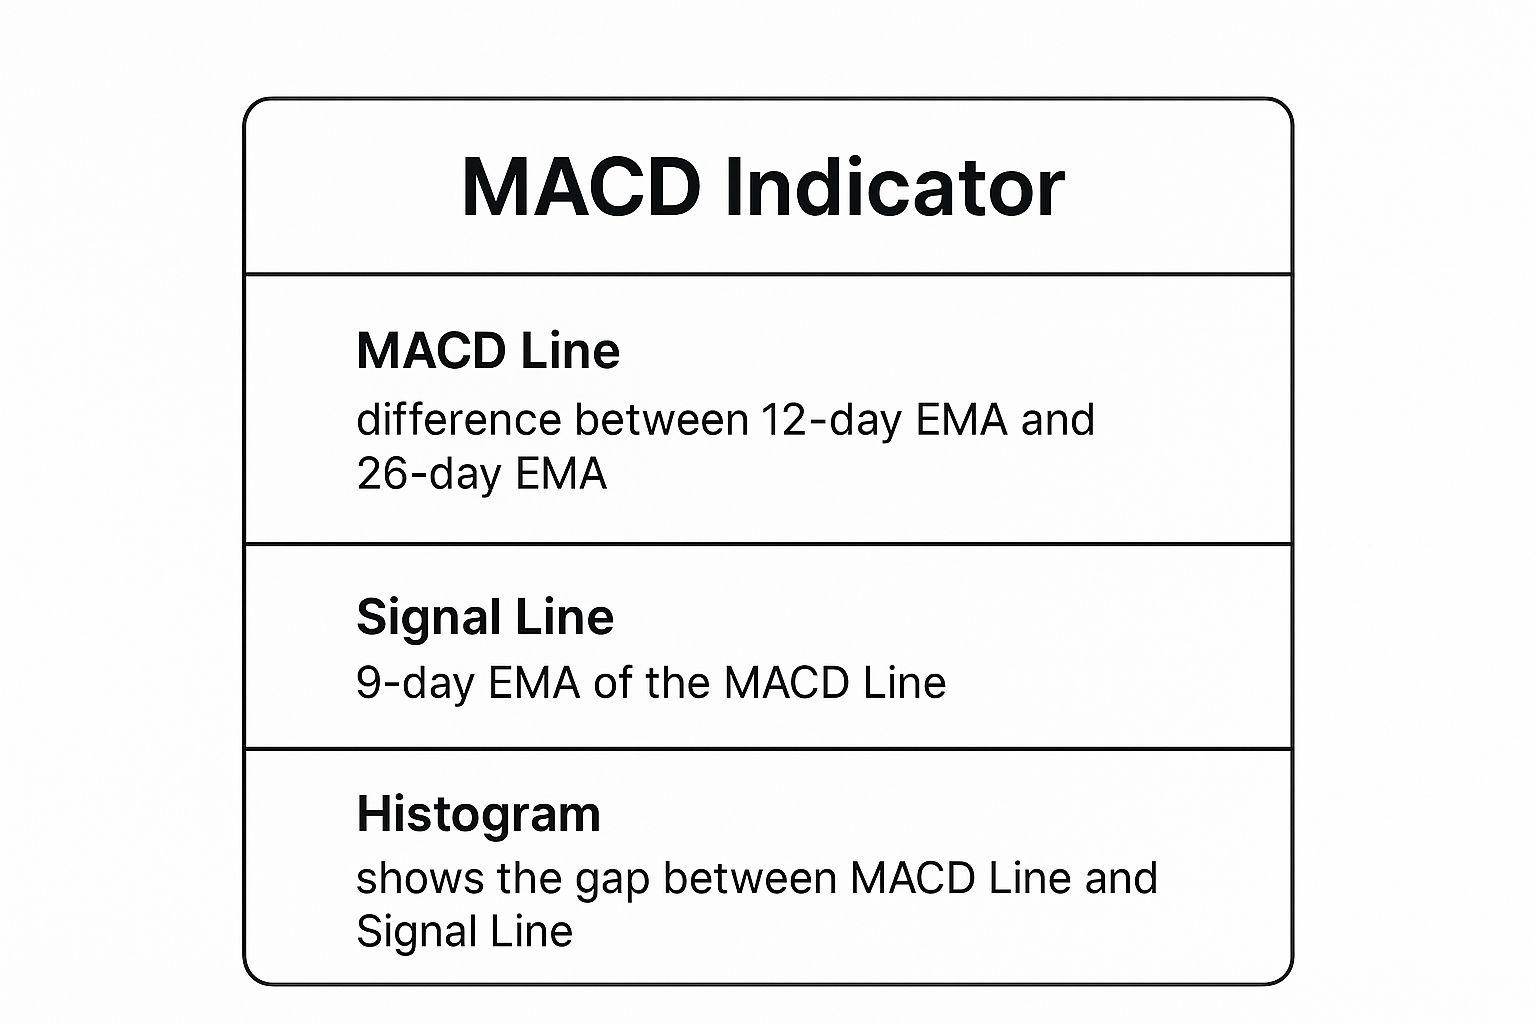
Understanding these three parts is crucial, as the histogram visually represents the momentum, which is the driving force behind the MACD and signal line crossovers.
A classic bullish signal occurs when the MACD line crosses above the signal line, suggesting upward momentum is building. Conversely, a bearish signal is generated when the MACD line crosses below the signal line.
Pro Tip: Look for divergences. If the price is making a new high but the MACD is not, it signals weakening momentum and a potential price reversal. This bearish divergence can be a powerful early warning signal for day traders to exit a long position or consider a short entry. Combining MACD signals with price action and other indicators like the RSI can significantly improve accuracy.
2. Relative Strength Index (RSI)
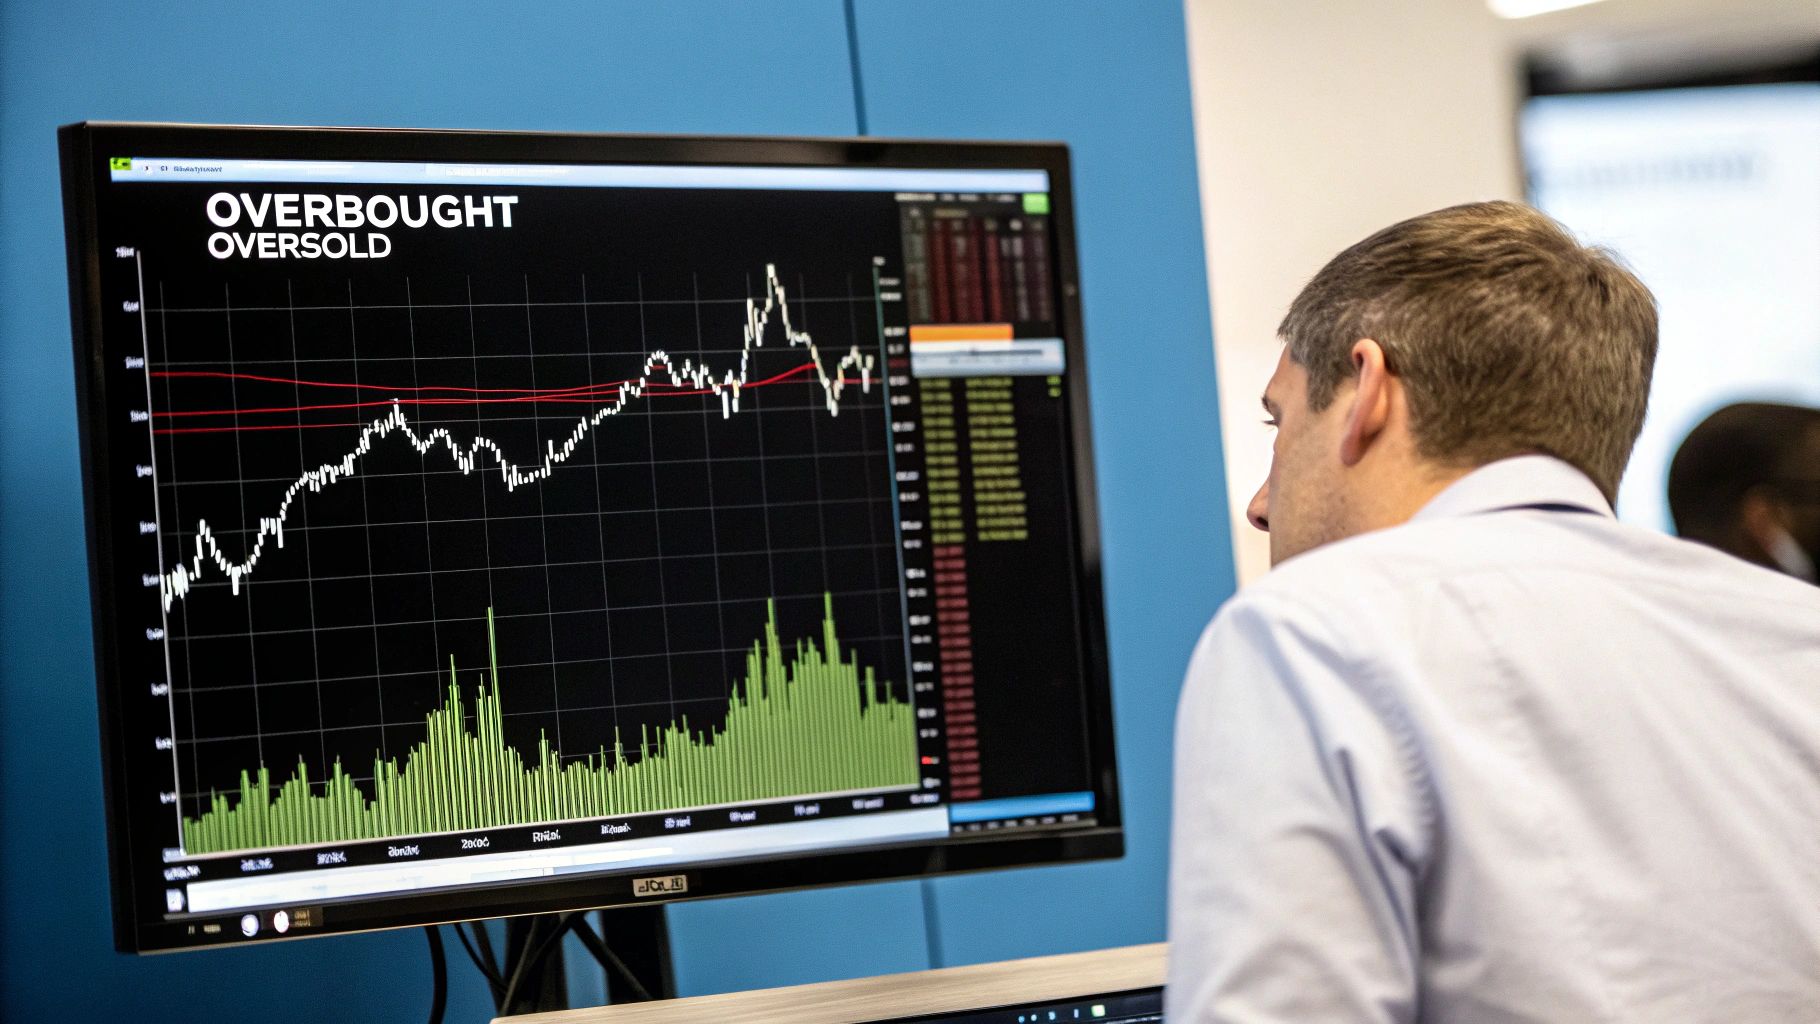
The Relative Strength Index (RSI) is a momentum oscillator that measures the speed and magnitude of recent price changes to evaluate overbought or oversold conditions in the price of an asset. Developed by J. Welles Wilder Jr., this indicator oscillates between 0 and 100, providing traders with a quick gauge of an asset's internal strength.
RSI is highly valued for its simplicity and effectiveness in identifying potential market tops and bottoms, especially in ranging markets. As one of the most fundamental day trading indicators, it helps traders determine when an asset's price has moved too far, too fast, signaling a potential pullback or reversal. Its ability to pinpoint these extremes makes it an essential tool for timing entries and exits.
How RSI Works in Practice
The RSI provides clear visual cues based on its position relative to key levels. The most common interpretation involves the 70 and 30 levels, which act as thresholds for overbought and oversold conditions, respectively.
Understanding how to react to these levels is critical for effective trading. A reading above 70 suggests the asset may be overbought and due for a price correction, while a reading below 30 indicates it may be oversold and poised for a rebound.
A classic bearish signal occurs when the RSI moves above 70, suggesting a good time to consider selling or shorting. Conversely, a bullish signal is generated when the RSI drops below 30, presenting a potential buying opportunity. In a strong uptrend, the 50 level often acts as a dynamic support area.
Pro Tip: Look for divergences between price and the RSI. If the price makes a new low but the RSI makes a higher low (bullish divergence), it signals that downside momentum is fading and a price rally could be imminent. For more aggressive day trading, consider using a shorter period like 9 instead of the standard 14 to generate more frequent signals.
3. Bollinger Bands
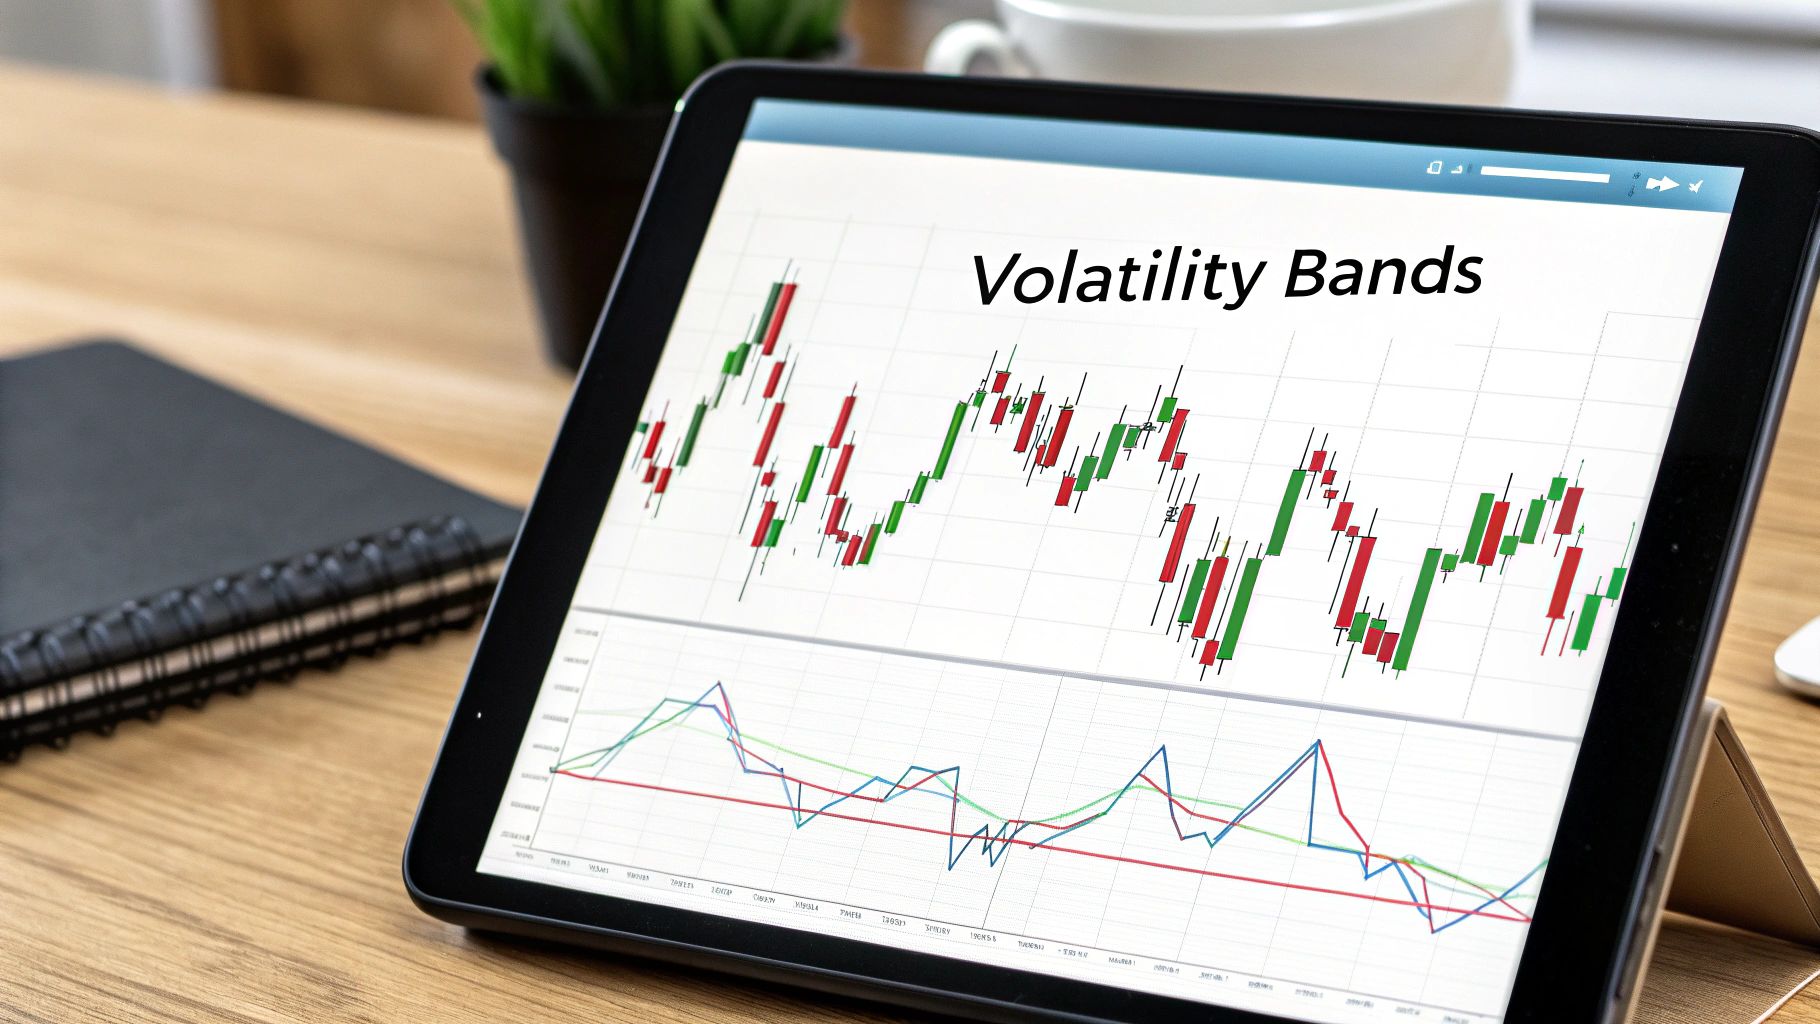
Bollinger Bands are a popular volatility-based indicator created by John Bollinger in the 1980s. They consist of a simple moving average (SMA) as a middle band, with an upper and lower band set at a standard deviation away from the middle band. These bands dynamically expand when volatility increases and contract when volatility decreases, providing a powerful framework for assessing price action.
This indicator is exceptional at helping traders gauge whether an asset's price is relatively high or low. Its primary strength is in its adaptability; the bands adjust automatically to market conditions, making them one of the most reliable day trading indicators for identifying overbought or oversold levels and anticipating significant price moves.
How Bollinger Bands Work in Practice
The interaction between the price and the three bands generates clear trading signals. The outer bands act as dynamic support and resistance levels, while the middle band often serves as a baseline for the trend.
The infographic below summarizes the three key components of the Bollinger Bands indicator for quick reference.
- Upper Band: SMA + (Standard Deviation x 2)
- Middle Band: 20-period Simple Moving Average (SMA)
- Lower Band: SMA - (Standard Deviation x 2)
A common bullish signal occurs when the price touches the lower band and reverses, suggesting the asset is oversold. A bearish signal is often identified when the price hits the upper band and pulls back, indicating an overbought condition. A "squeeze," where the bands narrow significantly, often precedes a major volatility breakout.
Pro Tip: Look for "walking the bands." In a strong uptrend, prices will often hug the upper band. This is not a sell signal but a sign of persistent strength. A close back inside the bands can be an early sign the trend is losing momentum. Combining Bollinger Bands with a momentum indicator like the RSI can help confirm whether a touch of the band is a reversal signal or a continuation signal.
4. Stochastic Oscillator
The Stochastic Oscillator is a momentum-based indicator that compares a particular closing price of a security to a range of its prices over a certain period. Developed by George Lane in the 1950s, it operates on the premise that an asset’s closing price tends to stay near the high of its recent trading range in an uptrend and near the low in a downtrend.
This indicator excels at identifying overbought and oversold conditions, making it an essential tool for traders looking to time entries and exits. Its strength lies in its sensitivity to price momentum, providing early signals for potential trend reversals. This responsiveness makes it one of the most popular day trading indicators for fast-paced markets like forex and futures.
How the Stochastic Oscillator Works in Practice
The Stochastic Oscillator is comprised of two lines, the %K line (the main line) and the %D line (a moving average of %K), which oscillate between 0 and 100. The interaction between these lines, particularly in extreme zones, generates actionable signals.
Readings above 80 are generally considered the overbought region, suggesting a potential pullback or reversal is imminent. Conversely, readings below 20 are considered the oversold region, indicating that the selling pressure may be exhausted and a bounce could occur.
A primary bullish signal appears when the %K line crosses above the %D line within the oversold territory (below 20). A bearish signal is generated when the %K line crosses below the %D line in the overbought zone (above 80), suggesting downward momentum is taking hold.
Pro Tip: Focus on divergence for higher-probability trades. If the price chart shows a lower low but the Stochastic Oscillator forms a higher low, this bullish divergence indicates waning selling momentum and a potential upward reversal. Combining this signal with trend analysis helps filter out false signals and avoid trading against the primary market direction.
5. Volume Weighted Average Price (VWAP)
The Volume Weighted Average Price (VWAP) is a benchmark indicator that provides the average price a security has traded at throughout the day, weighted by volume. Unlike a simple moving average, VWAP places more emphasis on price points with higher trading volume, making it a powerful tool for understanding an asset's "true" average price. It is reset at the start of each trading day.
This indicator is a favorite among institutional traders and algorithms because it helps them gauge their execution quality against the market's average. For individual traders, VWAP acts as a critical reference point for intraday trend, support, and resistance, making it one of the most practical day trading indicators for assessing market sentiment.
How VWAP Works in Practice
VWAP is displayed as a single line on an intraday chart, offering clear visual cues for trade direction and entries. The relationship between the current price and the VWAP line is the core of its utility, signaling whether buyers or sellers are in control at any given moment.
Understanding its application can significantly enhance your trading strategy, especially if you are new to technical analysis. For a deeper dive into foundational concepts, check out this guide on day trading basics.
A classic bullish signal occurs when the price breaks above and holds the VWAP line, suggesting that buyers are aggressive and in control. Conversely, a bearish signal is generated when the price falls and stays below VWAP, indicating that sellers are dominating the session.
Pro Tip: Watch for VWAP reclaims as potential trend reversal signals. For example, if a stock has been trading below VWAP all morning and then decisively breaks above it on high volume, it can signal a shift in intraday control from sellers to buyers. This "VWAP reclaim" often provides a high-probability long entry point, with the VWAP line now acting as potential support.
6. Average True Range (ATR)
The Average True Range (ATR) is a pure volatility indicator that measures how much an asset moves on average over a given time frame. Developed by J. Welles Wilder Jr., ATR does not indicate price direction; instead, it quantifies volatility, making it an indispensable tool for risk management, position sizing, and setting realistic price targets.
By providing an objective measure of an asset's typical trading range, ATR helps traders adapt their strategies to current market conditions. Its core strength lies in its ability to help set dynamic stop-losses and take-profit levels that respect the market's natural rhythm, making it one of the most practical day trading indicators for managing risk.
How ATR Works in Practice
ATR is calculated as a moving average of the "true range" for a specified period, typically 14 days. The true range is the greatest of the current high minus the current low, the absolute value of the current high minus the previous close, or the absolute value of the current low minus the previous close. This calculation ensures gaps and limit moves are accounted for.
A rising ATR indicates that volatility is increasing, meaning the price is moving more over a given period. Conversely, a falling ATR suggests volatility is decreasing, often signaling a consolidation phase or waning interest. Day traders can use this information to adjust their tactics, for instance, by anticipating breakouts after periods of low ATR.
A classic use is in setting stop-losses. For example, a trader might place a stop-loss at 1.5x or 2x the current ATR value below their entry for a long position. This method ensures the stop is wide enough to avoid being triggered by normal market noise but tight enough to protect capital. Learn more about how to effectively set stop-losses using ATR for a more detailed approach.
Pro Tip: Adjust your position size based on volatility. When the ATR is high, reduce your position size to maintain a consistent dollar risk per trade. When the ATR is low, you can use a larger position size for the same risk level. This adaptive approach to sizing is a hallmark of sophisticated risk management.
7. Williams %R
The Williams %R, developed by famed trader Larry Williams, is a momentum indicator that excels at identifying overbought and oversold conditions in fast-moving markets. It functions as an oscillator, moving between 0 and -100, and helps traders gauge where the current closing price is relative to the highest high over a specific look-back period, typically 14 days.
Its primary strength lies in its sensitivity, which provides timely signals for potential entry and exit points. By quickly flagging extreme price levels, it helps day traders anticipate potential reversals or pullbacks. This makes it one of the most responsive day trading indicators for those looking to capitalize on short-term price swings and momentum shifts.
How Williams %R Works in Practice
The Williams %R provides clear, actionable signals based on its position relative to key thresholds. Unlike many oscillators, its scale is inverted, with lower numbers (closer to 0) indicating stronger momentum and higher numbers (closer to -100) signaling weakness.
Readings from 0 to -20 are considered overbought, suggesting that buying pressure may soon be exhausted. Conversely, readings from -80 to -100 are considered oversold, indicating that selling pressure could be waning. A common strategy involves watching for the indicator to move out of these extreme zones. For example, a trader might look for a buy signal when the %R moves from below -80 back up above it.
Pro Tip: Look for "failure swings." A failure swing occurs when the Williams %R fails to reach a new extreme while the price does. For instance, if the price makes a new low but the %R makes a higher low (staying above -80), it signals a bullish divergence and suggests that downside momentum is fading, presenting a potential buying opportunity.
8. Commodity Channel Index (CCI)
The Commodity Channel Index (CCI) is a momentum-based oscillator used to identify cyclical trends in an asset's price. Developed by Donald Lambert, it measures the current price level relative to an average price level over a given period. While originally designed for commodities, its effectiveness has made it a staple across all markets, including stocks, forex, and cryptocurrencies.
The CCI's primary function is to help traders spot overbought or oversold conditions, signaling potential turning points in price. Its strength lies in its ability to identify not just standard momentum shifts but also extreme price deviations from the norm, making it one of the most reliable day trading indicators for reversal strategies.
How CCI Works in Practice
The CCI calculates the difference between an asset's typical price and its simple moving average, then scales the value so that most values fall within a -100 to +100 range. The indicator’s movements above and below these key levels generate actionable trading signals.
Understanding how to interpret these zones is key to using the CCI effectively for entry and exit timing.
- A reading above +100 suggests the asset is overbought and may be due for a price correction downwards.
- A reading below -100 suggests the asset is oversold and could be poised for a price rally upwards.
A common bullish signal occurs when the CCI moves from below -100 back up across the -100 line, indicating that selling pressure is subsiding. Conversely, a bearish signal is generated when the CCI crosses back below the +100 line after being in overbought territory. This versatility also makes it a powerful tool for longer time frames, which is why it is often included among the best swing trading indicators.
Pro Tip: For higher-probability trades, watch for extreme readings. A move above +200 or below -200 signals a strong trend that is likely overextended and has a higher chance of reversing. Combining these extreme signals with price action confirmation, like a bearish engulfing candle after a +200 reading, can significantly improve the accuracy of your trades.
9. Parabolic SAR (Stop and Reverse)
The Parabolic Stop and Reverse (SAR) is a trend-following indicator designed to identify potential trend reversals and provide exit points. Developed by J. Welles Wilder Jr., it appears as a series of dots placed either above or below the price. When the dots are below the candles, it signals an uptrend; when they are above, it indicates a downtrend.
This indicator is particularly valued for its dynamic nature. The SAR dots accelerate with the trend, moving closer to the price over time, which provides a built-in trailing stop-loss mechanism. This dual function of identifying trend direction and managing risk makes it one of the most practical day trading indicators for active traders looking to capture profits in established trends.
How Parabolic SAR Works in Practice
The Parabolic SAR generates straightforward signals based on the position of its dots relative to the price. The core strength of the indicator is its simplicity in signaling a change in trend direction, making it easy to interpret at a glance.
A bullish signal occurs when the dots flip from above the price to below it, suggesting the downtrend has ended and a new uptrend is beginning. Conversely, a bearish signal is generated when the dots move from below the price to above it, indicating a potential end to the uptrend. Traders often use these flips as entry or exit signals. For example, the dots can be used as a dynamic trailing stop-loss, with a position being closed when the price touches or crosses the SAR dot.
Pro Tip: Parabolic SAR excels in strong, trending markets but can generate frequent false signals in sideways or ranging conditions. To improve its reliability, combine it with a trend-confirming indicator like the Average Directional Index (ADX). A strong ADX reading (typically above 25) can validate the trend signals from the Parabolic SAR, helping you filter out noise and focus on higher-probability trades.
Top 9 Day Trading Indicators Comparison
| Indicator | Implementation Complexity 🔄 | Resource Requirements ⚡ | Expected Outcomes 📊 | Ideal Use Cases 💡 | Key Advantages ⭐ |
|---|---|---|---|---|---|
| Moving Average Convergence Divergence (MACD) | Medium 🔄🔄 | Low ⚡ | Trend direction + momentum identification 📊 | Trending markets, reversal spotting | Combines trend & momentum, clear signals ⭐ |
| Relative Strength Index (RSI) | Low 🔄 | Low ⚡ | Overbought/oversold identification 📊 | Range-bound markets, timing trades | Simple, clear signals, easy interpretation ⭐ |
| Bollinger Bands | Medium 🔄🔄 | Medium ⚡ | Volatility-based support/resistance 📊 | Volatile markets, breakout detection | Adapts to volatility, dynamic levels ⭐ |
| Stochastic Oscillator | Medium 🔄🔄 | Low ⚡ | Overbought/oversold and momentum signals 📊 | Sideways/volatile markets, entry/exit timing | Sensitive, clear crossover signals ⭐ |
| Volume Weighted Average Price (VWAP) | Low 🔄 | Medium ⚡ | Intraday fair value, support/resistance 📊 | Intraday trading, institutional benchmarks | Institutional reference, strong intraday support ⭐ |
| Average True Range (ATR) | Low 🔄 | Low ⚡ | Volatility measurement, risk management 📊 | Stop-loss setting, position sizing | Essential for risk, works all markets ⭐ |
| Williams %R | Low 🔄 | Low ⚡ | Overbought/oversold momentum signals 📊 | Scalping, volatile short-term markets | Highly sensitive, good for scalping ⭐ |
| Commodity Channel Index (CCI) | Medium 🔄🔄 | Low ⚡ | Cyclical trend and extreme movement signals 📊 | Trending and ranging markets | Identifies cycles, good divergence tool ⭐ |
| Parabolic SAR (Stop and Reverse) | Low 🔄 | Low ⚡ | Trend direction and reversal points 📊 | Strong trending markets | Visual trend dots, built-in stop-loss ⭐ |
Beyond the Indicators: Building Your Cohesive Trading System
We've explored a powerful arsenal of day trading indicators, from the momentum-tracking MACD and RSI to the volatility-measuring Bollinger Bands and ATR. Each tool offers a unique lens through which to analyze price action, identify potential entry and exit points, and manage risk. You've learned how the Stochastic Oscillator signals overbought or oversold conditions, how VWAP acts as an institutional benchmark for intraday price, and how Parabolic SAR can provide dynamic stop-loss levels.
However, the most critical takeaway is this: no single indicator is a magic bullet. Relying on one tool in isolation is like trying to navigate a complex environment with only one sense. True trading proficiency emerges not from mastering a single indicator, but from skillfully combining several into a cohesive and personalized system.
The Power of Confluence
The real art of technical analysis lies in finding confluence. This is the concept where multiple, non-correlated indicators provide the same signal, creating a high-probability setup. An isolated signal can be noise; a chorus of signals is a compelling reason to act.
Consider these powerful combinations:
- Momentum and Volatility: A bullish MACD crossover gains significant strength if it occurs as Bollinger Bands are contracting (a "squeeze"), suggesting an impending breakout. The RSI moving above 50 would further confirm this building momentum.
- Price Action and Volume: A stock bouncing off its VWAP is a noteworthy event. If that bounce is confirmed by a high-volume candle and an oversold reading on the Stochastic Oscillator, it transforms from a simple observation into a robust long entry signal.
- Trend and Reversal: A Parabolic SAR flip indicating a potential trend reversal becomes far more reliable if it's accompanied by the CCI crossing back into the +/-100 range and the Williams %R moving out of an extreme overbought or oversold zone.
Integrating Market Sentiment
While these technical day trading indicators are essential for analyzing "what" is happening with price, they don't always explain "why." This is where market sentiment becomes an invaluable layer in your analysis. A technically perfect buy signal can fail spectacularly in a market gripped by extreme fear. Conversely, a bearish signal might be premature in a market fueled by irrational greed.
Understanding the prevailing psychological mood provides the context for your technical signals. It helps you filter out low-probability trades that go against a powerful emotional current and gives you greater confidence in trades that align with both the technicals and the market's overarching sentiment. Building a system that validates chart patterns with sentiment data is how you evolve from simply reading charts to truly understanding the market's narrative.
Ultimately, the goal is to stop being a passive user of indicators and become an architect of your own trading system. Test different combinations, understand how they interact, and find a setup that aligns with your unique trading style, risk tolerance, and chosen assets. This journey from knowledge to application is what separates fleeting success from consistent, long-term profitability in the dynamic world of day trading.
Ready to add the crucial layer of market sentiment to your technical analysis? The Fear Greed Tracker provides real-time data on the emotional state of the market, helping you contextualize the signals from your day trading indicators. Validate your trade setups and avoid emotional market traps by visiting Fear Greed Tracker to see how sentiment can sharpen your trading edge.