
The Cryptocurrency Fear and Greed Index is a powerful tool that boils down a ton of complex market data into one simple number. Think of it as a kind of emotional barometer for the crypto market, giving a daily score from 0 (Extreme Fear) to 100 (Extreme Greed).
This single score is designed to answer a crucial question: are investors getting too scared or a little too greedy?
A Barometer for Crypto Market Sentiment
Picture a busy street market. When a hot new item drops, a crowd swarms in, driven by pure excitement and the fear of missing out. Prices shoot up. That's greed. Now imagine a rumor spreads that the item is faulty. Panic ensues, everyone rushes to offload what they bought, and the price crashes. That's fear.
The crypto market is just like that, only the emotional swings are bigger, faster, and far more volatile. The Fear and Greed Index is built to measure this collective psychology. It’s not just a vibe check; it's a data-driven score that takes the pulse of millions of traders at once. Why does that matter? Because huge emotional shifts often come right before the market makes a major move.
The index is built on a classic contrarian investing idea, best summed up by Warren Buffett: "Be fearful when others are greedy, and greedy when others are fearful." This tool gives you a systematic way to see those emotional peaks and valleys.
Before we dive deeper, here's a quick cheat sheet to help you understand what the index is telling you at a glance.
Quick Guide to the Fear and Greed Index
This table breaks down the core concepts of the index, what each sentiment level means, and the primary signal it sends to traders.
| Concept | What It Means | Primary Signal |
|---|---|---|
| Extreme Fear (0-24) | Widespread panic, investors are selling off assets indiscriminately. The market is worried. | Potential buying opportunity, as assets may be undervalued or oversold. |
| Fear (25-49) | General unease and caution in the market. Investors are more risk-averse than usual. | A good time to look for solid projects that have been unfairly sold off. |
| Neutral (50) | The market is balanced—not overly emotional in either direction. | A period for observation. The market could be consolidating before its next move. |
| Greed (51-74) | Optimism is high, and investors are increasingly buying. FOMO starts to kick in. | A signal to be cautious. The market might be getting a bit frothy. |
| Extreme Greed (75-100) | Euphoria has set in. Investors are buying with little regard for fundamentals, expecting prices to only go up. | A strong warning that a market correction could be on the horizon. Time to consider taking profits. |
By keeping these levels in mind, you can quickly interpret the daily score and use it as a valuable piece of context for your own trading decisions.
Why Tracking Market Emotions Matters
If you only look at price charts, you're missing half the picture. Those numbers on the screen are the result of human decisions, and those decisions are soaked in emotion. The index lets you peek behind the curtain to understand the why behind the price action.
For instance, a rock-bottom index score screams panic. People are dumping their bags without thinking. While that sounds terrifying, it can also be a golden opportunity for a savvy investor to scoop up quality assets at a discount. Conversely, a sky-high score signals euphoria and FOMO, which is often a warning sign that the market is overheated and a correction is overdue. For a more in-depth look, you can check out our detailed guide on the Fear & Greed Index in the crypto market, which breaks these ideas down even further.
How It Translates to Your Decisions
By turning fuzzy emotions into a hard number, the index helps you stay grounded and make more rational choices instead of getting swept away by the hype or the FUD (Fear, Uncertainty, and Doubt). It’s a simple, at-a-glance signal that adds critical context to your research.
Here’s how it can give you an edge:
- Spotting Contrarian Plays: It flags moments of extreme emotion, which have historically been great times to go against the grain and either buy or sell.
- Gauging Market Risk: An "Extreme Greed" score is like a flashing yellow light. It warns you that the market might be getting ahead of itself and helps you manage your risk accordingly.
- Dodging Emotional Traps: When you see a high greed score, it’s a great reminder to fight off FOMO. When you see a low fear score, it can be the nudge you need to investigate further instead of panic-selling with everyone else.
How the Index Is Calculated
The crypto Fear & Greed Index isn't just a number pulled out of thin air. It’s a carefully crafted score that blends several key market indicators into one straightforward reading.
Think of it like a seasoned chef making a complex sauce. You wouldn't rely on just one ingredient, right? Instead, you’d combine different flavors—a little heat, a little sweetness, a bit of acid—to get the perfect balance. The index does the same thing with market data, mixing different signals to paint an accurate picture of what investors are feeling.
By looking beyond price alone, the index gets to the heart of market psychology. This multi-layered approach means the final score isn't easily swayed by a single metric, giving you a more reliable snapshot of whether the market is panicking or getting a little too euphoric.
This visual shows you just how simple it is to read the index on its 0-100 scale.
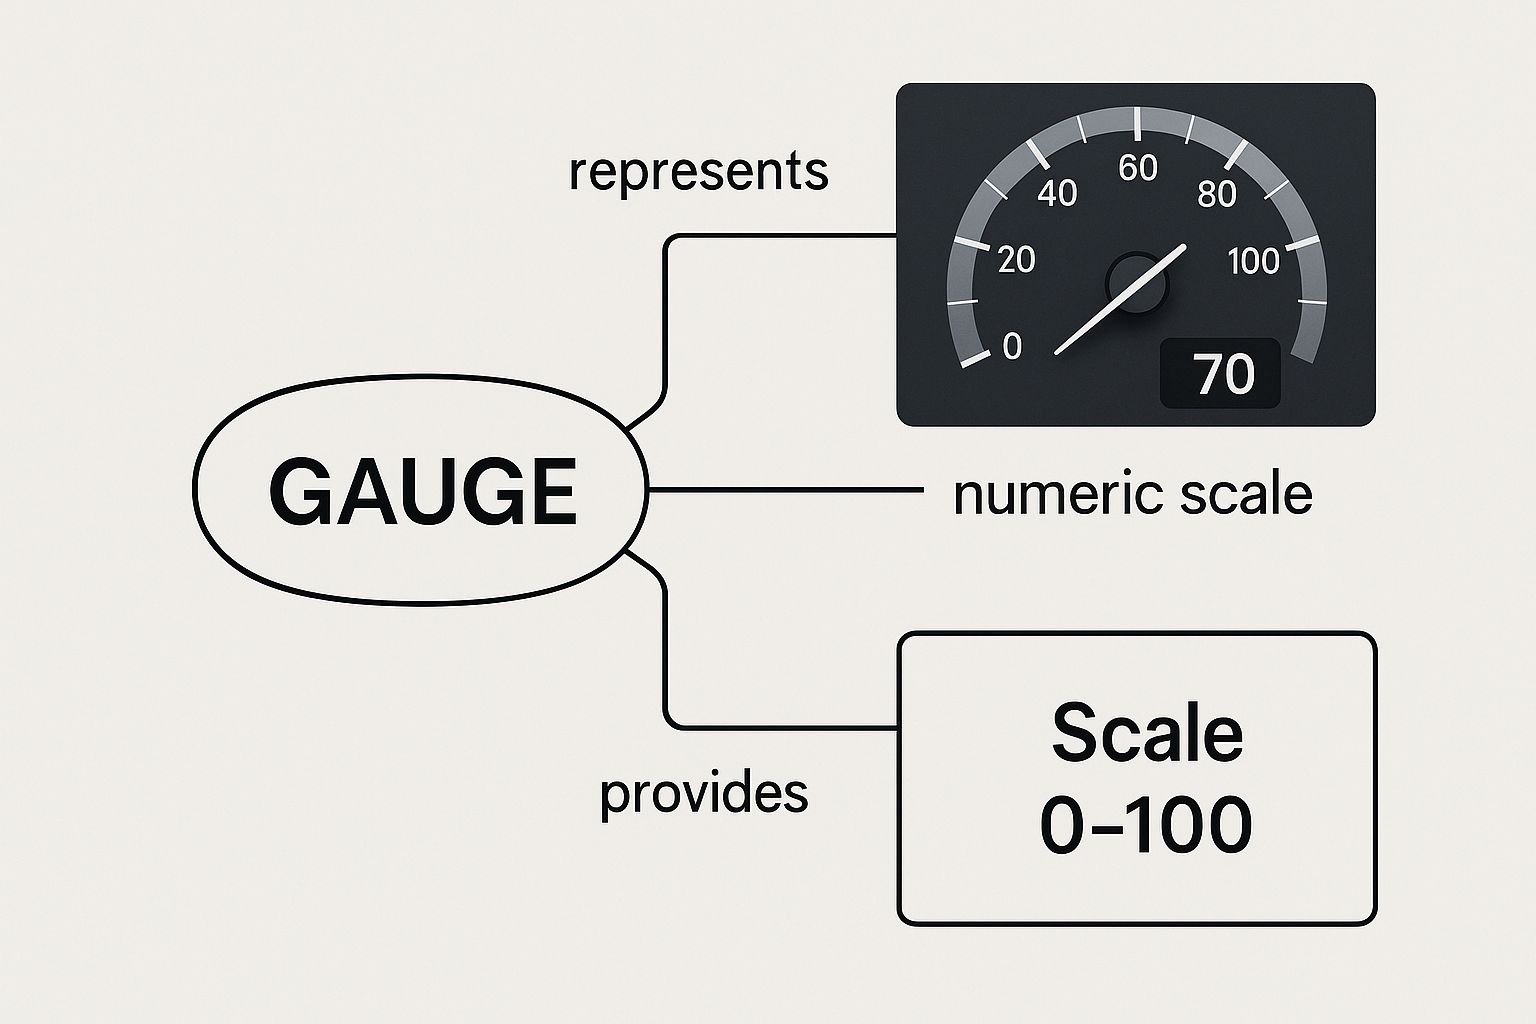
The gauge makes it intuitive: low numbers scream fear, while high numbers signal greed. It’s a quick gut check for the market's emotional state.
Core Data Ingredients of the Index
So, what exactly goes into this calculation? To really trust the index, you need to know what's under the hood. Each piece of the puzzle is weighted differently, and it’s this specific blend of data that makes the tool so effective.
Here are the primary factors driving the score:
Volatility (25% Weight): This measures Bitcoin’s current price swings against its averages over the last 30 and 90 days. A sudden spike in volatility is a classic sign of a fearful market, often pointing to panic selling.
Market Momentum & Volume (25% Weight): This compares current trading volume and momentum with the 30- and 90-day averages. When there's a big surge in buying on up days, you can bet the market is feeling greedy and bullish.
Social Media (15% Weight): The index keeps a finger on the pulse of crypto conversations online. It tracks things like post volume, specific hashtags, and engagement. A sudden, unusual explosion in social media chatter often means public interest is peaking and greed is setting in.
These three components make up the lion's share of the index, but there are a few other signals that add crucial context.
Supporting Data Points
Beyond those main drivers, the index pulls in a few other data sources to fine-tune its reading. These help catch the more subtle shifts in how investors are behaving.
The real goal here is to create a well-rounded indicator. It captures what active traders are doing and what the general public is thinking about crypto. That combination is what gives you such a deep insight into market psychology.
The remaining 35% of the index comes from a few other interesting sources. For instance, weekly surveys asking thousands of people for their market outlook make up about 15% of the score.
Bitcoin's market dominance—its share of the total crypto market cap—contributes another 10%. When Bitcoin’s dominance rises, it’s often a sign of fear, as traders flock back to the perceived safety of the original cryptocurrency.
Finally, Google Trends data adds the last 10%. Spikes in search terms like "Bitcoin price manipulation" are a pretty clear indicator that fear is on the rise.
By understanding how all these different pieces are weighted and combined, you can feel much more confident in what the index is telling you. It’s not some mysterious black box; it's a transparent tool built on real, observable market behavior. You can dive even deeper into how to apply it in our complete guide that explains the crypto Fear and Greed Index in more detail.
How to Read the Fear and Greed Index Levels
Decoding the cryptocurrency Fear and Greed Index is a bit like learning to read a weather forecast for the market's mood. Instead of predicting rain or sun, it signals the emotional storms or clear skies ahead for traders. The scale is simple, running from 0 (deep red, signaling total panic) to 100 (bright green for pure euphoria), giving you an instant snapshot of where the collective head of the market is at.
Understanding this scale turns a simple number into a powerful piece of market intelligence. A reading isn't just a score; it's a story about the collective mindset of millions of traders. Let’s break down what each level really means and the kind of investor behavior you can expect to see.
Extreme Fear and Fear Zones
When the index plunges into the lower ranges, it’s a clear sign that panic is taking hold. This is the emotional equivalent of investors stampeding for the exits, often dumping their assets without a second thought.
Extreme Fear (0-24): This is the market at its absolute lowest point, emotionally speaking. Investors are overwhelmingly worried, which often triggers widespread, indiscriminate sell-offs. For a contrarian investor, this can be a flashing green light, signaling that assets are potentially oversold and undervalued. Think of it as a "Black Friday sale" on crypto, where fear has hammered prices down, sometimes unjustifiably.
Fear (25-49): While not full-blown panic, this zone reflects a heavy dose of caution and uncertainty. Investors are nervous, and the appetite for risk is low. You’ll often see slower price declines or the market moving sideways as everyone waits for a clearer signal. It's a time for patience, observation, and solid research.
The Neutral Midpoint
A neutral reading often gets overlooked, but it tells you something crucial: the market is in a state of equilibrium. The forces of fear and greed are pretty much balanced out.
Neutral (50): At this level, the market is essentially taking a breath. There’s no strong emotional pull in either direction. This is often a sign of consolidation, where prices trade within a tight range before making their next big move. A neutral reading means indecision, making it a critical time to watch for a breakout.
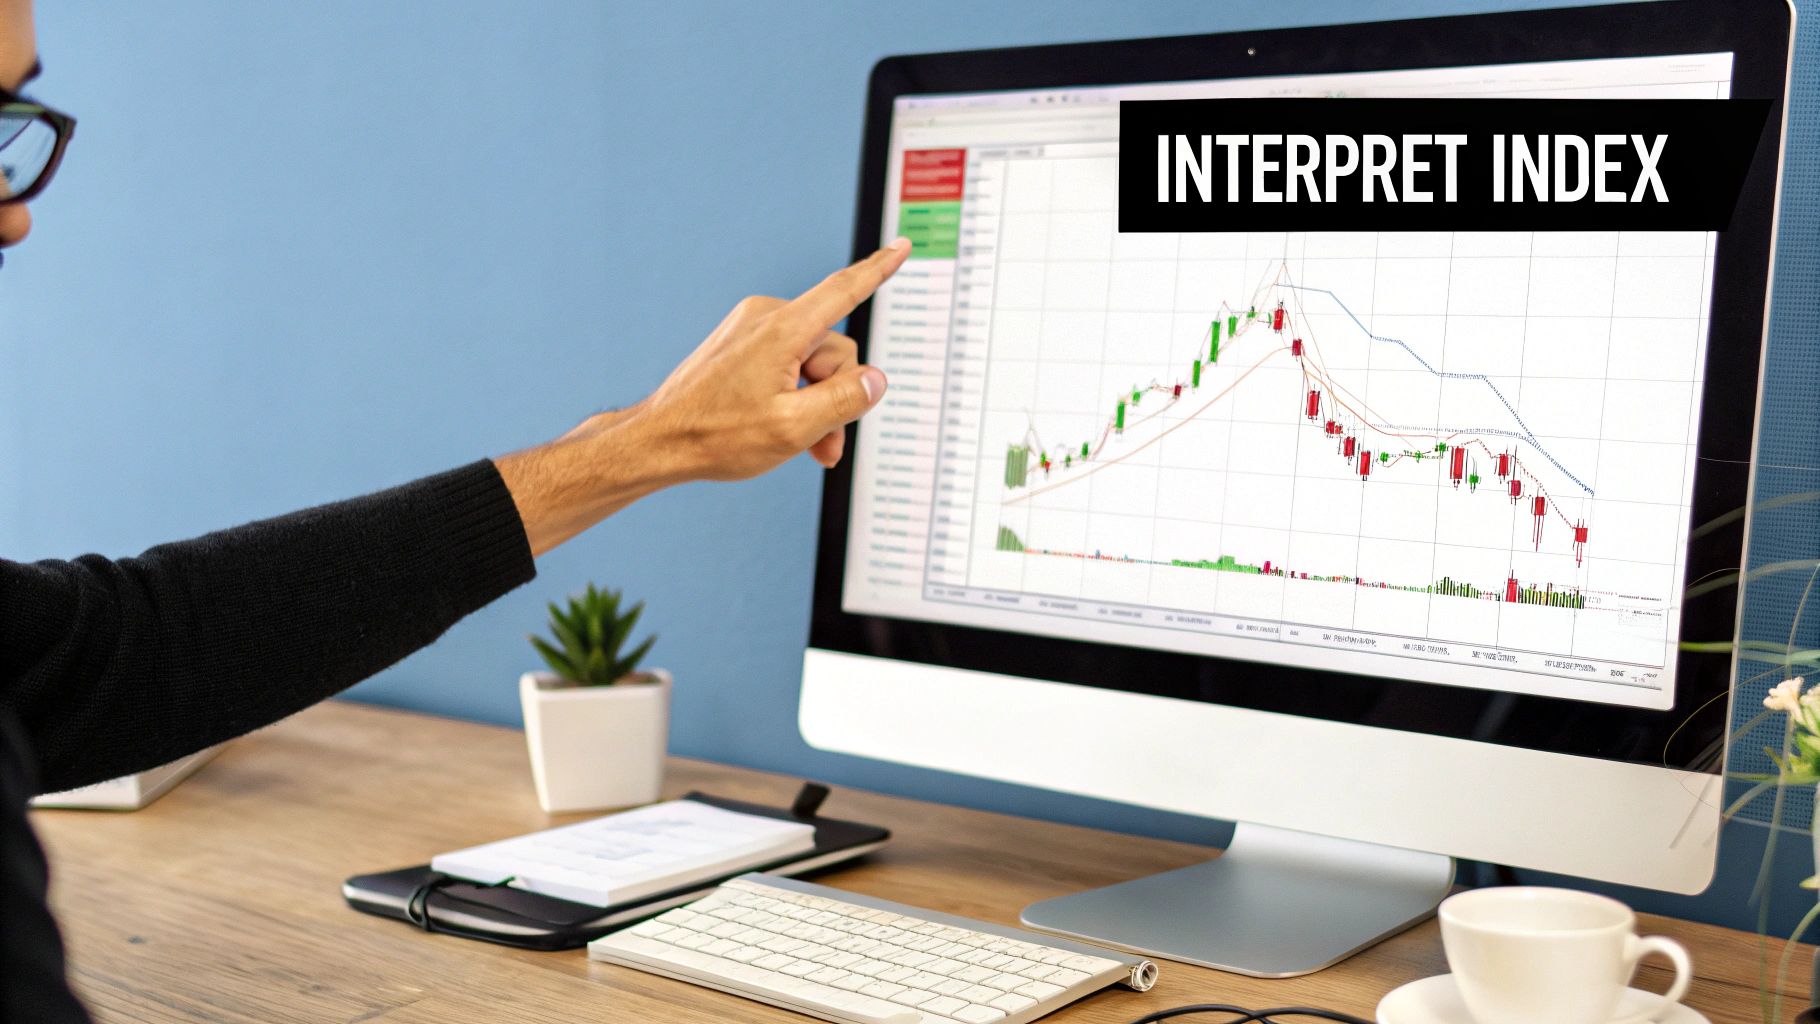
This screenshot gives you a real-time look at the index, providing a clear visual of its current reading alongside its historical context.
The gauge immediately tells you where sentiment stands today, while the chart below it shows how that compares to past trends. It's this historical view that helps put the current market mood into perspective.
Greed and Extreme Greed Zones
As the index climbs into the upper echelons, the market's mood flips from caution to optimism, and eventually, to outright euphoria. This is where the fear of missing out (FOMO) becomes a powerful, and often dangerous, market driver.
Greed (51-74): Optimism is starting to bubble up. Investors are feeling confident, and buying pressure is on the rise. FOMO begins to creep in as more people jump on the bandwagon, chasing rising prices. While this is a bullish sign, it’s also a cue to start paying close attention, as markets can become overextended.
Extreme Greed (75-100): Welcome to the zone of pure euphoria. Here, investors are buying with little regard for an asset's fundamental value, driven by the belief that prices will only go up. Historically, this is a massive warning sign that the market is overheated and a correction could be just around the corner. It's often the point where savvy investors consider taking some profits off the table.
To make these levels even clearer, here’s a quick breakdown of what to expect at each stage.
Fear and Greed Index Levels Explained
| Numerical Range | Sentiment Level | Potential Market Implication |
|---|---|---|
| 0 - 24 | Extreme Fear | Investors are panicking. Could be a prime buying opportunity for contrarians. |
| 25 - 49 | Fear | General worry and uncertainty. Assets may be undervalued. |
| 50 | Neutral | The market is undecided. A holding pattern before the next big move. |
| 51 - 74 | Greed | Investors are getting overconfident. FOMO is setting in. |
| 75 - 100 | Extreme Greed | Euphoria is rampant. The market may be due for a correction. |
Ultimately, these levels provide a psychological roadmap. By understanding what drives the numbers, you can start to see market movements not as random noise, but as predictable patterns of human behavior.
Using the Index in Your Trading Strategy
Knowing the theory behind the crypto Fear & Greed Index is one thing. Actually using it to make better trades? That's where the magic happens. It’s time to move from concept to action and use the index as a tool to make rational, data-driven decisions instead of getting swept up in market madness.
The whole idea is built on a contrarian mindset, perfectly summed up by Warren Buffett's famous advice: be "fearful when others are greedy, and greedy when others are fearful." The index gives you a systematic way to apply this timeless wisdom to the wild world of crypto.
A Contrarian Approach to Market Extremes
The most direct way to use the index is as a contrarian signal. You're essentially looking for moments when the market's emotions have hit a boiling point—either wild greed or sheer panic—and you consider doing the exact opposite.
When the index flags these intense emotions, it often pinpoints potential turning points in the market.
Extreme Fear as a Buying Signal: When the index crashes into the "Extreme Fear" zone (typically 0-24), it's a sign that investors are dumping their bags in a panic. This kind of fear can push asset prices well below what they're truly worth. For anyone investing for the long haul, this can be a golden opportunity to scoop up quality assets at a serious discount.
Extreme Greed as a Selling or Caution Signal: On the flip side, when the index shoots up into "Extreme Greed" (usually 75-100), it means FOMO is in full swing. The hype is everywhere, and prices might be stretched thin. This is your cue that a market correction could be just around the corner, making it a smart time to think about locking in some profits or tightening your stop-losses.
Here’s a pro tip: Don't get worked up over every little dip or spike. The real power of the index is in spotting the extremes. A score of 45 (Fear) or 65 (Greed) isn't nearly as telling as a dramatic reading of 15 or 85. Keep your eyes on the peaks and valleys.
This strategy helps you buy low when everyone else is scared and sell high when they're getting overconfident. It’s a systematic way to sidestep the emotional roller coaster that causes so many traders to do the opposite. To go even deeper on this, check out our guide on how to use market sentiment analysis for trading.
Practical Scenarios and Frameworks
Let's make this real. Imagine you're watching the market and the index gives you a clear signal. What's the game plan?
Scenario 1: The Index Hits 15 (Extreme Fear)
You check the Fear & Greed Index first thing in the morning and it’s at a miserable 15. The charts are a sea of red.
- Your Action Framework:
- Don't Panic-Sell: First thing's first—take a breath. Recognize the fear and resist the urge to join the herd mentality.
- Look for Strength: Which of the assets on your watchlist are holding up best? Do their long-term fundamentals still look solid?
- Consider Dollar-Cost Averaging (DCA): This is a perfect time to make one of your scheduled buys. Buying into a fearful market brings your average cost down.
- Get a Second Opinion: Never rely on the index alone. Is the price bouncing off a key support level? Is the RSI showing a bullish divergence? Look for confirmation.
Scenario 2: The Index Hits 88 (Extreme Greed)
Bitcoin is blasting through all-time highs, and your social media feed is full of people bragging about their gains. The index is glowing at a euphoric 88.
- Your Action Framework:
- Fight the FOMO: Acknowledge the greed and step back. Now is not the time to make impulsive buys at the top.
- Review Your Portfolio: This is a logical moment to rebalance. Think about taking some profit off the table from positions that have had incredible runs.
- Set or Tighten Stop-Losses: Protect what you've earned. Place stop-losses or trailing stops to make sure you lock in gains if the market suddenly turns.
- Wait for a Pullback: If you're looking to get into a position, patience is your best friend. Wait for the hype to die down and for prices to pull back to a more sensible entry point.
By building simple "if-then" plans like these, you create a disciplined trading system that uses market sentiment as a core component. It turns the index from something you just look at into an active tool that helps you stay logical when the market is anything but.
Of course. Here is the rewritten section, crafted to sound like an experienced human expert, following all your specified requirements.
Historical Examples of the Index in Action
Theory is great, but the real test of any market tool is how it performs in the wild. Looking back at major market events, we can see exactly how the Fear & Greed Index captured the collective mood of investors, often acting as a reliable barometer for what was to come.
These aren't just interesting data points on a chart; they're snapshots of human emotion driving massive market swings. Let's revisit a few of these moments to see the index in action.
The COVID-19 Crash: March 2020
Few events have rattled global markets like the onset of the COVID-19 pandemic. In March 2020, fear wasn't just in the air—it was everywhere. As traditional markets spiraled, crypto followed suit in a spectacular freefall.
The panic was visceral, and the index reflected it perfectly. On March 12, 2020, a day now infamously known as "Black Thursday," Bitcoin's price was practically cut in half. The Fear & Greed Index plummeted to a bone-chilling score of just 10. This wasn't just fear; it was absolute terror, with investors dumping assets at any price.
This is the kind of signal contrarian traders live for. While the entire world seemed to be shouting "sell," the index was quietly whispering that the market was profoundly oversold. Those brave enough to step in and buy when the fear was thickest were rewarded handsomely over the next year.
The Euphoric Bull Run of 2021
Flip the calendar forward to early 2021, and the emotional landscape couldn't have been more different. Bitcoin was on an absolute tear, blasting past old all-time highs and becoming the talk of the town. The market was drunk on optimism, and again, the index told the story.
In January and February of 2021, the index was pinned deep in "Extreme Greed" territory, frequently clocking in with scores above 90. This was the signature of pure market euphoria, a potent cocktail of retail FOMO, fresh institutional money, and the buzz from "DeFi summer."
This extended period of greed was a clear warning sign. Even as prices climbed higher, the index suggested the market was becoming dangerously overheated and that a significant correction was on the horizon. Astute traders who paid attention might have started taking some chips off the table or tightening their stop-losses.
The index's historical data, when laid over price charts, shows a strikingly strong correlation. A deeper dive into the numbers on Cointree's learning hub reveals this pattern time and again. For instance, sentiment was largely greedy from mid-2019 to early 2020 before the pandemic crash sent it into extreme fear. Conversely, the index peaked in February 2021 as Bitcoin rocketed from around AU$10,000 to AU$50,000, staying hot until news of China's mining ban poured cold water on the market.
These examples drive home a critical point: the index is more than just a number. It's a narrative of the market's emotional rollercoaster, quantifying the very human feelings that fuel crypto's notorious boom-and-bust cycles. It gives you a perspective that a price chart alone simply can't.
Common Misconceptions and Limitations
It’s easy to look at the Fear & Greed Index and think you’ve found a crystal ball for the crypto market. But treating it as an infallible predictor is one of the most common—and costly—mistakes a trader can make.
Let's get one thing straight: the index is an indicator, not a command. Its real power comes from giving you a peek into the market's emotional state, but it should never, ever be the only reason you place a trade.
A huge misunderstanding is seeing it as a direct buy or sell signal. A score of 15 (Extreme Fear) doesn't mean you should blindly rush in and buy. Likewise, a score of 85 (Extreme Greed) isn't a guaranteed signal to dump all your holdings. Think of these scores as a flashing light telling you to pay closer attention and confirm what you're seeing with other tools.
It's Not a Timing Tool
One of the toughest lessons for traders is that the market can stay in "Extreme Greed" or "Extreme Fear" for a surprisingly long time. Impatient traders often get burned here.
For example, during a roaring bull market, the index might hover above 75 for weeks on end. If you sell at the first sign of greed, you could miss out on a massive chunk of the rally. On the flip side, fear can linger for months during a brutal bear market. Jumping in to buy too early just means you'll be watching your portfolio sink deeper into the red.
The index tells you the market's current emotional temperature, but it doesn't tell you how long that temperature will last. It’s a snapshot, not a forecast.
Key Limitations to Keep in Mind
To use the index the right way, you have to respect its limits. It’s a fantastic supplement to a solid trading strategy, but it’s not a strategy all on its own.
Here’s what you need to remember:
- It’s a Lagging Indicator: The index is more of a rearview mirror than a windshield. It reflects sentiment that has already been shaped by recent price moves, so it’s better at confirming what has happened than predicting what will happen.
- It’s Bitcoin-Centric: Most popular versions of the index are heavily weighted toward Bitcoin. While BTC often sets the tone for the entire market, its sentiment might not tell the whole story for a specific altcoin you're watching.
- It’s Vulnerable to Shocks: A sudden piece of news—like a major exchange hack or a surprise regulatory announcement—can flip market sentiment on a dime. The index, which pulls from various data sources, might take some time to fully reflect that sudden shift.
Ultimately, the smartest way to use the Fear & Greed Index is to weave it into a broader, more robust strategy. Pair its insights with your own technical analysis, fundamental research, and a disciplined risk management plan. That’s how you make informed, less emotional decisions.
Have Questions? We've Got Answers
If you're starting to use the cryptocurrency Fear & Greed Index, you probably have a few questions. That's a good thing. It means you're thinking like a trader. Here are some of the most common ones we hear.
How Often Is the Index Updated?
It really depends on where you’re getting your data.
The original index from Alternative.me—the one most people know—updates just once every 24 hours. For long-term investors or swing traders, this daily pulse is often all you need to get a feel for the market's general mood.
But if you're a day trader, a day is an eternity. That's why other platforms offer much faster updates, some as frequently as every 15 minutes. This lets you see emotional shifts happening in near real-time, which is crucial when you need to react quickly to a sudden spike in fear or a wave of irrational greed.
Can I Use the Index for Specific Altcoins?
Not directly, no. The classic Fear & Greed Index is a big-picture tool. It's designed to measure the sentiment of the entire crypto market, and since Bitcoin is the 800-pound gorilla in the room, its performance heavily sways the final score. Think of it as a weather forecast for the whole crypto ecosystem, not just your specific city.
Still, that doesn't make it useless for altcoin traders. When the index screams "Extreme Fear," you can bet that nearly all altcoins are also taking a beating. This can signal some fantastic buying opportunities across the board. The opposite is true for "Extreme Greed"—a rising tide of bullishness often lifts all boats, altcoins included. While a few platforms are starting to develop individual sentiment scores for major coins like Ethereum, the main index remains your go-to market barometer.
Just How Reliable Is It for Calling Tops and Bottoms?
Historically, it's been surprisingly good at pinpointing major turning points. Time and again, a score of "Extreme Fear" has lined up almost perfectly with market bottoms, just as "Extreme Greed" has often appeared right before a major pullback. It's one of the best contrarian indicators out there.
But—and this is a big but—the index is not a crystal ball. It reflects what's happening now, it doesn't predict what will happen next.
A market can stay irrationally greedy for weeks during a powerful bull run. If you sell at the first sign of greed, you could miss out on huge gains. Likewise, fear can linger for a long, long time during a brutal bear market.
The best way to use the index is as a confirmation tool. Don't trade on the score alone. Instead, use it to add context to your existing strategy. See a signal of "Extreme Fear"? Great. Now, look for confirmation from your other tools, like a bounce off a key support level on the charts, before you pull the trigger.
Ready to stop guessing and start measuring market sentiment? Fear Greed Tracker gives you real-time scores for over 50,000 assets, so you can see exactly when the market is fearful or greedy. Get your edge at https://feargreedtracker.com and make smarter, data-driven decisions today.