
Ever feel like the crypto market has a mind of its own? One day it's euphoric, the next it's a complete panic. That's not just random noise—it's market sentiment. The crypto Fear and Greed Index is a powerful tool designed to measure that exact sentiment, giving you a simple 0-100 score that acts like a market mood ring.
When the score is low, fear is running rampant. When it’s high, greed has taken over. Understanding this emotional pulse can give you a serious edge.
What Is the Crypto Fear and Greed Index?
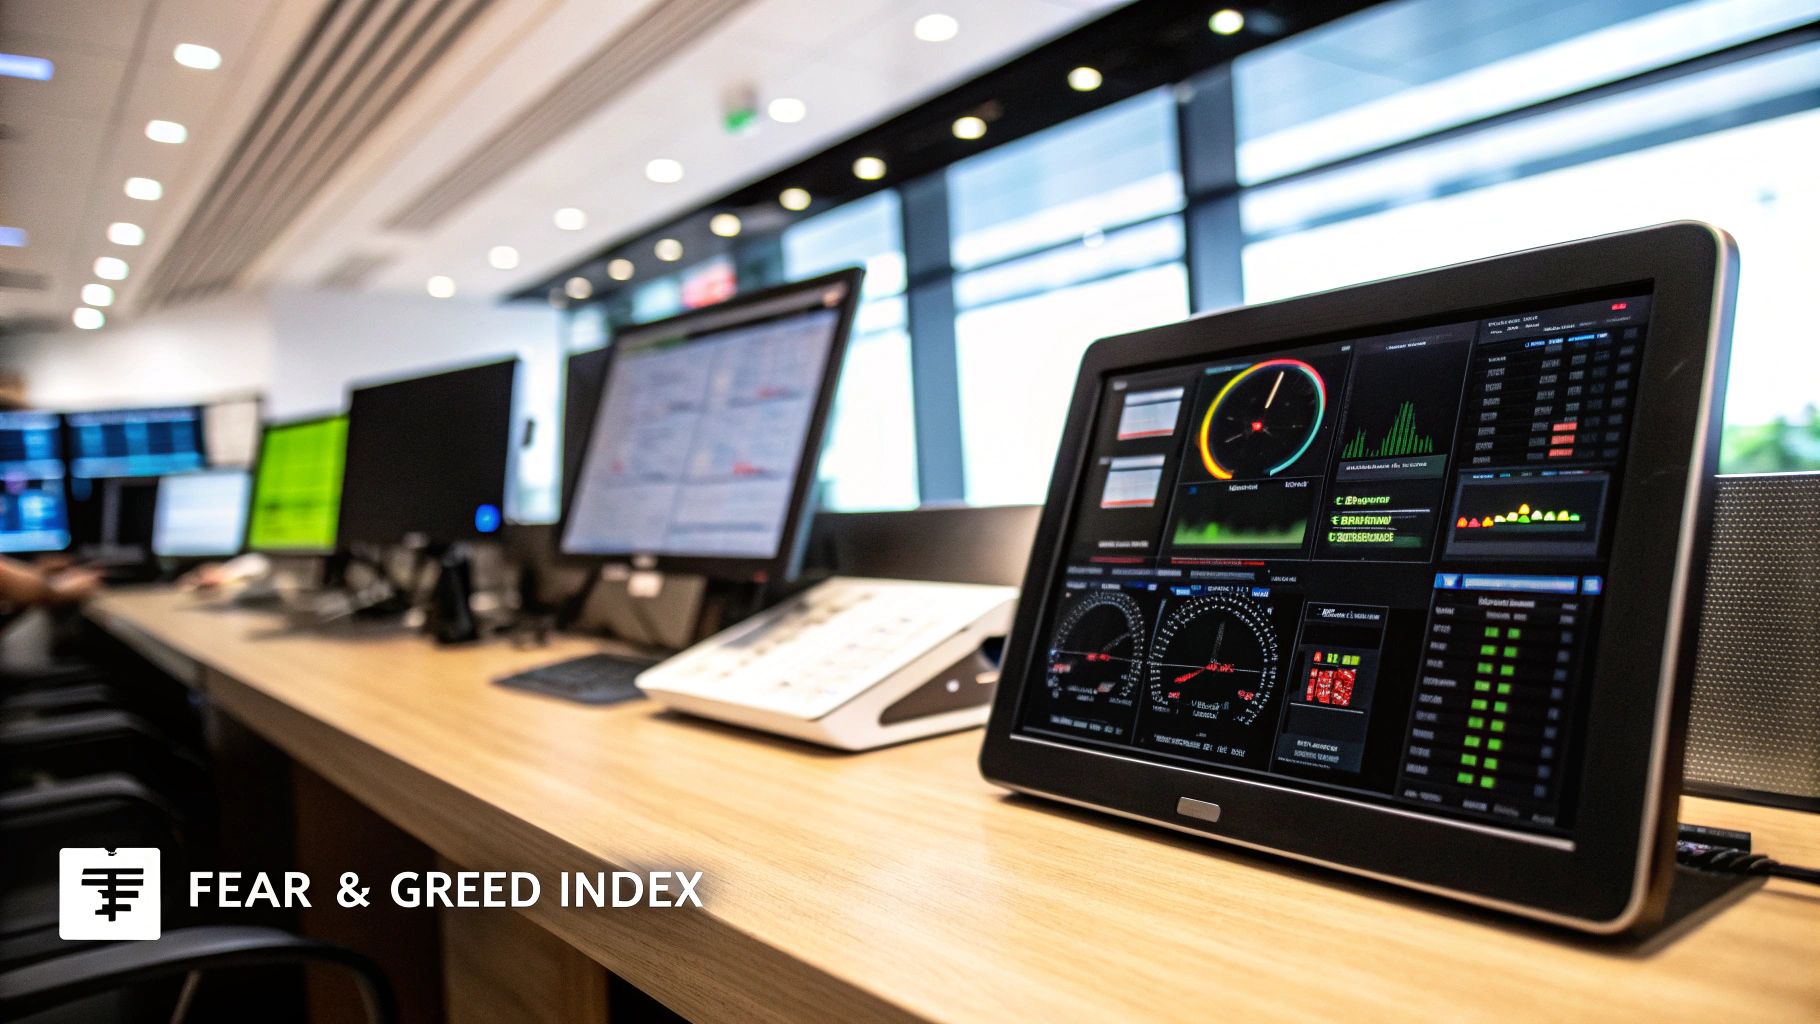
Let's be honest: the crypto market is famously volatile. But that volatility isn't just about tech breakthroughs or adoption rates; it's fueled by powerful human emotions. The Crypto Fear and Greed Index was created to cut through the chatter and quantify this emotional landscape, giving traders a snapshot of market psychology.
It’s inspired by traditional stock market indicators but built specifically for the wild ride of digital assets. The core idea is simple: fear and greed are two of the biggest forces moving the market. By tracking them, you can avoid getting swept up in herd mentality and start making more calculated moves.
The Emotional Ebb and Flow
When prices are climbing, the fear of missing out (FOMO) kicks in, and everyone gets greedy. On the flip side, when prices start to tank, panic selling takes over, and fear dominates. The index is designed to capture this pendulum swing between the two extremes.
It’s all about applying one of the most famous pieces of investment wisdom:
“Be fearful when others are greedy, and greedy when others are fearful.” - Warren Buffett
This timeless advice is the entire philosophy behind the index. It encourages you to think like a contrarian—to see buying opportunities when everyone else is panicking and to step back when euphoria is at its peak. This is often what separates disciplined traders from those who just follow the crowd.
If you want to see the live data, you can check out a detailed view of the crypto fear and greed index for the crypto market.
The score isn't just a hunch; it's a composite metric pulled from several key data points. While we’ll dig into the exact formula later, here’s a look at what goes into it:
- Market Volatility: Big, sudden price drops usually signal a fearful market.
- Trading Volume: A surge in buying volume during a rally points to greed.
- Social Media Buzz: When social media is buzzing with positive sentiment, greed is likely growing.
- Bitcoin Dominance: A rising Bitcoin dominance can indicate fear, as traders often retreat to the perceived safety of BTC.
Understanding the Score
The index gives you a simple score from 0 to 100, making it incredibly easy to read the room at a glance.
Here’s a quick reference table to help you interpret the numbers and understand what they mean for the market.
Crypto Fear and Greed Index Score Meanings
| Score Range | Sentiment Label | What It Means for the Market |
|---|---|---|
| 0-24 | Extreme Fear | Indicates widespread panic. May be a prime buying opportunity for contrarian investors. |
| 25-49 | Fear | Suggests general nervousness and caution. Investors are bearish and hesitant. |
| 50 | Neutral | The market is balanced, with no strong emotional pull in either direction. |
| 51-74 | Greed | Shows growing optimism and FOMO. The market might be getting overextended. |
| 75-100 | Extreme Greed | Signals market euphoria. This is often a warning sign that a correction could be coming. |
Think of this tool as a way to see the emotional waves of the market more clearly. It’s not a crystal ball that predicts exact prices, but it is an essential instrument for gauging investor psychology and adding a vital layer of context to your trading strategy.
How the Fear and Greed Index Is Calculated
The crypto Fear and Greed Index isn't just a number pulled out of thin air. It’s a carefully calculated score, blending multiple data points to paint a picture of the market's overall mood.
Think of it like a chef’s secret recipe. You don't just throw ingredients into a pot; each one is measured and added in a specific proportion to get the flavor just right. The index works the same way, combining several market signals—each with its own "weight"—to create one simple, powerful score. This approach ensures the final number is a reliable snapshot of market sentiment, not just a knee-jerk reaction to a single event.
Let's break down the ingredients that go into this calculation.
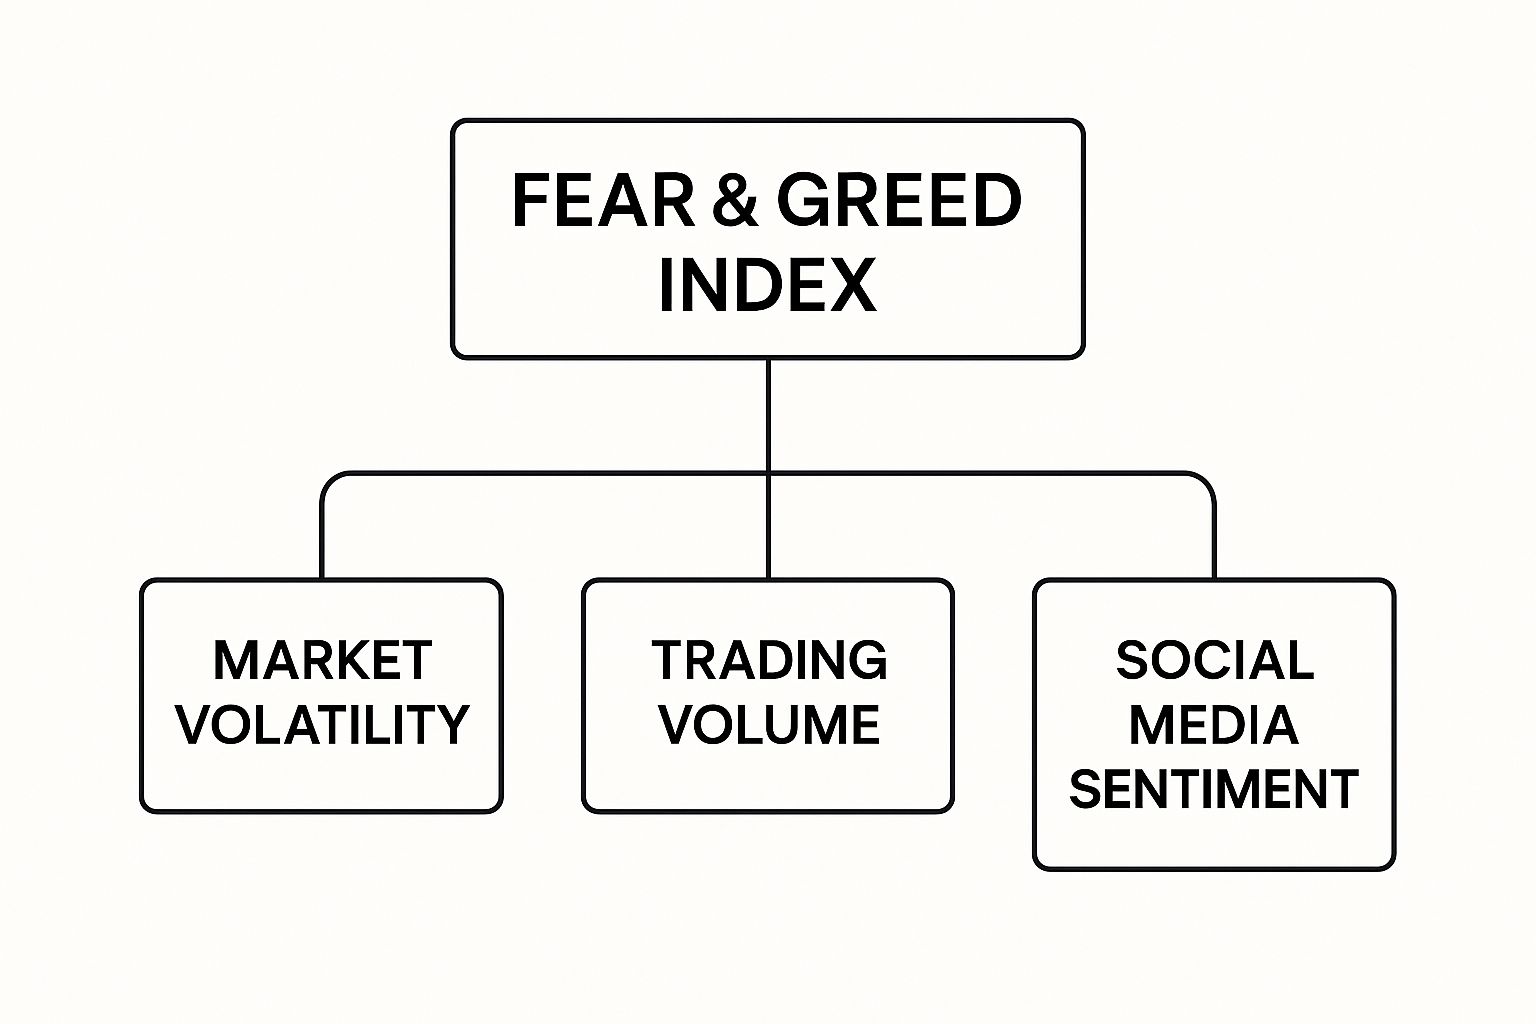
As you can see, factors like market volatility, trading volume, and social media buzz are all critical inputs that help shape the final Fear & Greed Index score.
The Key Data Components
The index's real strength lies in its diverse mix of data. It pulls from quantitative market factors and more qualitative social sentiment to generate a score that truly reflects what investors are thinking and feeling.
Here’s a look at the core components and how much they influence the final number:
- Market Volatility (25% Weight): Volatility measures how much Bitcoin's current price swings compared to its 30-day and 90-day averages. A sudden spike in volatility is a classic sign of a fearful market, as traders often panic-sell when prices get choppy.
- Market Momentum & Volume (25% Weight): This looks at current trading volume and momentum against the same 30- and 90-day averages. When a rally is backed by huge buying volume, it’s a tell-tale sign of a greedy market where everyone is rushing to get in.
- Social Media Sentiment (15% Weight): The index scours platforms like X (formerly Twitter) for chatter about different cryptocurrencies. It analyzes the volume of hashtags and interactions. A surge in positive posts and engagement is often linked to growing greed and FOMO.
- Surveys (15% Weight - Currently Paused): This component used to involve weekly polls to directly ask investors how they felt about the market. While the original provider, alternative.me, has paused this feature, it was a direct line to the community's pulse.
For a deeper look into putting these signals into practice, check out our trader's guide to the Fear and Greed Index.
The Final Pieces of the Puzzle
To round out the score, two other factors are thrown into the mix, each helping to fine-tune the reading.
- Bitcoin Dominance (10% Weight): This tracks Bitcoin's market share compared to the entire crypto market. When Bitcoin's dominance rises, it often signals fear. Why? Because investors tend to sell off their riskier altcoins and flock to the relative "safety" of Bitcoin. A drop in dominance, however, suggests greed, as people feel confident enough to speculate on smaller coins.
- Google Trends (10% Weight): This component analyzes search data for Bitcoin-related keywords. A spike in searches for negative terms like "Bitcoin price manipulation" points to fear. On the other hand, a rise in searches for "best crypto to buy" indicates growing greed.
By combining these six distinct data sources, the crypto Fear and Greed Index moves beyond simple guesswork. It offers a data-driven window into the market’s collective mind, giving you a much clearer picture of what's really going on.
Interpreting the Index with Real Market Examples
Knowing how the Fear & Greed Index is built is one thing. Seeing it in action during a full-blown market meltdown or a euphoric rally is another entirely. That’s when you see the real power of this tool—when you map its readings against actual price charts, the abstract numbers suddenly become actionable insights.
The index essentially tells a story about human psychology. During major market turning points, that story gets incredibly dramatic, offering crystal-clear lessons for any trader who’s paying attention. Let's dig into a couple of real-world moments to see how you can translate its wisdom into strategy.
Case Study One: The COVID-19 Crash of March 2020
The global market panic in March 2020, kicked off by the COVID-19 pandemic, was a perfect storm of fear. As traditional markets nose-dived, the crypto market followed with a spectacular crash of its own. In that chaos, the Fear & Greed Index wasn't just useful; it was an essential barometer of just how terrified everyone was.
On March 12, 2020, as Bitcoin’s price was violently cut nearly in half, the index cratered to a score of just 8 out of 100. This was a textbook signal of Extreme Fear—the kind of gut-wrenching capitulation that happens when investors abandon all hope and just want out at any price. For a contrarian, this wasn't a signal to panic. It was a flashing green light.
This moment perfectly captures the most famous saying in investing:
“Be fearful when others are greedy, and greedy when others are fearful.”
The brave few who dared to be "greedy" when the index screamed maximum fear were rewarded handsomely. The market bottomed out soon after, launching one of the most explosive bull runs in crypto history. It’s a powerful reminder that the point of maximum pessimism is often the point of maximum opportunity.
Case Study Two: The Bull Run Euphoria of Early 2021
Now, let's flip the script and look at the polar opposite. By early 2021, the market mood had done a complete 180. Bitcoin was smashing all-time highs, and every other headline was about overnight crypto millionaires. This widespread, giddy euphoria was captured perfectly by the Fear & Greed Index.
For weeks on end, the index was pinned deep in Extreme Greed territory, frequently clocking scores above 90. This wasn't a signal to FOMO in; it was a blaring warning siren. When you see prolonged periods of extreme greed, it’s often a sign that the market is overheated, driven more by emotion than fundamentals, and dangerously vulnerable to a sharp pullback.
Here’s a breakdown of how that played out:
- The Signal: The index stayed stubbornly above 90 for much of January and February 2021.
- The Market Behavior: Prices kept climbing, but the air was getting thin. The risk of a major reversal was growing by the day.
- The Result: The market finally cracked, leading to a massive correction in May 2021. Traders who took the "Extreme Greed" warning seriously were better prepared to take profits or tighten their stop-losses.
Time and again, the index has shown an uncanny correlation with major market events. For instance, during the March 2020 crash, the index hit rock bottom as Bitcoin, Ethereum, and Litecoin faced huge sell-offs. Conversely, it peaked in February 2021 when Bitcoin’s price surged roughly 400%, a period that overlapped with the "DeFi summer" boom and pure investor mania. You can find more details on how the Fear and Greed Index reflects key market shifts on Cointree.com.
These historical examples prove the index is more than just a reactive number. It’s a powerful narrative tool that provides crucial context, helping you judge whether the market's mood is one of sustainable growth or just irrational exuberance.
Applying the Index to Your Trading Strategy
Knowing the market’s mood is one thing, but turning that knowledge into a real trading edge is where the magic happens. The crypto Fear & Greed Index isn't just a number to glance at; it's a practical tool that can seriously sharpen your entries, exits, and overall risk management.
But let's be clear: it's not a crystal ball.
Think of the index as a co-pilot for your trading journey. You're still the one flying the plane, relying on your own charts and analysis to navigate. The index is your trusted companion, giving you a quick read on the weather—confirming if the skies are clear for takeoff (greed) or if a storm is brewing (fear). Using it alone is like flying blind, but when you pair it with other indicators, you get a much richer, more complete picture of what the market is really doing.
Strategies for Extreme Fear
When the index takes a nosedive into "Extreme Fear" (that's usually a score below 25), it’s a clear sign of widespread panic. People are dumping their bags, and capitulation is in the air. For a contrarian trader, this isn't the time to join the herd and run for the hills. It’s a bright green light to start hunting for bargains.
- Dollar-Cost Averaging (DCA): Extreme fear rarely signals the exact bottom. So instead of trying to perfectly time the market (a fool's errand), use a score below 25 as your cue to start dollar-cost averaging. This just means you invest a set amount of cash at regular intervals, letting you build a position at a great average price as the market potentially grinds lower before it finally turns around.
- Identifying Support Levels: This is where you combine sentiment with technicals. Pull up a price chart and look for major, battle-tested support levels. When the price hits a strong historical support zone and the index is screaming "Extreme Fear," the odds of a bounce or reversal just went way up.
This approach flips market panic on its head, turning it from a threat into a strategic opportunity. It’s the classic "buy when there's blood in the streets" mantra in action.
Strategies for Extreme Greed
Now for the flip side. When the index skyrockets into "Extreme Greed" (typically a score above 75), it means the market is euphoric and likely getting ahead of itself. FOMO is at its peak. While it feels great to see your portfolio pump, this is often a warning sign of an overheated market that's due for a correction. It’s time to manage risk, not chase parabolic moves.
An "Extreme Greed" reading serves as a critical reminder that trees don't grow to the sky. Smart traders use this signal to protect their profits and brace for a potential downturn, rather than getting swept up in the hype.
Here are a few smart moves to make when greed is off the charts:
- Taking Profits: You don't have to sell everything at once. Consider trimming your position to lock in some of those gains. A simple method is to sell in chunks—say, 25% of your position—as long as the index stays in the extreme greed zone.
- Tightening Stop-Losses: Want to let your winners run a bit longer? That's fine, but protect your downside. Move your stop-loss orders up much closer to the current price. This way, if the market suddenly turns on a dime, you’ll walk away with a good chunk of your paper gains intact.
- Portfolio Rebalancing: When one asset goes on a tear, it can quickly become an oversized piece of your portfolio, exposing you to more risk. Use periods of extreme greed to rebalance—sell some of the high-flyer and rotate those profits into more stable assets or just plain old cash.
A Simple Framework for Execution
The best way to avoid making emotional mistakes is to have a clear, repeatable plan. By combining the index with your own analysis, you can build a trading process that keeps you disciplined when things get chaotic.
- Identify the Index Score: First, check the crypto Fear & Greed Index. Is the market fearful, greedy, or neutral? This gives you the emotional context.
- Compare with Your Analysis: Now, layer that sentiment reading over your own technical or fundamental homework. For instance, if the index shows "Extreme Fear" while the Relative Strength Index (RSI) is flashing "oversold," you've got a powerful confluence of signals.
- Execute Based on Confluence: Only pull the trigger when multiple signals align. This "confluence" gives you a much higher-probability trade than just acting on a single indicator.
By integrating the index into a disciplined system, you can navigate the psychological rollercoaster of crypto with more confidence. To take your skills even further, check out our deep dive on how to use market sentiment analysis for trading. This systematic approach is what truly separates the consistently profitable traders from everyone else who is just along for the ride.
Common Pitfalls and How to Avoid Them
While the crypto Fear & Greed Index is a brilliant tool for getting a read on market psychology, treating it like an infallible crystal ball is a recipe for disaster. To really make it work for you, it’s crucial to understand its limitations and the common traps that can snag even seasoned traders. Knowing the pitfalls is just as important as knowing how to read the score itself.
One of the biggest mistakes I see is treating the index as a predictive, forward-looking tool. It's not. The index is fundamentally a lagging indicator. It’s a snapshot of emotions already baked into the market, summarizing what just happened, not what’s coming next.
Think of it like glancing in your rearview mirror. It’s great for seeing the traffic jam you just cleared, but it tells you nothing about the open road or the roadblock around the next bend.
The Problem of Persistent Extremes
A common frustration is when the index gets "stuck" in an extreme zone. The market can simmer in a state of "Extreme Greed" or "Extreme Fear" for weeks, sometimes even months, without a major price reversal. This can easily give you a false signal and seriously test your patience.
For instance, during a monster bull run, the index might be screaming "Extreme Greed" for what feels like an eternity. If you sold your position based on that signal alone, you could miss out on a huge chunk of the upside. The same holds true in reverse during a brutal bear market.
The index shows you the market’s temperature, but it can't tell you how long the fever will last. An "Extreme Greed" reading is a warning sign that things are getting overheated, not a guarantee of an immediate crash.
Trying to use it for pinpoint market timing is a losing game. It’s far better as a guide to help you gradually adjust your risk exposure, rather than making rash, all-or-nothing decisions.
Misinterpreting the Signal’s Scope
Another major pitfall is the index's built-in bias toward Bitcoin. While Bitcoin’s mood is a decent proxy for the market as a whole, it doesn't always capture the unique story of a specific altcoin. An altcoin could be pumping because of project-specific news, even while the broader market is paralyzed with fear.
To avoid this trap, you have to combine the index's reading with asset-specific homework. Here are a few things to keep in mind:
- Black Swan Events: Unforeseen disasters, like a major exchange hack or a sudden regulatory crackdown, will cause instant market moves that the index will only reflect after the damage is done.
- Social Media Manipulation: Coordinated "shill" campaigns on social media or influencer hype can temporarily warp the sentiment data, creating a misleading reading.
- Altcoin Divergence: Never assume the index's score applies perfectly to every coin in your bag. You always have to zoom in and look at the individual asset.
The good news is that modern versions of the index have gotten more sophisticated. Since its early days, the tool has evolved to update sentiment as often as every 15 minutes by crunching data from over 50 different tokens and multiple metrics. It now pulls in data from market volume, volatility, Bitcoin dominance, whale movements, and social media trends, with each factor carefully weighted.
This broader approach helps smooth out some of the risks, but the core limitations are still there. You can explore the latest index methodologies and data on CFGI.io to see how it works today.
At the end of the day, the crypto Fear & Greed Index is a powerful supplement, not a substitute for doing your own research. Use it to add that crucial layer of emotional context to your technical and fundamental analysis. Do that, and you’ll be far better equipped to navigate the market’s wild psychological tides.
Of course. Here is the rewritten section, crafted to sound like an experienced human expert and match the provided writing style.
Common Questions About the Fear & Greed Index
Even after you get the hang of the Crypto Fear & Greed Index, a few questions always pop up. Let's clear up some of the common points of confusion so you can start using the index with more confidence.
How Often Does the Crypto Fear and Greed Index Update?
The main index from alternative.me, which is the one most traders watch, gives us one new reading every day at midnight UTC. This daily snapshot is perfect for swing traders and long-term investors who want to get a feel for the market's mood over the last 24 hours.
You might see other versions that update more often, but honestly, the daily score is usually all you need. Real market sentiment doesn't just flip on a dime from fear to greed without a major news event. For most trading strategies, that single daily number is a consistent and reliable data point to work with.
Can I Use the Fear and Greed Index for Altcoins?
Absolutely, but with a bit of context. The index is heavily influenced by Bitcoin, which actually makes it a great thermometer for the health of the entire crypto market. When the index screams "Extreme Fear," it usually means a market-wide bleed-out that drags down almost everything, including your favorite altcoins.
On the flip side, "Extreme Greed" is often a sign that the whole market is getting a bit too frothy. That said, a single altcoin can always dance to its own beat because of project-specific news, a big partnership, or a game-changing tech update.
Think of the index as your first step: take the market's temperature. Then, zoom in and do your homework on the specific altcoin you're interested in. This way, you see both the forest and the trees.
Is This a Reliable Long-Term Indicator?
Not really, and it wasn't designed to be. The index is a short-to-medium-term sentiment gauge at its core. It's fantastic for spotting potential market tops and bottoms over a few weeks or months. It’s not a crystal ball for predicting where a project will be in five years—that’s what fundamental analysis (digging into tech, team, and tokenomics) is for.
However, smart long-term investors can still use it to their advantage. For instance, a long-term HODLer might set a personal rule to only add to their bags when the index dips into "Extreme Fear." This is a brilliant way to use a short-term signal to find those rare, high-value buying opportunities for a long-haul strategy. It's a tool to sharpen your long-term plan, not replace it.
What Is a Good Score to Buy Crypto?
There’s no magic number that guarantees a perfect entry, but many contrarian traders start getting interested when the index falls into the "Extreme Fear" zone—typically any score below 25. This is a strong signal that pessimism has peaked and the sellers might finally be running out of steam.
Instead of going all-in at once, a smarter move is to use those low scores as a green light to start dollar-cost averaging (DCA). You simply buy smaller, fixed amounts at regular intervals as long as fear grips the market. This helps you manage risk if prices keep sliding and builds you a strong position at a great average cost.
At Fear Greed Tracker, we transform market noise into actionable insight. Our platform offers real-time Fear & Greed scores for over 50,000 assets, helping you gauge market sentiment instantly. Track your favorite stocks and cryptocurrencies, set custom alerts, and make data-driven decisions with confidence. Visit Fear Greed Tracker to start turning market sentiment into your strategic advantage.