
A stock market fear gauge isn’t some physical dial sitting on a Wall Street desk. Instead, it’s a category of tools designed to measure one thing: collective investor emotion. Think of it as the market’s pulse—it races when fear and uncertainty take hold, and it steadies when confidence returns. By learning to read this pulse, you can get a much clearer picture of what’s really going on.
Understanding the Market's Emotional Pulse
At its heart, a stock market fear gauge tries to put a number on something that feels intangible: the overall mood of investors. Is the market gripped by widespread panic? Or is it sliding into irrational greed? These emotional tides are what drive buying and selling, creating the wild swings we see every day. Getting a handle on this sentiment gives you a powerful edge.
Rather than just watching price charts, these gauges dig into underlying data to expose the emotional currents flowing beneath the surface. The two most important ones we’ll cover are the VIX and the CNN Fear & Greed Index. One measures expected volatility, while the other blends seven different factors into a single, easy-to-read score.
To give you a quick overview, here’s a look at how these two key indicators stack up.
Key Stock Market Fear Gauges at a Glance
This table provides a snapshot of the two main fear gauges, what they track, and what their readings typically signal to traders and investors.
| Indicator Name | What It Measures | What High Levels Mean | What Low Levels Mean |
|---|---|---|---|
| VIX (Volatility Index) | The market's expectation of 30-day volatility in the S&P 500. | High fear, uncertainty, and risk aversion. | Low fear, confidence, and market stability. |
| CNN Fear & Greed Index | A composite score based on seven market indicators (e.g., momentum, options). | Extreme Greed, suggesting the market may be overbought. | Extreme Fear, suggesting the market may be oversold. |
While each gauge works differently, they both aim to answer the same fundamental question: Are investors acting out of fear or greed?
Gauging Investor Sentiment
You can think of market sentiment a bit like the weather. A sunny forecast doesn’t mean you’re guaranteed a perfect day, but it helps you know what to expect. In the same way, a fear gauge flashing "Extreme Fear" doesn't automatically mean a crash is coming, but it’s a clear warning that investors are on edge and risk is high.
By tracking the market's collective pulse, you can better understand when fear might be creating buying opportunities or when greed might signal that a pullback is near. It’s about adding context to price movements.
This infographic breaks down the VIX, a primary fear gauge, showing its normal range and how it behaves during major market meltdowns.
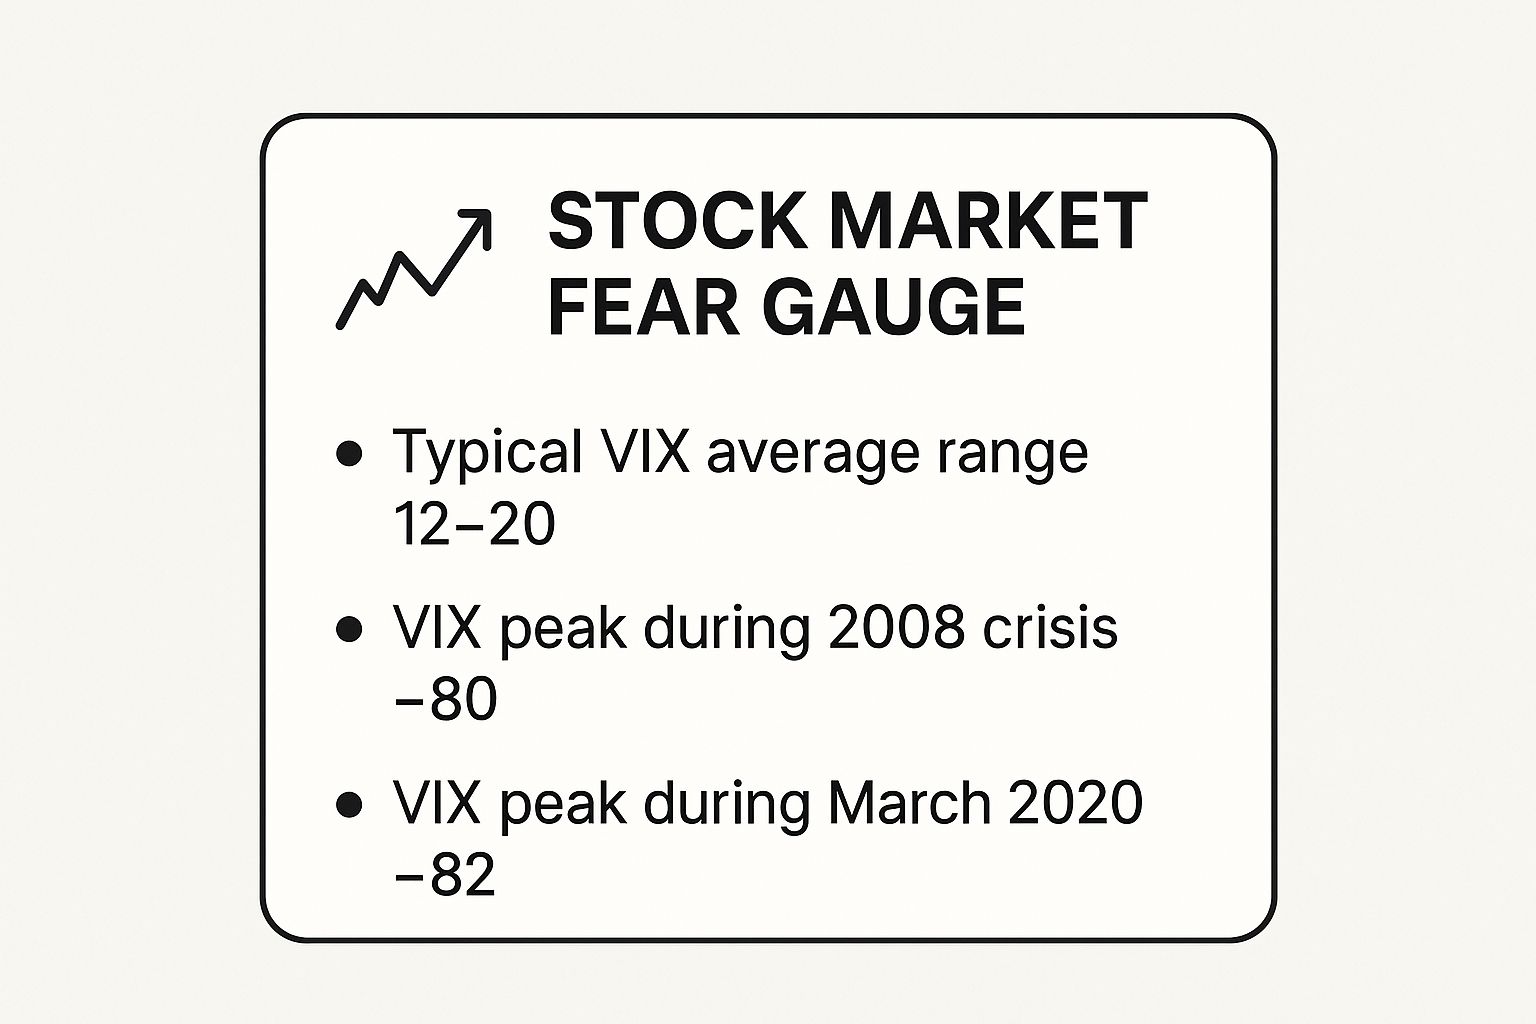
As you can see, fear can spike dramatically. The VIX rocketed to over 80 during both the 2008 financial crisis and the 2020 COVID crash—a world away from its typical calm range below 20. It’s a stark reminder of just how extreme market panic can get.
The VIX as an Insurance Premium on the Market
Imagine you're planning a big outdoor wedding. If the weather forecast is sunny and clear, you probably won't spend money on rain insurance. But if the forecast calls for a hurricane? You’d almost certainly pay a premium to protect your investment.
The CBOE Volatility Index (VIX) works in a surprisingly similar way for the stock market.
The VIX is often called the original stock market fear gauge, but it doesn't actually measure emotions. What it really measures is the expected volatility of the S&P 500 over the next 30 days. Think of it as the market’s insurance premium meter.
When investors expect turbulence—like a looming recession or a geopolitical flare-up—they rush to buy protective options contracts to insure their portfolios. This demand for "insurance" drives up the price of options, which, in turn, makes the VIX climb higher.
On the other hand, when the coast looks clear and the market seems stable, fewer investors feel the need for that protection. Demand for options falls, their prices drop, and the VIX sinks, signaling confidence. This is why the VIX and the stock market usually move in opposite directions. When stocks fall, fear rises, and so does the VIX.
Interpreting VIX Levels
Knowing what different VIX readings mean is key. While it’s more of an art than a perfect science, there are some generally accepted thresholds that give you a good read on the market's mood.
- Below 20: This is the calm zone. It typically signals low fear and a stable market environment. Investors are feeling confident, and not much choppiness is expected.
- 20 to 30: Things are getting a bit tense. A reading here suggests a higher level of uncertainty. Maybe a Fed announcement or some shaky economic data has put investors on edge.
- Above 30: This is red-alert territory. A VIX above 30 signals significant fear and anxiety in the market. It often happens during sharp sell-offs or major crises, showing that investors are scrambling for protection.
Since its creation in 1993, the VIX has given us a solid, quantifiable measure of market sentiment. Its historical average hovers right around 19.39. Spikes way above that level have marked moments of extreme panic, like the 2008 financial crisis and the 2020 pandemic crash. You can find more details about the historical behavior of this key fear gauge, but the main takeaway is simple: higher numbers mean higher expected turbulence.
Here’s a live look at the VIX, straight from its source at the CBOE.
This snapshot isn't just a number; it's the market's current consensus on what the next month of trading might look like.
Beyond a Simple Number
It’s crucial to see the VIX as more than just a number on a screen. It’s a living, breathing reflection of our collective perception of risk.
The VIX doesn't predict the future. It reveals the market's current anxiety about what the next 30 days might hold. A high VIX tells you that investors are actively paying up for protection—a clear signal of fear.
This is what makes the VIX such a powerful tool for not just gauging fear, but also for managing risk. While the VIX focuses purely on expected volatility, other tools like the Fear & Greed Index combine multiple indicators for a much broader perspective. Ultimately, understanding the "insurance premium" concept helps you see the VIX for what it is: not a command to buy or sell, but essential context for making smarter, more informed decisions.
Decoding the Fear and Greed Index
If the VIX is a sharp, focused thermometer for market volatility, then think of the CNN Fear & Greed Index as a full-blown physical exam. It goes way beyond just volatility to give you a much broader picture of the market’s emotional health. This stock market fear gauge is a clever blend of several key data points, all rolled into one simple, easy-to-read score.
The index crunches seven different factors into a single number that runs from 0 (Extreme Fear) to 100 (Extreme Greed). It’s a powerful way to see what's really in the driver's seat—fear or greed. And because it pulls from so many different sources, it can often pick up on shifts that a single indicator might otherwise miss.
So, what’s actually under the hood? Here are the seven components that make up the index:
- Stock Price Momentum: Checks how the S&P 500 is performing against its own 125-day average.
- Stock Price Strength: Compares the number of stocks hitting 52-week highs to those hitting 52-week lows.
- Stock Price Breadth: Looks at the trading volume of stocks that are rising versus those that are falling.
- Put and Call Options: Measures the ratio of bearish put options to bullish call options.
- Junk Bond Demand: Examines the spread between the yields on safe, investment-grade bonds and riskier junk bonds.
- Market Volatility (the VIX): That's right—the VIX itself is one of the seven key ingredients.
- Safe Haven Demand: Compares the performance of stocks against safer investments like Treasury bonds.
By mixing these seven metrics, the index gives you a more complete and nuanced view of how investors are feeling. If you want to really get into the weeds of each component, check out our deep-dive guide on what the Fear & Greed Index is and its key insights.
Using the Index as a Contrarian Signal
One of the best ways to use the Fear & Greed Index is as a contrarian tool. The idea behind this is classic, timeless wisdom, perfectly captured by Warren Buffett: "Be fearful when others are greedy and greedy when others are fearful."
The index helps you actually quantify these emotional extremes. When the dial swings hard into 'Extreme Fear,' it’s a sign of widespread panic and capitulation. For a smart, long-term investor, this can be a huge green light—a signal that quality assets might be on sale.
On the flip side, a reading of 'Extreme Greed' tells you that investors are getting a little too happy and complacent. It's a warning that prices may be pushed to unsustainable heights, and the market could be ripe for a pullback. It’s your cue to be extra cautious when everyone else is breaking out the champagne.
Here’s what the index looks like in action. It gives you a clear, at-a-glance read on the market's current emotional state.
The dial instantly shows you where sentiment is today, last week, and even a year ago, giving you powerful context. What’s fascinating is that historically, the market has spent almost equal time in states of fear (about 41%) and greed (about 42%), with the average score hovering right around 49.09. This balance really highlights the cyclical nature of market emotions, swinging back and forth between the two poles over time.
How to Use Fear Gauges in Your Trading Strategy
Alright, so you understand what a stock market fear gauge is. That's the first step. But the real magic happens when you move from just knowing what it is to actually using it to make smarter, more calculated decisions.
Let's be clear: these indicators are not crystal balls. They won’t perfectly predict every market top and bottom. Think of them more like a seasoned co-pilot, giving you critical context about the market's mood and helping you manage risk when things get turbulent.
The key is to match your approach to your own trading style. A long-term, buy-and-hold investor will look at these gauges very differently than a nimble, short-term trader. Both can find tremendous value, but their reactions to the signals will be miles apart.
A Strategy for Long-Term Investors
If you're in it for the long haul, fear gauges become your best contrarian friend. It all comes back to that classic advice from Warren Buffett: be "greedy when others are fearful." When you see a fear gauge flashing extreme panic, it can be a fantastic sign that high-quality, solid companies are being unfairly thrown out with the bathwater.
When the Fear & Greed Index plunges into 'Extreme Fear,' it means the market is in a full-blown panic. This is often the prime hunting ground for disciplined, long-term investors to find great businesses that have been beaten down by pure emotion.
Instead of hitting the panic button yourself, you can use these moments to start building your shopping list. The goal isn't to nail the absolute bottom—that's a fool's errand. It's about starting to accumulate shares in great companies at bargain prices that you likely won't see again once the market's confidence returns.
A Strategy for Active Traders
For active traders, the game is completely different. You're using fear gauges for tactical moves—managing risk, spotting short-term opportunities, and protecting your capital. A sudden, sharp spike in the VIX isn't a buying opportunity; it's a blaring alarm bell to check your portfolio's defenses.
Here's how a trader might react to a surge in volatility:
- Hedging Positions: If the VIX suddenly jumps above 30, it’s a clear signal that Wall Street expects major turbulence ahead. A savvy trader might buy protective put options to act as insurance against a sharp drop in their stock holdings.
- Reducing Exposure: On the flip side, if the Fear & Greed Index creeps into 'Extreme Greed,' it might be time to trim some winning positions. Taking profits off the table before a potential reversal is just smart risk management.
- Speculating on Volatility: More advanced traders will even trade VIX-related products directly, essentially betting on whether the fear itself will rise or fall. A VIX screaming past 35 points to an unsustainable level of panic that could snap back just as quickly, creating its own trading opportunity.
These kinds of tactical moves require a solid grasp of market dynamics. For a deeper dive into these techniques, you can learn more about how to use market sentiment analysis for trading in our comprehensive guide.
Ultimately, these gauges provide the context you need to stop reacting emotionally and start responding strategically to the market's ever-changing mood.
Why the Speed of Change in Market Fear Matters
While looking at a high or low number on a stock market fear gauge gives you a useful snapshot, experienced traders know the real story is often in the momentum. It’s not just what the fear level is, but how fast it’s getting there. The rate of change can give you some powerful clues about where the market is headed next.
Think of it like checking the weather. A forecast of 90 degrees just tells you it's hot. But knowing the temperature is dropping 10 degrees an hour tells you a massive cold front is blowing in. That's a much more urgent and actionable piece of information.
The same idea applies to the market. A sudden, sharp spike in the VIX can be a massive warning sign of a downturn, showing that panic is spreading like wildfire. It’s not just that investors are nervous; they're actively rushing for the exits. This rapid acceleration of fear is often a far more reliable signal than a VIX that’s just been sitting at a moderately high level for weeks.
When Falling Fear Signals Opportunity
On the flip side, the speed at which fear disappears can be an incredibly strong bullish indicator. When a fear gauge plummets, it’s a sign that the intense, widespread panic is finally breaking. It's more than just a return to business as usual; it's the sound of the entire market breathing a collective sigh of relief.
A perfect example is a historic event where the VIX collapsed from over 40 to below 20 at a record-breaking speed—the fastest drop in the fear gauge's history. Analysts point out that such dramatic drops have historically been powerful green lights for stocks. You can read more about how these striking drops in the fear gauge have preceded stock gains on morningstar.com. It suggests the storm has passed and optimism is rushing back in.
Paying attention to the momentum of fear—not just its level—is a more nuanced approach. A rapid decrease in fear suggests that the worst is likely over, often creating a strong foundation for the next market rally.
By watching the velocity of change, you stop just reacting to the market's current mood. You start anticipating its next move based on how quickly that mood is shifting, and that can give you a significant edge.
Common Mistakes to Avoid When Using Fear Gauges
While a stock market fear gauge is a powerful ally, treating it like a crystal ball is a fast track to costly mistakes. These indicators are meant to provide context—they're not a magical "buy" or "sell" button.
One of the biggest blunders I see traders make is taking a fear gauge reading in a vacuum. Seeing an "Extreme Greed" signal on the Fear & Greed Index doesn't automatically mean you should start shorting the market. If there's a powerful, fundamentally-driven uptrend, fighting it just because one indicator is flashing red is a recipe for disaster.
The same goes for the other side of the coin. Panic-selling every time the VIX ticks up is a great way to wreck your long-term returns. Volatility is just part of the game; not every spike is a warning sign of an impending crash. A smart investor uses these signals to re-evaluate their risk, not to make emotional, knee-jerk reactions.
Misinterpreting a Calm Market
A quiet market can be deceiving, and this is where many investors get tripped up. It’s easy to look at a low VIX and think everything is perfectly safe. That’s a critical—and dangerous—misunderstanding.
A low VIX simply means low expected volatility, not a guarantee of smooth sailing ahead. In fact, long periods of calm often breed complacency, setting the stage for a sharp and sudden correction when no one expects it.
Think of it this way: instead of a green light to invest recklessly, a low VIX is more like a quiet hum that suggests risk might be lurking just beneath the surface.
To use these tools like a pro, steer clear of these common pitfalls:
- Relying on a Single Indicator: Never base a major trade solely on the VIX or the Fear & Greed Index. Always look for confirmation from other sources, like fundamental analysis, technical chart patterns, or broader economic data.
- Ignoring the Trend: The trend is your friend. A fear gauge offers valuable context, but the underlying market trend is still king. Don't try to swim against a strong current based on one sentiment reading.
- Panic-Selling on Fear: When you see "Extreme Fear," that's your cue to start looking for bargains, not to join the herd and sell everything at the bottom. Great opportunities are often born from maximum pessimism.
Frequently Asked Questions About Fear Gauges
Digging into market sentiment tools always brings up good questions. After all, a stock market fear gauge isn't a simple "buy" or "sell" signal—it’s a much more nuanced instrument. Let's tackle some of the most common queries to clear up how these indicators work and how you can actually use them.
Which Is Better: The VIX or the Fear & Greed Index?
This is a classic question, but it’s a bit like asking if a thermometer is better than a full health report. They're both useful, but they do different jobs. One isn't inherently superior to the other; their real power comes from understanding what each one tells you.
The VIX is your "thermometer" for risk. It’s a laser-focused measurement of the market's expectation of S&P 500 volatility over the next 30 days. Think of it as a pure-play on anticipated turbulence, making it perfect for specific risk assessments or hedging strategies.
The Fear & Greed Index is the broader "health report." It blends seven different metrics (including the VIX) into a single score. This gives you a much more comprehensive snapshot of the overall market mood, which is great for sniffing out potential contrarian opportunities.
The takeaway? Use the VIX for its sharp, surgical precision and the Fear & Greed Index for its wide-angle view of market psychology.
Can a Fear Gauge Predict a Market Crash?
In a word, no. It’s a huge mistake to treat a fear gauge like a crystal ball. These tools are what we call concurrent or lagging indicators, which means they reflect fear that is already baked into the market.
A sky-high VIX reading or an "Extreme Fear" signal on the index means investors are nervous right now. While that anxiety often goes hand-in-hand with a market drop, it doesn't guarantee a future crash is coming. It’s a risk meter, not a fortune-telling machine.
How Often Should I Check the Fear Gauge?
The right answer here depends entirely on your trading or investing style. Checking too often is a recipe for emotional, knee-jerk decisions you'll probably regret.
If you're a long-term investor, a glance once a month or during major market shake-ups is plenty. This helps you spot those rare moments of widespread panic that can create amazing buying opportunities.
On the other hand, if you’re an active swing trader, checking daily makes sense. You’ll need to manage short-term risk and identify moments to hedge your positions. The goal is to be strategic, not obsessive.
Ready to stop reacting to market noise and start making strategic, data-driven decisions? Fear Greed Tracker offers real-time sentiment analysis on over 50,000 assets, empowering you to see fear as an opportunity. Explore live market sentiment today!