
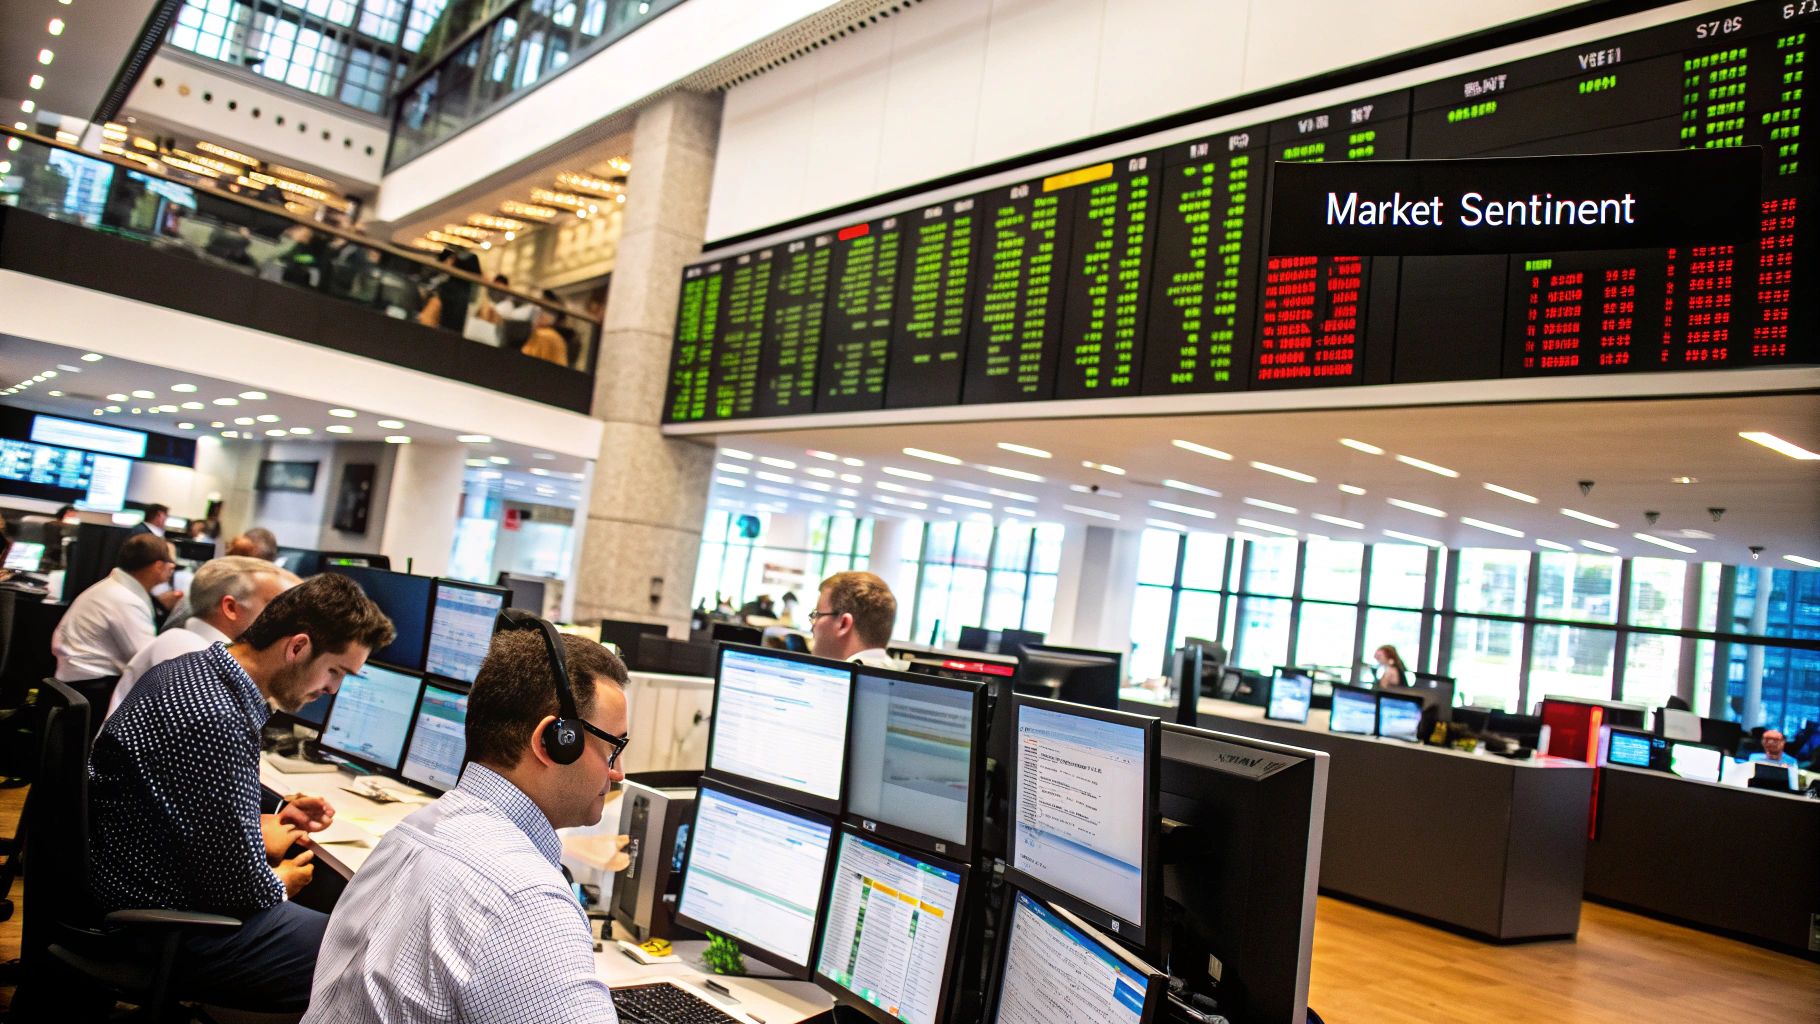
At its heart, the Fear & Greed Index boils down complex, often chaotic market emotions into a single, digestible score from 0 to 100. It measures the two primal forces that so often drive investor decisions: fear and greed. Think of it as a weather vane for market sentiment, showing you whether the crowd is acting on cool-headed analysis or pure emotional impulse.
Decoding Market Psychology
The index is fundamentally a contrarian indicator. This means its real power comes from showing you when to consider moving against the herd.
It’s a bit like seeing a line snaking around the block for a new restaurant—you might assume the food is incredible. On the flip side, if a once-popular spot is suddenly empty, you’d probably wonder if something’s wrong. The index applies that same logic to the financial markets.
The primary goal of the index is to quantify whether investors are acting too bearishly (fearful) or too bullishly (greedy). This psychological snapshot can reveal when assets might be unfairly priced due to collective emotional reactions rather than fundamental value.
The scale is simple: 0 means "Extreme Fear," and 100 signals "Extreme Greed." A low score points to widespread panic and potential overselling, creating what could be a great buying opportunity. A high score suggests irrational exuberance is taking over, a classic sign of a potential market bubble.
For a closer look at how these dynamics play out, you can explore our guide on the Fear and Greed Index for the stock market.
The Power of Contrarian Thinking
The logic here is rooted in a timeless market principle: extremes create opportunities.
- When there's Extreme Fear (Low Score): Investors are dumping assets, often indiscriminately. Prices can get pushed well below their actual worth. For the level-headed investor who has done their homework, this can be a five-finger discount.
- When there's Extreme Greed (High Score): Everyone is piling in, chasing soaring prices. Assets can become dangerously overvalued. This serves as a clear warning that the market might be due for a painful correction once the hype dies down.
To help you get a quick read on the numbers, here's a simple breakdown of what each score range suggests.
Fear & Greed Index Score Interpretation
This table provides a quick reference for understanding what each score range on the Fear & Greed Index signifies about market sentiment.
| Score Range | Sentiment Label | Market Implication |
|---|---|---|
| 0-24 | Extreme Fear | Widespread panic. Investors are selling off assets, potentially creating bargains. |
| 25-49 | Fear | General cautiousness and skepticism. Investors are more risk-averse than usual. |
| 50 | Neutral | The market is balanced, with no strong pull toward fear or greed. |
| 51-74 | Greed | Growing optimism and appetite for risk. Investors are bullish on future returns. |
| 75-100 | Extreme Greed | High levels of euphoria and complacency. The market may be overvalued and due for a pullback. |
Keep this table handy as you watch the index. It's a great tool for putting the daily number into a broader strategic context.
Ultimately, the index isn't a crystal ball. It’s a sophisticated tool that pulls together seven different market indicators—from price momentum to volatility—to generate its final score. By understanding what the Fear & Greed Index is telling you, you gain a powerful lens to see past the daily noise and figure out whether fear or fundamentals are truly in the driver's seat.
The Seven Pillars That Power the Index
The Fear & Greed Index isn't just pulling a number out of thin air. It’s a carefully calibrated instrument that measures what’s really going on in the market through seven distinct pillars. Each component acts like a sensor, picking up on a specific aspect of investor behavior. Together, they create a comprehensive picture of the market's psychological state.
Think of it like a master chef tasting a complex sauce. They don't just register "good" or "bad." They can pick out the salt, the acid, the sweetness, and the spice. The index does the same for the market, breaking down the emotional flavor into its core ingredients to figure out if the overall taste is one of fear or greed.
The infographic below shows how some of these core components, like market momentum and volatility, are central to the final calculation.
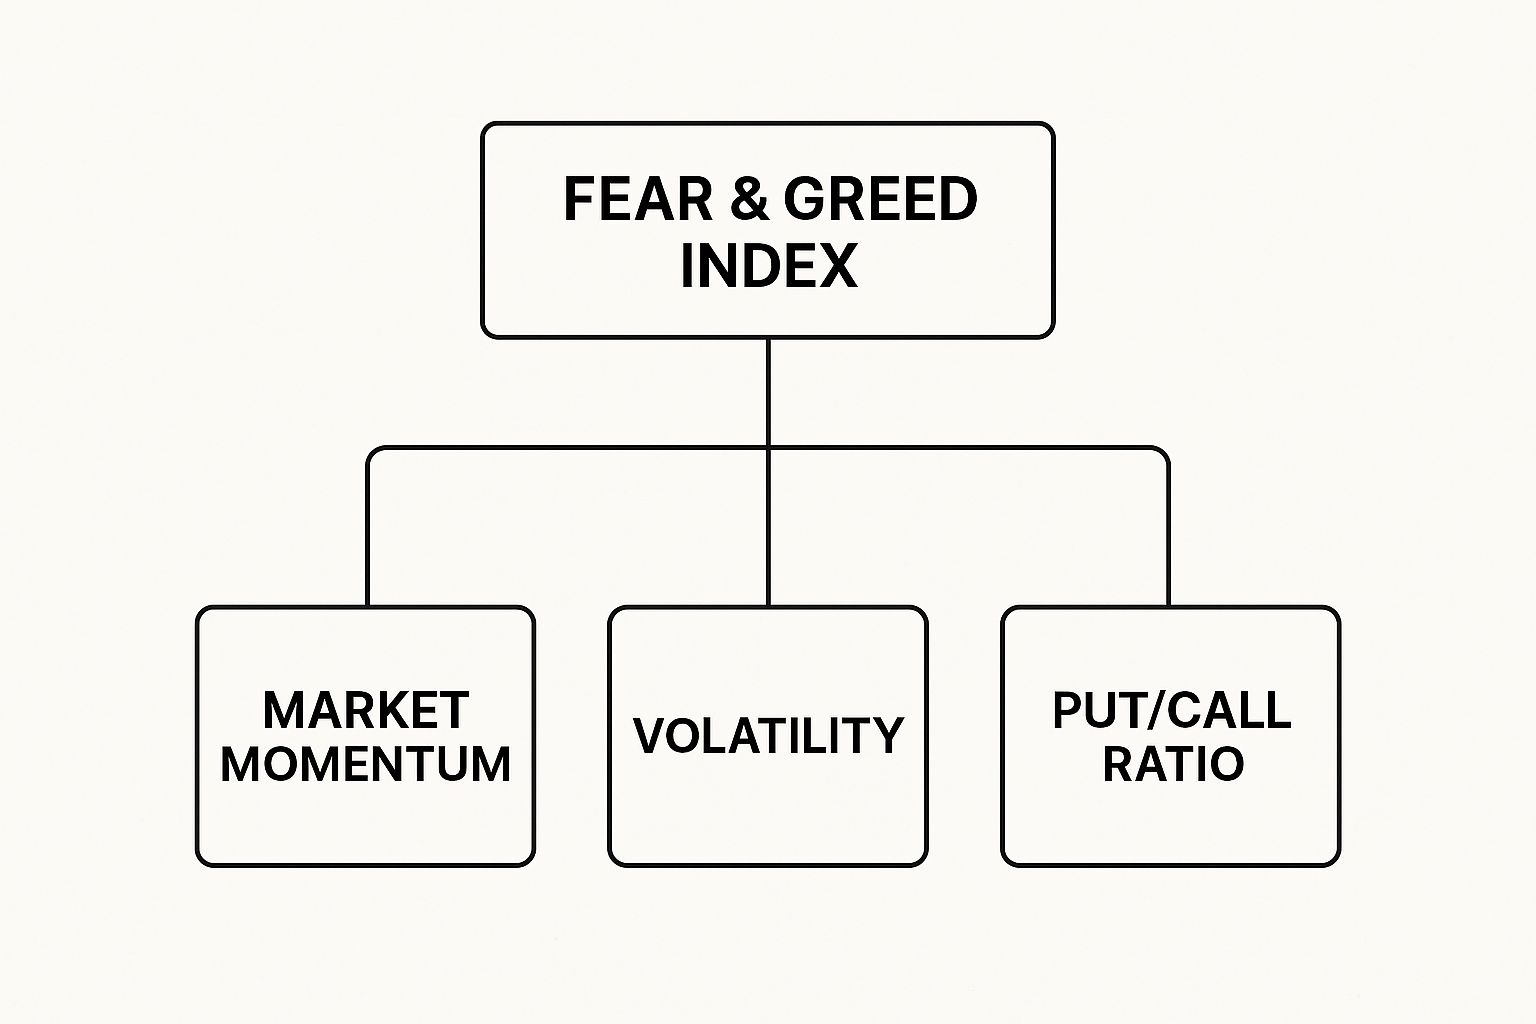
As you can see, the index is a composite tool. Its final score is an equally weighted average of multiple data streams, each capturing a different facet of how the market is behaving. Let's break down each of these seven pillars.
1. Stock Price Momentum
First up is Stock Price Momentum. This indicator simply compares the S&P 500 index to its 125-day moving average. A moving average is great because it smooths out all the daily noise, revealing the bigger, underlying trend.
When the S&P 500 is trading way above this average, it signals powerful positive momentum. That’s a classic sign of Greed, as investors are confidently bidding prices higher and higher. But when the index dips below its long-term average, it points to growing fear and the start of a potential downtrend.
2. Stock Price Strength
Next, we have Stock Price Strength. This pillar keeps a running tally of stocks hitting their 52-week highs versus those slumping to their 52-week lows on the New York Stock Exchange (NYSE).
In a healthy, confident market, you'll see a wide variety of stocks hitting new peaks. If the number of stocks at 52-week highs is outpacing those at 52-week lows, it signals broad-based optimism and nudges the index toward Greed. When the opposite is true—more lows than highs—it’s a warning sign that weakness is spreading, a clear indicator of Fear.
3. Stock Price Breadth
Closely related to strength is Stock Price Breadth. This indicator looks at the trading volume of stocks that are rising compared to the volume of stocks that are falling. It’s asking a simple question: is the buying or selling pressure more intense today?
If the volume behind advancing stocks is much higher than that of declining ones, it tells you that bullish conviction is strong. That’s a greedy signal. If selling volume is dominating, however, it means fear is in the driver's seat as investors rush to dump their positions.
4. Put and Call Options
The options market offers a direct window into what investors are thinking. This pillar measures the ratio of trading volume in put options (bets that prices will fall) to call options (bets that prices will rise).
A higher ratio of puts to calls is a direct measure of investor anxiety. When traders are buying more puts, they are actively hedging against or speculating on a market decline, which is a strong signal of Fear. A lower ratio suggests complacency and optimism, pushing the needle toward Greed.
This is one of the most straightforward indicators of sentiment, as it shows exactly how investors are putting their money to work for future price moves.
5. Junk Bond Demand
How investors feel about risk is a massive piece of the fear and greed puzzle. Junk Bond Demand gets a read on this by looking at the spread—or the difference—between the yields on high-yield "junk" bonds and safer, investment-grade corporate bonds.
- When investors are greedy: They start chasing higher returns and are more than willing to take on extra risk. They pile into junk bonds, which causes the yield spread to narrow. This is a clear greed signal.
- When investors are fearful: They run for the hills, seeking safety. They sell off risky junk bonds and move into more secure assets, causing the yield spread to widen. This signals a "risk-off" mood and a shift toward fear.
Think of it as the market's appetite for spicy food. A narrow spread means investors are confidently ordering the ghost pepper wings, while a wide spread shows they're sticking to a plain salad.
6. Market Volatility
This pillar is all about the Cboe Volatility Index, better known as the VIX. People often call the VIX the market's "fear gauge" because it tracks the expectation of 30-day volatility.
A rising VIX means investors are bracing for bigger price swings, which is almost always tied to uncertainty and Fear. A low, stable VIX, on the other hand, points to a calm, perhaps even complacent market—a hallmark of Greed.
7. Safe Haven Demand
Finally, Safe Haven Demand compares the performance of stocks versus Treasury bonds over the last 20 trading days. In times of stress, investors have a predictable playbook: sell stocks and buy "safe haven" assets like government bonds.
If bonds are outperforming stocks, it shows that investors are more concerned with protecting their capital than growing it. This is a classic defensive move driven by Fear. Conversely, when stocks are crushing bonds, it signals investors are confident and fully embracing risk, a clear sign of Greed.
Of course. Here is the rewritten section, crafted to sound like an experienced human expert and formatted according to your requirements.
How to Read and Interpret the Score
So, you've peeked behind the curtain and seen the seven indicators that power the Fear & Greed Index. That’s the technical part. Now for the fun part—turning that daily score into a story about what’s really driving the market. A raw number is just data, but knowing how to interpret it is what separates the novices from the pros.
The index runs on a simple 0 to 100 scale. Think of it less like a speedometer and more like a thermometer for the market's emotional state. Is it running hot with greed, or is it frozen with fear? Knowing where that needle is pointing is the first step toward developing a sharp, contrarian mindset.
Let’s break down exactly what each zone on the dial is telling you.
Decoding the Score Ranges
The Fear & Greed Index is split into five distinct zones, each painting a picture of the emotional intensity pushing investors around.
0-24 (Extreme Fear): This is where panic lives. Investors are dumping assets, often without a second thought about their real value. For a contrarian, this is a flashing green light. It often means the market has gone too far, creating incredible buying opportunities in solid assets that got caught in the crossfire.
25-49 (Fear): We're not in full-blown panic mode yet, but caution is definitely in the air. Investors are skeptical, risk-averse, and second-guessing every move. This is often the phase where smart money starts quietly accumulating positions while the herd stays on the sidelines.
50 (Neutral): A score of 50 is the market’s equivalent of a shrug. The emotional tug-of-war between fear and greed is at a stalemate. The market isn't being pulled strongly in either direction, so fundamentals and cold, hard data tend to take the wheel.
51-75 (Greed): Optimism is starting to creep in. You can feel the growing appetite for risk as investors start chasing higher returns. Bullish sentiment is taking over, and the fear of yesterday is quickly forgotten.
76-100 (Extreme Greed): Welcome to the land of irrational exuberance. FOMO (Fear Of Missing Out) is the dominant force, and investors are piling into assets, sometimes at wildly inflated prices. Historically, this zone acts as a loud warning bell that the market is stretched thin and might be heading for a correction.
Historical Examples in Action
The real magic of the Fear & Greed Index isn’t theoretical; it’s proven. Its power shines brightest when you look back at how it behaved during major market meltdowns and euphoric peaks.
To really see how the index has signaled major turning points, let’s look at some key historical moments. The table below shows just how accurately extreme readings have coincided with massive market shifts.
Historical Market Events vs Fear & Greed Index Readings
| Market Event | Approximate Index Reading | Associated Sentiment |
|---|---|---|
| 2008 Financial Crisis | 12 | Extreme Fear |
| COVID-19 Crash (March 2020) | 2 - 8 | Extreme Fear |
| Dot-Com Bubble Peak (2000) | Approaching 100 | Extreme Greed |
| Post-COVID Recovery Rally | Consistently in Greed/Extreme Greed | Extreme Greed |
As you can see, the index isn't just a curiosity—it's a historical map of market psychology. The lowest points often marked the moments of maximum opportunity for those who could keep their cool.
For instance, during the 2008 financial crisis, the index bottomed out at a startling 12, perfectly capturing the sheer terror gripping the world. But it got even crazier in March 2020 when the COVID-19 pandemic sent the index plunging to a range between 2 and 8—one of the lowest readings ever. These moments coincided with epic market drawdowns, proving the index’s uncanny ability to signal peak panic. You can explore more details on these historical index readings and their impact.
These historical lows were the "blood in the streets" moments that legendary investors talk about. They were the points where fear was absolute, and those who acted rationally were rewarded with once-in-a-generation buying opportunities.
On the flip side, the index has also flashed red before major tops. Think back to the dot-com bubble in early 2000—sentiment was off the charts. Extreme Greed readings are often the prelude to sharp pullbacks because, eventually, the party has to end. Understanding this history is crucial for knowing what is fear and greed index trying to tell you right now. It helps you recognize the patterns and better prepare for what might be coming next.
Of course. Here is the rewritten section, crafted to sound like it was written by an experienced human expert, following all your specified requirements.
Practical Strategies for Using the Index
Understanding the theory is great, but putting the Fear & Greed Index into action is where you find a real edge. The key isn't just knowing the score, but what that score is telling you about the market's mood right now. This isn’t a magic button; it's about weaving market sentiment into a smarter, more disciplined trading plan.
Whether you're a long-term investor patiently building wealth or an active trader hunting for the next move, the index offers a unique advantage. It helps you see past the daily noise and act with conviction when everyone else is panicking.
A Tool for Long-Term Investors
If you're in it for the long haul, the index isn't about timing day-to-day market jitters. It’s about spotting massive opportunities. Your goal is to buy great assets when they go on sale, and nothing puts things on sale faster than a wave of pure panic.
When the index crashes into "Extreme Fear," it’s a sign that the market is selling everything, good and bad. This is your cue. It’s time to pull up your watchlist and see which high-quality companies have been unfairly dragged down. An "Extreme Fear" reading isn't a command to buy blindly—it's a trigger to start digging.
Here’s a simple framework to follow:
- Build Your Watchlist: Keep a running list of fundamentally solid companies you'd love to own if the price was right.
- Wait for the Signal: When the Fear & Greed Index drops below 25, it's time to start paying very close attention.
- Do Your Homework: Now, start your research. Are the long-term stories for your watchlist stocks still intact? Or has something fundamentally broken? Most of the time, it's just market fear.
- Buy in Tranches: Don't go all-in at once. Consider buying in stages as the fear continues. Markets can stay irrational longer than you can stay solvent, and averaging into a fearful market helps lower your overall cost.
This approach flips the script, turning widespread fear from a threat into your greatest ally. It helps you systematically build positions when everyone else is scrambling for the exits.
A Confirmation Tool for Active Traders
For traders working on shorter timelines, the index plays a different—but just as critical—role. Think of it as a powerful confirmation layer that sits on top of your existing analysis. It helps answer that all-important question: "Is the market's emotion backing my play?"
Imagine your chart analysis points to a potential bottom. If the Fear & Greed Index is also flashing "Extreme Fear," that's a powerful second opinion suggesting that sellers are probably exhausted. That confluence can give you the extra confidence you need to pull the trigger. For a deeper dive into these techniques, our complete trader's guide to the Fear and Greed Index explores more advanced applications.
On the flip side, what if your charts are signaling a breakout, but the index is screaming "Extreme Greed?" That’s a major red flag. It could be a classic "bull trap," fueled by FOMO from latecomers, not genuine market strength. In that scenario, you might hold off, wait for a better entry, or dial back your position size.
The Do's and Don'ts of Using the Index
To use this tool responsibly, you have to know what it can't do. The index is a compass, not a crystal ball.
The Golden Rules:
- DO use extreme readings as a trigger to do more research.
- DON'T ever use the index as your only reason to buy or sell.
- DO combine its signals with your own analysis, whether that's technical, fundamental, or a mix of both.
- DON'T assume an "Extreme Fear" reading means the market will instantly bounce back. Fear can stick around for a while.
- DO use it to keep your own emotions in check and stick to your plan.
By following these simple guidelines, you can make sentiment analysis a core part of your process. It will help you become a more patient investor and a more decisive trader.
Understanding the Crypto Fear and Greed Index
If you think the stock market is driven by emotion, wait until you see crypto. The same forces of fear and greed are at play, but the crypto world cranks the volume to eleven. This is where a dedicated Crypto Fear & Greed Index becomes an indispensable tool, offering a snapshot of the market's collective mood.
The crypto market isn't just volatile; it's a rollercoaster of extreme psychological swings. Two powerful feelings are constantly pulling investors in opposite directions:
- FOMO (Fear Of Missing Out): This is pure, uncut greed. When a coin starts mooning, the fear of being left on the sidelines can trick people into buying at the very peak.
- FUD (Fear, Uncertainty, and Doubt): This is fear on steroids, fueled by social media. A single negative tweet or a poorly sourced rumor can spark a fire sale, pushing investors to dump their holdings at the absolute bottom.
Given how emotionally charged this space is, the Crypto Fear & Greed Index isn't just a nice-to-have. It’s a compass in a hurricane, helping you distinguish between rational market moves and decisions driven by pure hype or panic.
Why The Crypto Index Is A Different Beast
It might share a name with its stock market cousin, but the Crypto Fear & Greed Index is built differently from the ground up. It’s specifically calibrated for the digital asset world, using indicators that actually matter in this unique ecosystem.
The crypto index gives significant weight to data points that traditional finance barely touches. For instance:
- Social Media Chatter: It actively scans platforms like X (formerly Twitter) to gauge the tone of the conversation. Is the community screaming "to the moon," or is the sentiment overwhelmingly bearish?
- Search Engine Trends: It keeps an eye on Google Trends for keywords like “Bitcoin crash” or “buy crypto.” A sudden spike in frantic searches is often a leading indicator of widespread fear.
This unique approach recognizes a fundamental truth: crypto markets are profoundly shaped by online communities and the psychology of individual investors. That makes this index a far more accurate sentiment gauge for this specific asset class.
The Fear and Greed Index has been adapted for cryptocurrencies, where investor emotions are even more pronounced. The Crypto Fear & Greed Index, based on similar principles, gives a score from 0 (Extreme Fear) to 100 (Extreme Greed) for Bitcoin and the broader crypto market. It’s designed to spot behavioral traps like FOMO during bull runs and panic selling during dips.
Think of the crypto index as your reality check. It provides a data-backed view of the market's emotional state, helping you sidestep the most common psychological pitfalls. For anyone looking to put this into practice, check out our in-depth guide to the Fear & Greed Index for the crypto market. By understanding what makes it tick, you’ll get a much clearer sense of when to be cautious and when opportunity might be knocking.
Common Mistakes to Avoid
To really get the most out of any tool, you have to know its limits. The Fear & Greed Index gives you a powerful peek into market psychology, but treating it like a crystal ball is one of the fastest ways to get into trouble. To help you use it wisely, let's walk through some of the most common mistakes I see investors make.
The biggest one? Believing the index can perfectly predict market tops and bottoms. It can’t. Think of it as a barometer for psychological pressure, not a fortune-teller. High greed doesn’t mean a crash is coming tomorrow, and extreme fear doesn’t guarantee an instant rebound.
Believing Extremes Guarantee a Reversal
It's a classic trap: assuming an "Extreme Fear" reading is an automatic "buy" signal. While it often highlights potential opportunities, markets can stay deeply fearful for weeks, even months, pushing prices much lower than you'd expect. The same is true on the flip side with greed.
A famous market saying goes, "The market can stay irrational longer than you can stay solvent." This is the perfect lens through which to view the Fear and Greed Index. An extreme reading is a signal to pay attention, not a command to act blindly.
For example, going all-in the first day the index flashes "Extreme Fear" could mean you're way too early. A much smarter approach is to see it as the start of a potential buying window—a time to dig deeper with your research and maybe scale into a position piece by piece.
Ignoring the Bigger Picture
Another critical error is using the index in a vacuum. It’s a sentiment indicator, and sentiment alone doesn't drive long-term value. A high greed reading might be flashing a warning, but if a company is posting record earnings with a solid growth outlook, the bullish trend might just have legs.
To avoid this pitfall, always pair the index with other types of analysis:
- Fundamental Analysis: Does the company have strong earnings, manageable debt, and a real competitive edge?
- Technical Analysis: Where are the key support and resistance levels? Is the price trend actually confirming what sentiment is suggesting?
Relying only on the Fear & Greed Index is like trying to navigate with a compass but no map. It tells you which direction you're facing, but it won't tell you about the cliffs or mountains ahead. By combining sentiment with fundamental and technical analysis, you get a much more complete, reliable picture of the market and can sidestep some very costly mistakes.
Frequently Asked Questions
As you start using the Fear and Greed Index, you'll probably have a few questions. I've gathered the most common ones here to give you quick, practical answers and help you get a better feel for how this powerful tool really works.
How Often Does the Fear and Greed Index Update?
When it comes to market sentiment, timing is everything. The traditional stock market Fear and Greed Index updates once per day, right after the market closes. This gives you a clean snapshot of where emotions settled after all the day's trading chaos is over.
This daily rhythm is key. It filters out the frantic, minute-to-minute noise of the trading day but is still fresh enough to help you prepare for the next session. It's the daily pulse check every trader needs.
Can the Fear and Greed Index Predict a Market Crash?
This is the big question, and the answer is a hard no. The index is not a crystal ball, and it can't predict a market crash with any certainty.
Think of it more like a risk barometer. When the index is flashing "Extreme Greed," it's like a weather forecaster warning that conditions are perfect for a hurricane. It doesn’t mean a storm is guaranteed to hit, but it screams that the risk is dangerously high and it’s time to double-check your preparations. The index signals probabilities, not certainties.
It’s incredibly useful for flagging when the market is stretched too thin emotionally, making it vulnerable to a sudden drop. That makes it an essential tool for managing your risk.
Is a Low Score Always a Good Time to Buy?
Not quite. A low score, especially one deep in "Extreme Fear" territory, is a signal to start digging for opportunities—not a blind order to buy. It’s a clue that assets are likely being dumped out of panic, not because their fundamentals are suddenly terrible. This is often where you find the best bargains.
But that's just the first step. The real magic happens when you pair a low sentiment score with your own research. You still need to do your homework and confirm the asset is fundamentally sound and wasn’t sold off for a very good reason. A low score gets you in the game, but your own analysis helps you win it.
Which of the Seven Indicators Is Most Important?
This is a bit of a trick question because the index’s real power comes from all seven indicators working together. Each one—from Stock Price Momentum to Safe Haven Demand—shines a light on a different corner of market psychology. If you only looked at one, you'd get a distorted and incomplete picture.
The true strength behind what is fear and greed index analysis is this combined view. It’s the collective weight of these different signals that gives you a balanced and reliable read on the market. A single indicator might be misleading on any given day, but when all seven are pointing in the same direction, the signal is incredibly hard to ignore.
Ready to stop guessing and start measuring market sentiment? Fear Greed Tracker gives you real-time scores for over 50,000 stocks and cryptocurrencies, empowering you to spot opportunities and manage risk with data-driven insights. Get your edge today by visiting https://feargreedtracker.com.