
The double bottom pattern is one of the most reliable bullish reversal signals you’ll find in technical analysis. On a price chart, it looks like a big ‘W’ and tells a clear story: sellers tried to push the price down twice, failed both times, and now the buyers are stepping in with force.
When you see this pattern forming, it’s a powerful clue that a downtrend is running out of gas and a new uptrend is likely just around the corner.
What Is the Double Bottom Pattern and Why It Matters
Think of it like trying to push a beach ball underwater. You shove it down once (the first low), but it pops right back up. Sellers, determined to sink it, try again, pushing it down to roughly the same depth (the second low). But they still can't keep it submerged. The ball doesn't just surface—it shoots up out of the water.
That’s the double bottom in a nutshell.
This pattern is a game-changer because it gives you a visual heads-up that a downtrend is losing its punch. It’s the story of a battle where the sellers are exhausted after two failed attacks. This exhaustion gives buyers the confidence to jump in, often driving the price much higher.
The Core Components of the Pattern
The double bottom chart pattern is defined by two distinct lows that form near the same price level, separated by a peak in the middle. This peak is known as the neckline. It signals that sellers made two separate, unsuccessful attempts to drive prices lower, revealing bearish exhaustion and strong buying pressure.
The classic pattern has two lows that are more or in the same zone, creating a clean ‘W’ shape. However, sometimes the second low might dip slightly below the first or stop just short of it. Both variations still point to a potential trend reversal from bearish to bullish. To see more examples, you can find great insights on the double bottom pattern from Alchemy Markets.
This 'W' shape isn't just a random squiggle; each part tells a specific part of the market's story:
The First Low: This is where the downtrend first hits a wall. Buyers step in and provide enough support to stop the decline, at least temporarily.
The Intervening Peak (Neckline): After the first bounce, the price rallies to a temporary resistance point before sellers manage to push it back down. This peak is critical—it becomes the line in the sand.
The Second Low: Sellers give it one last shot. They try to break below the previous support level but fail again. This failure is a huge red flag for the bears.
The Breakout: The pattern is officially confirmed only when the price breaks decisively above the neckline. This move signals that buyers have wrestled control from sellers and are ready to run.
To make identifying this pattern even easier, here's a quick breakdown of its key features.
Key Characteristics of a Double Bottom
This table summarizes the essential components that define the double bottom pattern, helping you spot it at a glance.
| Component | Description | What It Signifies |
|---|---|---|
| Prior Downtrend | The pattern must be preceded by a clear downtrend. | It’s a reversal pattern, so it needs a trend to reverse. |
| First Low | The price hits a support level and bounces. | The first sign that selling pressure is weakening. |
| Peak (Neckline) | A temporary rally that forms a peak between the two lows. | Establishes the key resistance level to watch for a breakout. |
| Second Low | The price falls back to the previous support level but fails to break it. | Confirms that buyers are defending the support level. |
| Volume | Volume is often lower on the second low and increases on the breakout. | Shows conviction behind the buying pressure. |
| Breakout | The price moves decisively above the neckline. | The official confirmation that a new uptrend has begun. |
Remembering these components will help you distinguish a true double bottom from just a temporary pause in a downtrend.
Key Takeaway: A double bottom is more than a shape; it's a story of failed selling pressure. The inability to forge a new low on the second attempt is the most critical piece of information you can get from it.
Why This Pattern Is a Trader’s Ally
Spotting a double bottom early gives you a massive edge. It lets you anticipate a trend change instead of just reacting to it after the big move has already happened.
By identifying the support level (the lows) and the neckline, you can map out a clear trading plan. You’ll know exactly where to enter your trade, where to place your stop-loss to manage risk, and where to set logical profit targets. It turns guessing into a structured opportunity, which is the key to consistent success in any market, from stocks to crypto.
The Anatomy of a High-Probability Double Bottom
Not every 'W' shape you see on a chart is a golden ticket. Far from it. Many are just market noise—deceptive little traps waiting for an eager trader to step in. A true, high-probability double bottom pattern has a specific anatomy. It's the set of tells that separates a powerful, tradable setup from a costly fakeout.

Think of it like this: one is a vague sketch, the other is a detailed blueprint. You can't build a solid strategy on a sketch, but you can with a blueprint. Let's break this pattern down, piece by piece, to see what makes a setup strong and reliable.
A Preceding Downtrend Is Non-Negotiable
First thing's first: a double bottom is a bullish reversal pattern. And for something to reverse, it has to be moving in a clear direction to begin with. This means a valid double bottom can only show up after a significant, sustained downtrend. Simple as that.
If you spot a 'W' shape forming in the middle of a choppy, sideways market or, even worse, during an uptrend, it's not a double bottom. It's something else entirely and doesn't have the same predictive muscle. The prior decline provides the essential context; it sets the stage of bearish sentiment that the pattern is about to fight and, hopefully, overturn. This principle is a cornerstone of chart analysis. If you're building your foundation, our guide on technical analysis for beginners is the perfect place to start.
The Two Troughs and The Neckline
The heart of the pattern boils down to three key points: two distinct lows (the troughs) and the peak in between them (the neckline).
The First Low: This is where selling pressure finally eases up, and buyers step in to draw a line in the sand. It establishes the initial support zone.
The Intervening Peak (Neckline): After that first bounce, the price rallies to a temporary ceiling before sellers manage to push it back down. This peak creates the neckline, a critical resistance level that must be broken to confirm the pattern.
The Second Low: The price falls again but, crucially, fails to break below the first low. This second test of support is where the magic happens. It shows that buyers are still there, defending that price level with conviction. Ideally, this second low is right around the same price as the first, but small differences are fine and can sometimes even add strength to the signal.
Key Insight: When sellers fail to push the price to a new low on that second attempt, that’s the real story. It’s a loud-and-clear signal of bearish exhaustion and a potential shift in who's in control of the market.
Volume: The Ultimate Confirmation Tool
Price action tells you what is happening. Volume tells you how much conviction is behind it. In trading, volume is your most reliable friend for confirming a double bottom and dodging those fakeouts.
A classic, high-probability pattern has a very distinct volume signature:
- First Low: Volume is usually high as sellers dump their positions, but it might start to taper off as the low forms.
- Second Low: This is key. Volume should ideally be lower on the second low than on the first. This suggests the sellers are running out of steam. There just isn't enough selling pressure left to drive the price down any further.
- The Breakout: As the price punches through the neckline, you want to see a significant surge in volume. This is the most important volume signal of them all. It’s the confirmation that buyers have stormed the gates with force, providing the fuel needed for a real, sustained move higher.
Without that volume surge on the breakout, the pattern is far more likely to fail. A breakout on low volume is a massive red flag, signaling a lack of genuine buying interest and a high risk of the price collapsing right back down. By carefully studying this anatomy—the prior trend, the troughs, the neckline, and the volume—you can learn to spot a robust double bottom pattern with much greater confidence.
How to Spot Double Bottoms on Real Charts
Theory is one thing, but spotting patterns in the wild, with real money on the line? That's a whole different ball game. This is where a trader truly hones their craft—bridging the gap between a textbook diagram and a live, breathing chart.
Let's move past the abstract and get our hands dirty. We'll walk through how to identify the double bottom pattern as it forms in different markets, from high-flying stocks to the volatile world of crypto.

The goal here is simple: to train your eye. Once you learn the visual cues and the common ways a pattern can twist and turn, you'll start seeing these setups on your own charts. It's about building the confidence to act, no matter the asset or timeframe.
Spotting the "W" in Different Markets
What I love about the double bottom is that it shows up everywhere. The underlying psychology—the tug-of-war between buyers and sellers—leaves the same distinct footprint whether you're looking at Apple (AAPL), EUR/USD, or Bitcoin (BTC).
This pattern marks a major potential shift from a downtrend to an uptrend. In simple terms, you're looking for two failed attempts to push prices lower, followed by a breakout. The pattern is confirmed once the price pushes past the peak that formed between the two lows. You’ll see this structure on daily charts signaling long-term reversals and on hourly charts pointing to shorter-term bounces. You can dig deeper into its prevalence across markets in this detailed guide from Investopedia.
The trick is to zoom out and find that classic 'W' shape forming at the end of a clear downtrend. Don't get lost in the noise of every little price tick; focus on the major swing points that create the overall structure.
Trader's Tip: Practice is everything. Seriously. Open up your favorite chart and just scroll back in time. Hunt for past double bottoms. See for yourself how the price reacted after breaking the neckline. This kind of hands-on analysis builds real, practical confidence.
Common Variations and What They Mean
Let's be honest, markets are messy. They rarely print the picture-perfect patterns you see in books. The double bottom often shows up with slight variations, and learning to read these nuances can tell you a lot about what’s happening under the surface.
Here are a couple of the most common variations you’ll run into:
Adam & Eve Double Bottom: This one is a classic. The first low (Adam) is a sharp, V-shaped drop, showing real panic. The second low (Eve) is much wider and more rounded. That rounded bottom suggests buyers are stepping in more deliberately, absorbing selling pressure before the big move up.
Eve & Adam Double Bottom: Just flip the script. Here, the first low is rounded and slow, followed by a sharp, spiky second low. This can signal a final, desperate push by sellers that gets aggressively rejected by buyers, leading to a powerful reversal.
These aren't just minor details. They’re clues that tell a story about the shift in market sentiment from fear to greed.
The Second Low Anomaly
So, what happens when the two bottoms don't line up perfectly? Good question. This happens all the time and can actually signal an even stronger move.
Second Low is Higher: When the second bottom forms above the first one, it’s a huge tell. It means buyers jumped in earlier and with more conviction, not even letting the price retest the initial low. This is a clear sign of underlying strength and eager demand.
Second Low is Lower: This one can be tricky, but it’s often the most powerful setup. When the second low dips just beneath the first, it’s often designed to trigger all the stop-loss orders from traders who bought at the first bottom. This "stop hunt" or "liquidity grab" shakes out the weak hands right before the price rips higher. A sharp, fast rejection from below that first low is an incredibly bullish signal.
When you learn to spot these subtleties, you stop just looking for a 'W' on a chart. You start reading the market's story, interpreting the subtle power shifts between buyers and sellers that happen right before a major trend takes off.
A Step-by-Step Guide to Trading the Double Bottom
Spotting a double bottom pattern on a chart is a great start, but it's only half the battle. The real skill is turning that observation into a live trade. What separates seasoned traders from novices is a solid plan—one with crystal-clear rules for when to get in, how to manage risk, and where to take profits.
Let's build that plan right now. This is a practical, no-fluff guide to trading the double bottom pattern with confidence, taking you from simply seeing the 'W' to executing a trade.
Step 1: Pinpoint Your Entry Strategy
Once the price breaks through and closes above the neckline, the pattern is confirmed. This is your green light. But how you enter the trade is a crucial decision. Most traders fall into one of two camps, each with its own pros and cons.
The Aggressive Entry (The Breakout): This is for traders who want to get in on the action immediately. You open a long (buy) position as soon as the price smashes decisively through the neckline. The upside? You’re in early and won’t get left behind if the price shoots up like a rocket. The risk, however, is getting caught in a "false breakout"—a tricky move where the price pokes its head above the line only to slump right back down.
The Conservative Entry (The Retest): This method calls for a bit more patience. After the price breaks out, you wait. You watch for it to pull back and "retest" the old neckline, which should now act as a new floor of support. Your entry comes when the price bounces off this level and starts heading up again. This gives you much better confirmation and often a better risk-to-reward setup, but you do run the risk that the price never looks back, leaving you on the sidelines.
There’s no "right" answer here. It all comes down to your personal risk appetite. Aggressive traders jump on the breakout; more cautious ones wait for the retest.
Key Takeaway: A breakout above the neckline is your trigger. It’s the market telling you that buyers have wrestled control from the sellers. Whether you act instantly or wait for a retest, this is the moment that matters.
Step 2: Define Your Risk with a Stop-Loss
Trading without a stop-loss is like driving a car with no brakes. It’s not a matter of if you'll crash, but when. Thankfully, the double bottom pattern gives us a perfectly logical place to put our safety net.
The most common and effective place for your stop-loss order is just below the second low of the 'W'. Think about it—if the price falls below that point, the entire pattern is broken. The critical support level that formed the bullish setup has failed, and your reason for being in the trade is gone.
Placing your stop there gives the trade enough room to wiggle around without exposing your account to a massive hit if you're wrong. It’s a clean, logical exit based on the pattern's own structure.
Step 3: Set a Logical Profit Target
You’re in the trade, your risk is defined, so what’s next? Knowing when to cash out. Guessing or letting your emotions decide when to exit is a surefire way to get inconsistent results. The double bottom, once again, offers a simple and objective way to set a price target.
The chart below shows how volume often behaves during this pattern, giving you extra confirmation.
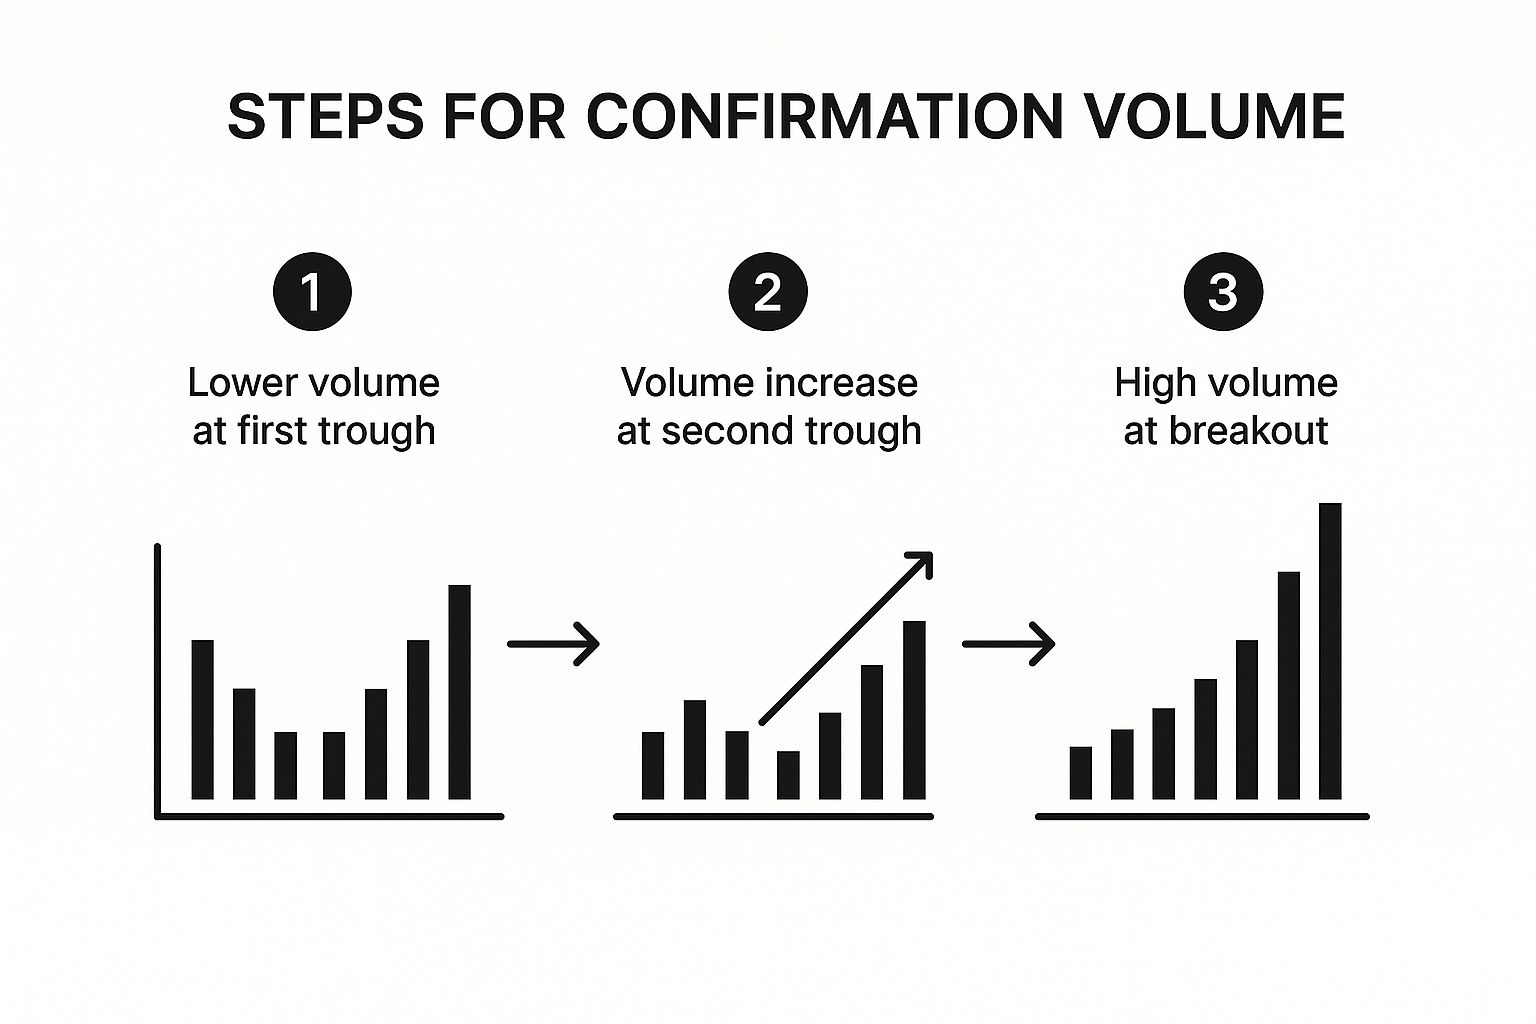
Notice how volume tends to dry up on the second low but surges on the breakout? That's a classic sign of a genuine reversal.
Here’s the simple math for setting your target:
- Measure the Height: Figure out the distance in price from the pattern’s lowest low up to the neckline.
- Project Upward: Take that same height and add it to the neckline’s breakout point.
This projected level becomes your minimum price target. For instance, if a stock hits a low of $95 and has a neckline at $100, the height is $5. Your minimum profit target would be $105 ($100 neckline + $5 height). This simple technique gives you a data-driven goal, helping you stay disciplined and bank a predictable chunk of the move.
Confirming the Pattern with Volume and Indicators

A clean double bottom pattern is a solid signal on its own, but when you back it up with other evidence, it can become an A+ trading setup. By layering on other confirmations, you can filter out the weak signals and trade with much more conviction. It’s the difference between just seeing the pattern and truly understanding the story playing out between buyers and sellers.
Think of it this way: the pattern itself is the "what"—the price action carving out that 'W' shape. Confirmation tools like volume and indicators tell you the "why"—revealing the shifting power dynamic just beneath the surface.
The Critical Role of Trading Volume
Of all the tools you can use, volume is probably the most important one for confirming a double bottom. It’s the fuel behind any price move, and its signature during a real reversal is unmistakable. Trading without looking at volume is like trying to judge a car by its paint job—you can see it moving, but you have no idea how much power is actually under the hood.
A classic, high-probability double bottom tells a specific story with its volume:
- Lower Volume on the Second Low: Ideally, the trading volume on the second dip should be noticeably lower than it was on the first. This is a huge tell. It suggests the sellers are running out of steam and conviction. There just isn't enough selling pressure left to push the price down any further.
- Surge in Volume on the Breakout: This is the moment of truth. As the price breaks decisively above that neckline, you need to see a significant spike in volume. This surge confirms that buyers have finally stepped in with force, giving the move the momentum it needs to actually go somewhere.
A breakout on weak, anemic volume is a major red flag. It often signals a lack of real buying interest and raises the odds of a "false breakout," where the price teases you before falling right back below the neckline.
Key Insight: Volume validates what the price is doing. Low volume on the second trough shows seller exhaustion, while high volume on the breakout shows buyer conviction.
Using Indicators to Spot Bullish Divergence
Beyond volume, technical indicators can add another powerful layer of confirmation, often giving you a heads-up before the breakout even happens. One of the most effective techniques here is spotting bullish divergence with an oscillator like the Relative Strength Index (RSI).
Bullish divergence happens when the price chart makes a new low (or a similar low, like in a double bottom), but your indicator makes a higher low. This disagreement is telling you something important: while the price still looks weak, the underlying momentum is quietly starting to turn positive. It’s a leading signal that the downtrend is losing its grip from the inside out.
The double bottom is one of the most reliable bullish signals out there. One study found that after a confirmed pattern, the average price rise was around 40%, with 68% of the patterns hitting their calculated price target. It also noted the average pattern took about 70 days to form, which shows that patience is key. You can dig into the full findings on double bottom effectiveness to see the statistical breakdown for yourself.
To get an even clearer picture, you can start combining these technical signals with broader market sentiment. For example, knowing whether the market is in a state of extreme fear or greed can give you valuable context for why a pattern is forming. If you want to learn more about that, check out our guide on how to use market sentiment analysis for trading. When you combine the pattern, volume, and indicator divergence, you build a much more compelling case for a trade.
Confirmation Checklist for the Double Bottom Pattern
Before you pull the trigger on a trade, it pays to run through a quick mental checklist. Think of this as your pre-flight inspection to make sure all systems are a "go." It helps you separate the truly strong setups from the ones that just look good on the surface.
| Confirmation Signal | What to Look For | Why It's Important |
|---|---|---|
| Volume on Second Low | Volume should be noticeably lower on the second trough compared to the first. | Shows that sellers are exhausted and running out of momentum. |
| Volume on Breakout | A significant spike in trading volume as the price moves decisively above the neckline. | Confirms that buyers have stepped in with force and conviction, fueling the new uptrend. |
| Bullish Divergence | The indicator (like RSI) forms a higher low while the price forms a similar or lower low. | Signals that underlying momentum is improving even though the price looks weak, often preceding a reversal. |
| Neckline Break | A clear, decisive close above the resistance level (the neckline). A brief poke above doesn't count. | This is the official trigger for the pattern, confirming the shift from a downtrend to an uptrend. |
| Market Sentiment | The pattern forms during a period of Extreme Fear, which often marks a market bottom. | Adds a powerful layer of context, suggesting a potential capitulation point where a reversal is more likely. |
This checklist isn't about finding a perfect pattern—those are rare. It's about building a strong, evidence-based case for your trade. The more boxes you can tick, the higher the probability that the pattern will play out as expected.
Common Questions About the Double Bottom Pattern
Even after you get the hang of what a double bottom looks like, a few tricky questions always seem to pop up. Let’s tackle some of the most common ones head-on so you can feel more confident when you spot this pattern in the wild.
What Is the Difference Between a Double Bottom and a Double Top?
Think of them as mirror images telling opposite stories about the market's mood.
A double bottom is your classic bullish reversal pattern. It shows up after a downtrend, looks like a capital 'W', and hints that prices might be about to head north. It's the market's way of showing that sellers tried to push the price down twice but ran out of steam at the same support level.
On the flip side, a double top is a bearish reversal pattern. You'll find it at the peak of an uptrend, looking like an 'M'. This pattern is a warning sign that prices could be ready to fall, as it shows buyers failed twice to break through a key resistance level.
How Reliable Is This Pattern?
The double bottom is widely seen as one of the more dependable reversal patterns out there, but let’s be clear: no chart pattern is a crystal ball. Its reliability skyrockets when you have other signals backing it up.
Don't just trade the pattern in isolation. Always hunt for confirmation, such as:
- A clear, established downtrend leading into the pattern.
- A significant jump in trading volume right as the price breaks above the neckline.
- Bullish divergence on an oscillator like the Relative Strength Index (RSI), where the indicator makes higher lows while the price makes equal lows.
False signals are a real possibility, which is why solid risk management is non-negotiable. To get this right, our guide on mastering risk management in trading lays out crucial strategies to protect your capital.
Key Reminder: A pattern is about probability, not certainty. Always pair your analysis with a firm stop-loss order to keep potential losses in check.
Can a Double Bottom Appear on Any Timeframe?
Yes, absolutely. The double bottom pattern is what we call fractal. This just means it can form on any chart, whether you're a day trader glued to the one-minute timeframe or a long-term investor looking at weekly charts.
The key difference is the implication. A double bottom on a weekly chart might signal a major trend reversal that could play out over months or even years. But see one on a 5-minute chart? That might just signal a small bounce lasting for the next hour. The trading principles are identical, but the scale of the expected move is always relative to the timeframe you're watching.
At Fear Greed Tracker, we transform complex market sentiment into actionable insights. Track real-time Fear & Greed scores for over 50,000 assets, spot opportunities, and make data-driven decisions with our powerful tools. Visit Fear Greed Tracker to get started.