
Before you can run the numbers, you have to get a feel for what implied volatility (IV) really is. It’s not just some abstract financial term; think of it as the market’s collective gut feeling about a stock's potential for future drama. While a stock's price is a hard number you can see, IV is the hidden variable—it's what tells you how much of a price swing traders are actually betting on.
This single metric is the engine that drives option prices. When fear and uncertainty are running high, IV shoots up, and options get more expensive. On the flip side, when the market is calm and things feel predictable, IV drops, and options become cheaper.
A Forward-Looking Risk Gauge
The big difference between implied and historical volatility is what they’re looking at. Historical volatility is backward-looking—it tells you how much a stock moved in the past. Implied volatility is all about the future.
It gives you a real-time snapshot of the market's consensus on how much an asset’s price will bounce around between now and the option's expiration date. That makes it an absolutely essential tool for sizing up risk.
A high IV isn't random. It’s a clear signal that traders are bracing for something big. It could be anything:
- An upcoming earnings announcement that could surprise everyone.
- A major economic data release, like inflation or jobs numbers.
- The results of a clinical trial for a hot biotech stock.
- Geopolitical events stirring up trouble in a particular sector.
Understanding that context is everything. A sudden spike in IV is a direct reflection of market anxiety or anticipation. This kind of sentiment is often tied to broader market mood swings, which you can dive into in our trader's guide to the Fear and Greed Index.
The Foundation of Modern Volatility Trading
The idea of using IV as a market-wide gauge really took off with the creation of the Cboe Volatility Index (VIX) back in 1993. At first, it was based on S&P 100 options, but a methodology update in 2003 expanded it to a wider range of S&P 500 options, turning it into the "fear gauge" we know today.
Here’s a fascinating bit of history: historical data shows that the S&P 500's actual 30-day volatility has averaged around 15.1%. But the VIX often trades much higher than that. This tells you that the market’s expectation of future chaos frequently outweighs what actually ends up happening. If you're a data geek, you can review decades of VIX data from Cboe yourself.
Key Takeaway: Implied volatility is more than just a number; it’s the price of uncertainty. Learning how to calculate and interpret it transforms you from a passive observer to an active strategist who can quantify risk and spot opportunities driven by market sentiment.
Gathering the Right Data for Your Calculation
When it comes to calculating implied volatility, the quality of your inputs is everything. It's the classic "garbage in, garbage out" scenario, and it's never been more true than here. You need five key pieces of information, and getting them right is the first, most critical step to a result that actually means something.
Think of it like baking. If you grab salt instead of sugar, it doesn't matter how good your technique is—the cake is ruined. It’s the same with IV; even a small error in one input will throw the entire calculation off.
Sourcing Your Key Inputs
Let's walk through the data points you'll need to pull together before you can even think about running a calculation. Precision is the name of the game.
- Current Stock Price (S): This has to be a real-time quote. A price that's even a few minutes old can seriously skew your results, especially with a stock that's moving quickly.
- Option Strike Price (X): This one's easy. It's the fixed price where the option can be exercised, which you'll pull directly from the option chain.
- Time to Expiration (t): This needs to be calculated in years. For an option that expires in 30 days, you'd calculate this as
30 / 365, which comes out to roughly 0.082. - Risk-Free Interest Rate (r): This is where a lot of people get tripped up. The standard practice is to use the yield on a U.S. Treasury Bill that has a maturity date as close as possible to the option's expiration.
- Option Price: This is arguably the most important—and most nuanced—input. Whatever you do, don't just use the last traded price.
Why the Option's Mid-Price Is Better
Using the last traded price of an option is a common mistake. That trade could have happened minutes or even hours ago, making the price completely stale. A far more accurate snapshot of the current market value is the mid-price.
The mid-price is simply the halfway point between the bid (what buyers are willing to pay) and the ask (what sellers are willing to accept). For instance, if an option has a bid of $1.45 and an ask of $1.55, the mid-price is $1.50. This number gives you the most current, fair value consensus at that exact moment.
Pro Tip: Always use the bid-ask midpoint for the option price. It provides a more accurate, real-time value than the last traded price, which is essential for a reliable implied volatility calculation.
This chart from Cboe shows historical volatility data, giving you a clear picture of how much these values can swing over time.

You can see the dramatic spikes in expected market volatility during times of crisis. This is a powerful reminder of why using up-to-the-minute data is so vital for your own calculations. By carefully gathering these five inputs, you're setting yourself up for a calculation that truly reflects what the market is thinking right now.
How Implied Volatility Is Actually Calculated
Here’s the tricky part about implied volatility: there's no simple, direct formula. You can't just plug in a few numbers and get an answer. Instead, we have to work backward from an option's market price, using a pricing model like Black-Scholes to find the one volatility value that spits out that exact price.
This means the calculation is an iterative process—a fancy way of saying it’s a sophisticated "guess and check" loop. A computer makes an initial volatility guess, calculates a theoretical option price, compares it to the real market price, and adjusts its guess over and over until the two prices match.
This visual shows the high-level flow, from gathering the initial data to zeroing in on the final implied volatility figure.
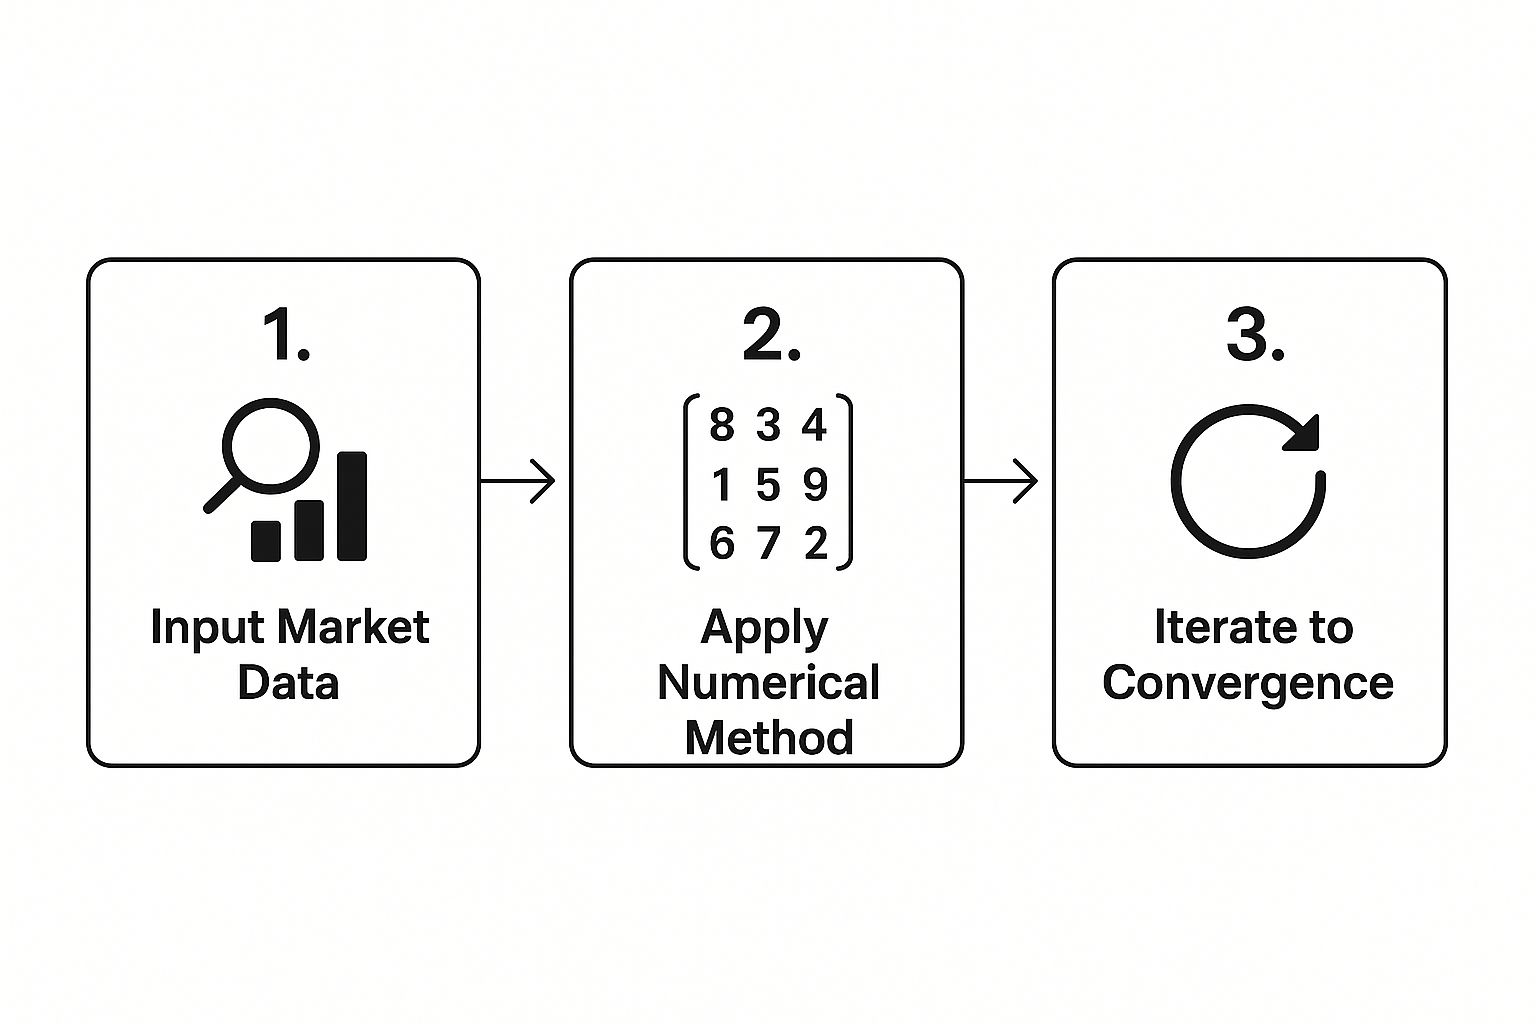
The key takeaway is that calculating IV is a dynamic loop, not a single equation. That's why you need specialized software or your brokerage platform to do it in real-time.
The Bisection Method Explained
One of the most intuitive ways to grasp this is the Bisection Method. Think of it like a guessing game where you're trying to find a specific number between 1 and 100. Your first guess is 50. If the real number is higher, you know the answer is between 51 and 100. Your next guess becomes the new midpoint, 75. You just keep halving the range until you land on the right number.
The Bisection Method for IV works exactly the same way:
- Set a Range: Start with a huge potential IV range, like a low guess of 1% and a high guess of 200%.
- Calculate the Midpoint: The first guess is the middle of this range.
- Compare and Adjust: If the theoretical option price using this guess is too high, the algorithm knows the true IV must be in the lower half of the range. If it's too low, it's in the upper half.
- Repeat: The algorithm keeps narrowing the range and repeating the process, getting closer with each loop until the calculated price is virtually identical to the market price.
While it’s reliable, this method can be slow. It sometimes takes dozens of iterations to converge on the correct value.
Newton-Raphson: A Faster Approach
A more advanced—and much faster—technique is the Newton-Raphson Method. Instead of just guessing the midpoint, this method makes a far more educated guess by using one of the option "Greeks" called Vega.
Vega measures how much an option's price is expected to change for every 1% change in implied volatility. By knowing the Vega, the algorithm can make a much more precise adjustment to its IV guess in each step. It essentially knows by how much it needs to adjust its guess to get closer to the target price, not just which direction to go.
Key Insight: The Newton-Raphson method is the standard for most professional trading platforms because its efficiency is critical. In fast-moving markets, the speed at which you can calculate implied volatility across thousands of options contracts provides a significant analytical edge.
Because it uses this extra piece of information (Vega), the Newton-Raphson method usually finds the correct IV in just a few iterations. This makes it the go-to choice for traders who need real-time, accurate data.
A Real-World Walkthrough: Calculating Implied Volatility
Theory is one thing, but running the numbers is where it all starts to click. Let's walk through a real-world example to see how the Bisection Method actually works to pin down implied volatility. We'll use a hypothetical tech stock to turn these abstract concepts into something you can actually follow.

First things first, we need to pull our data from the market. Let's imagine we're looking at a big tech name, "Innovate Corp." (INVC), and we're interested in one of its call options.
Here are the five key inputs we'll need:
- Underlying Stock Price (S): $175.00
- Option Strike Price (X): $180.00 (This is a slightly out-of-the-money call)
- Option's Market Price: $5.25 (We'll use the midpoint of the bid-ask spread)
- Time to Expiration (t): 45 days, which translates to 0.123 years (45 / 365)
- Risk-Free Rate (r): 5.0% or 0.05 (pulled from a U.S. Treasury Bill with a similar maturity)
With these five pieces of information, we have everything required to start hunting for the implied volatility.
Setting the Initial Volatility Range
The Bisection Method works by starting with a ridiculously wide "guess" for volatility. We don't know the answer yet, but we're pretty confident it's somewhere between a very low number and a very high one. A common practice is to set a lower bound of 1% and an upper bound of 200%.
Our first guess is simply the midpoint of this range: (1% + 200%) / 2 = 100.5%. We take this 100.5% volatility guess and plug it into the Black-Scholes model along with our other four inputs.
Let's say the model kicks out a theoretical option price of $11.50. That’s way higher than the actual market price of $5.25, which immediately tells us our volatility guess was far too high.
Zeroing In on the Answer
Since our calculated price was too high, we now know the correct implied volatility must be in the lower half of our initial range. So, we can throw out the upper half and create a new, narrower range: 1% to 100.5%.
And we just repeat the process. The next guess is the new midpoint: (1% + 100.5%) / 2 = 50.75%. We run this 50.75% through the Black-Scholes model. This time, it gives us a theoretical price of $4.80.
Okay, now we're getting somewhere. This value is lower than the market price of $5.25, meaning our guess of 50.75% was too low. We can now discard the bottom half of our current range.
Our new search range is now 50.75% to 100.5%. The algorithm keeps doing this—halving the range and recalculating—over and over until the theoretical price it generates is practically identical to the market price of $5.25. After several more iterations, it will finally converge on an implied volatility of, say, 54.2%.
The Big Picture: Calculating implied volatility isn't about solving a direct equation. It's an iterative search for the one volatility input that makes a theoretical pricing model match what the market is actually paying for an option.
This process really underscores how much volatility drives an option's premium, and this effect varies across different market segments. For instance, smaller-cap indices almost always have higher implied volatilities than their large-cap counterparts because the market prices in more uncertainty.
The table below gives you a clearer picture of this relationship.
Implied Volatility Differences Across Market Caps
| Index | Typical Realized Volatility | Relative Implied Volatility Premium |
|---|---|---|
| S&P 500 (Large-Cap) | 15-20% | Baseline |
| Russell 2000 (Small-Cap) | 20-25% | Typically 20-30% higher than S&P 500 |
Empirical data backs this up. The Russell 2000's average implied volatility premium for one-month options has been observed to be about 29% higher than for S&P 500 options, reflecting the market's expectation of more risk in smaller stocks. If you want to dig deeper, you can explore more insights on volatility across global equity markets from Cboe.
Getting a handle on an option's implied volatility is a big win, but the number itself is just half the battle. So, you've calculated an IV of 45%. What now?
Without context, that 45% is just a number floating in space. For a sleepy utility stock, a 45% IV could be a five-alarm fire, signaling major panic. But for a biotech company on the verge of clinical trial results, it might just be another Tuesday. This is where the real work—and the real edge—begins.
The goal is to stop just crunching numbers and start making smart decisions. To do that, you have to compare the current IV to its own history. If you skip this step, you’re flying blind. You have no way of knowing if options are genuinely expensive or a bargain compared to how they usually trade.
Using IV Rank and IV Percentile to Find Your Edge
This is where two of my favorite metrics come into play: IV Rank and IV Percentile. They sound almost identical, but they answer slightly different, very important questions.
- IV Rank: This tells you where the current IV sits relative to its highest and lowest points over a set period, usually the past year. An IV Rank of 90% means the current IV is sitting at 90% of its 52-week range. It’s getting close to its max historical level.
- IV Percentile: This one tells you the percentage of days over the past year that the IV was lower than it is right now. So, an IV Percentile of 90% means that on 90% of trading days in the last year, IV was calmer than it is today.
Here’s a simple way to think about it: IV Rank compares today's level to the absolute extremes (the ceiling and the floor). IV Percentile compares it against every single day in the past year. In my experience, most traders find IV Rank a bit more intuitive when they're first starting out.
Pro traders live by these contextual metrics. An IV rank of 80% is a clear signal that implied volatility is higher than it has been on 80% of the days over the last year. That’s a strong indication that option premiums are inflated. You can find more on volatility rankings and their strategic use on MarketChameleon.com.
When you see historically high volatility (say, an IV Rank over 70%), options are considered "expensive." This is prime territory for strategies that involve selling premium, like covered calls or credit spreads.
On the flip side, a rock-bottom IV Rank suggests options are "cheap." This could be a green light for buying options, like calls or puts, because you have a greater potential to profit if volatility decides to wake up and expand. This kind of thinking fits perfectly into a bigger picture of how to use market sentiment analysis for trading.
Common Questions About Implied Volatility
Once you've got the hang of calculating implied volatility, the real-world questions start popping up. It’s one thing to understand the math, but it's another thing entirely to see how it behaves in the wild. Let's dig into some of the most common questions traders have.
Why Do Calls and Puts Have Different IVs?
Ever looked at an option chain and noticed that a call and a put—with the exact same strike and expiration—have different implied volatilities? You're not imagining things.
This is a classic market phenomenon known as the volatility skew, or sometimes the "smile." In the stock market, most traders are far more worried about a sudden crash than they are about an unexpected rocket ship to the moon. That fear creates a lopsided demand for protection.
More traders buy put options as a form of portfolio insurance, which naturally bids up the price of those puts. Since a higher option price leads to higher implied volatility (all else being equal), you'll almost always see out-of-the-money puts with a bigger IV than out-of-the-money calls. The skew is a direct, measurable reflection of the market’s fear of falling.
How Do Earnings Reports Affect Volatility?
Earnings announcements are like a scheduled earthquake for a stock. The uncertainty is massive, and the options market prices that in perfectly. In the days leading up to an earnings release, you'll see traders piling into both calls and puts, betting on a huge move one way or the other.
This flood of demand sends implied volatility soaring. But the moment the earnings numbers hit the wire and the uncertainty vanishes, that inflated IV collapses instantly.
This rapid deflation of an option's premium is what traders call IV crush. It's a brutal but critical concept to grasp. IV crush can wipe out your option's value even if the stock moves in the direction you predicted.
Should I Just Use an Online Calculator?
For your day-to-day trading, absolutely. Nobody is sitting there running the Newton-Raphson method by hand for every trade they consider. Using your brokerage's built-in tools or a trusted online calculator is the only practical way to go.
But—and this is a big but—understanding what’s happening inside the black box is a huge advantage.
When you know the inputs and the logic, you build an intuition for how IV breathes. You’ll be able to spot when a calculator might be using stale data (like an old risk-free rate) and truly appreciate how sentiment is driving the price of an option. This kind of deeper knowledge is invaluable, especially when you start using sentiment analysis for stocks to read market mood and making more sophisticated decisions.
At Fear Greed Tracker, we provide the tools to see beyond the numbers. Our platform translates complex data into clear market sentiment scores, helping you gauge the market's mood and make data-driven decisions. Explore our platform today and start turning market sentiment into your strategic advantage.