
Finding the best stock research tools isn't about finding a single "best" platform—it's about matching the software to your specific game plan. A long-term value investor needs a completely different toolkit than a fast-paced day trader.
Top-tier platforms like Seeking Alpha, Morningstar, and TradingView are designed to help you cut through the noise. They offer a potent mix of fundamental data, killer charting capabilities, and expert insights, turning a flood of market information into clear, actionable intelligence.
Why Bother Finding the Right Stock Research Tool?
Trying to navigate the stock market without the right tools is like trying to sail across the ocean without a compass. It's not brave; it's just a bad idea.
You're constantly bombarded with data—financial statements, earnings call transcripts, breaking news, and economic reports. The sheer volume is enough to overwhelm anyone. The best stock research platforms today are built to tame this chaos, delivering institutional-grade analysis that was once locked away on Wall Street.
And investors are catching on. The market for stock analysis software was already valued at USD 1.2 billion in 2023. It’s projected to explode to USD 3.5 billion by 2032, growing at a blistering 12.5% annually. This isn't just a trend; it's a fundamental shift. Everyday investors now expect powerful analytics and AI-driven insights to guide their decisions. You can dig into the specifics of this growth in this comprehensive report on dataintelo.com.
This guide will give you a simple framework for picking a tool that actually fits your financial goals. We’ll judge the leading platforms on four core principles:
- Data Accuracy and Depth: Is the data reliable and deep enough to trust with your money?
- Analytical Power: How good is it for both fundamental and technical analysis?
- User Experience (UX): Is the interface actually usable, or is it a confusing mess?
- Overall Value: Does the price tag make sense for the features you get?
Just look at the screenshot below. It shows all the different information sources investors are expected to track, from raw market data to dense analyst reports.
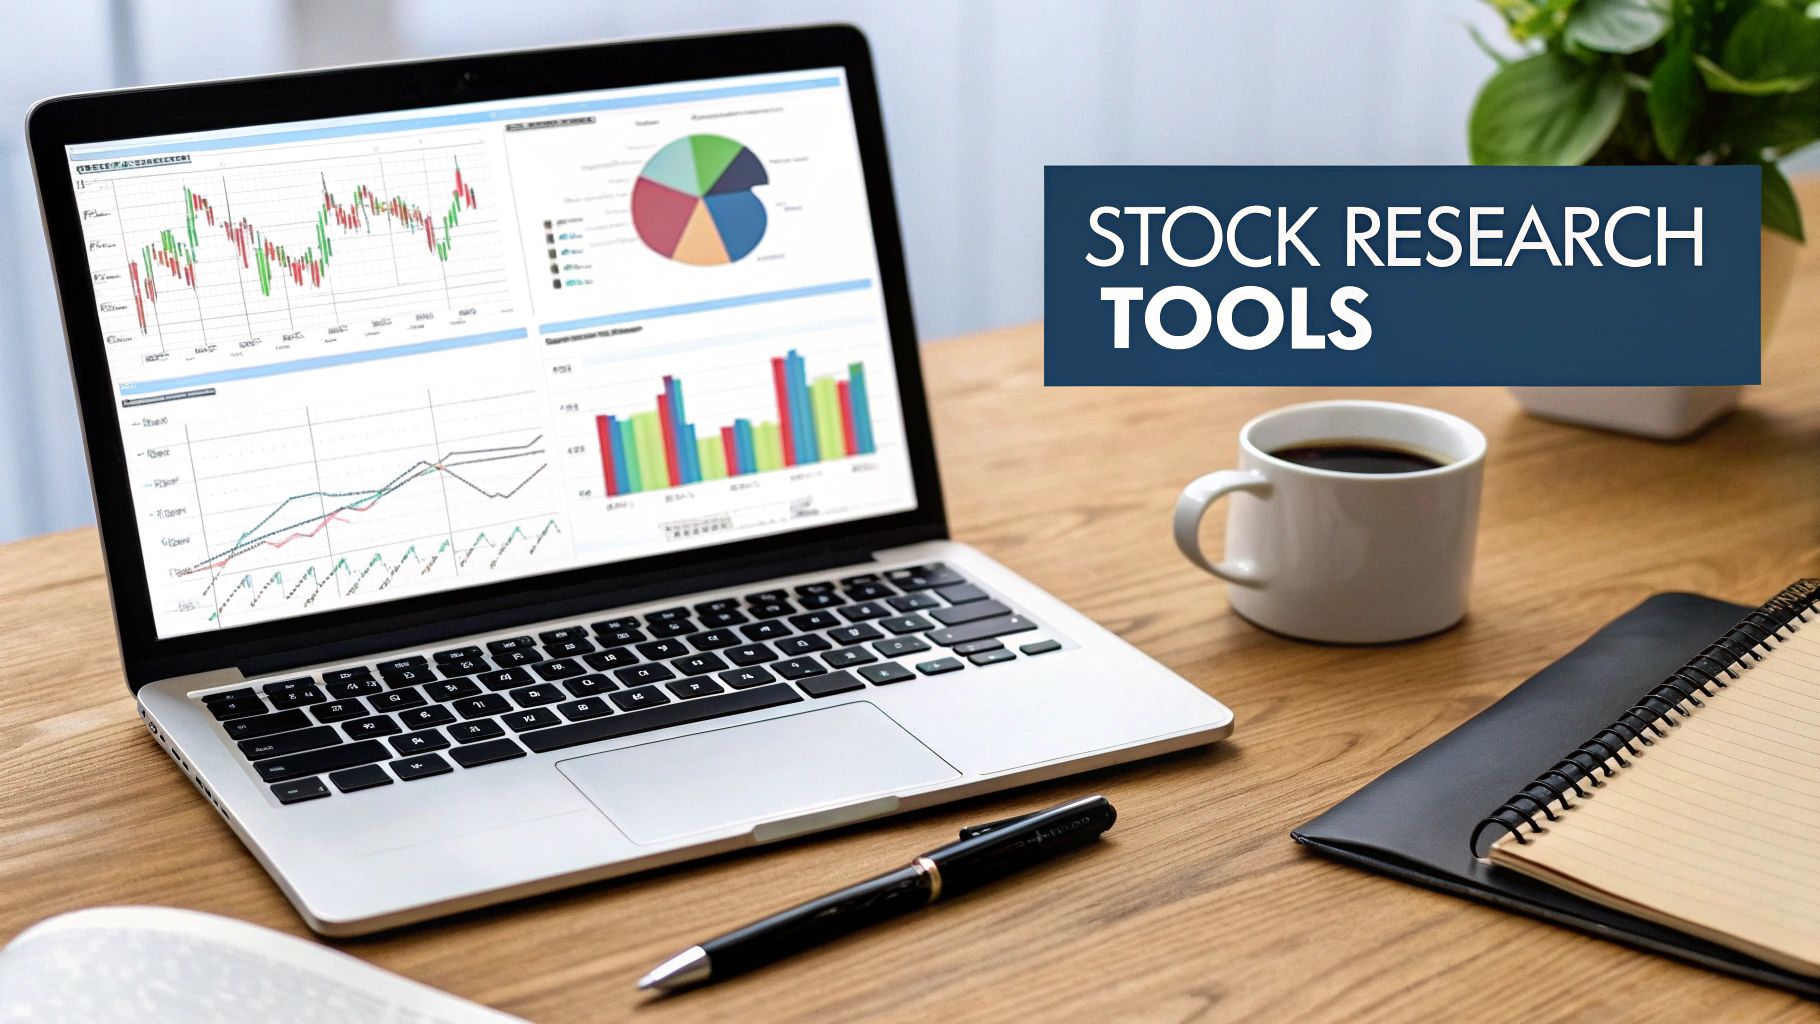
This is the exact problem modern research tools are designed to solve. They bring all of this together in one place. If you keep these criteria in mind, you can confidently pick a platform that does more than just throw data at you—it will actually sharpen your investment strategy.
Core Features Every Top Platform Should Have
Before we jump into a side-by-side comparison, we need to set a baseline. The best stock research tools aren't just data dumps; they're sophisticated platforms designed to sharpen your decision-making. Think of these core features as your non-negotiable checklist when evaluating any service.
A platform’s real power is in its versatility. It needs to support different investment philosophies—whether you’re a value investor digging through balance sheets or a momentum trader glued to price action. Let’s break down what truly matters.
Deep Fundamental Analysis Capabilities
For long-term investors, fundamental analysis is everything. It’s about getting under the hood of a company to figure out what it’s really worth. A top-tier tool makes this process insightful, not a chore.
This goes way beyond looking at a simple P/E ratio. You need instant access to a company's financial history—income statements, balance sheets, and cash flow statements—going back years. The platform must let you dissect this data without getting bogged down.
Here’s what to look for:
- Historical Financial Data: At least 10 years of detailed financials are essential for spotting long-term trends.
- Key Valuation Metrics: Pre-calculated ratios like Price-to-Book (P/B), Debt-to-Equity (D/E), and Free Cash Flow (FCF) yield should be front and center.
- Economic Indicators: Macro data like inflation rates and GDP growth can make or break an investment thesis. You need access to it.
- Analyst Ratings and Estimates: A consolidated view from Wall Street gives you a quick read on market sentiment.
A great platform doesn't just throw numbers at you; it gives you context. It should let you instantly benchmark a company against its direct competitors and the industry average. That’s how you spot the real outliers.
Robust Technical Analysis Tools
If you’re a trader who lives and breathes price action, then technical analysis tools are your bread and butter. A basic line chart just won’t cut it. The best platforms offer a full suite of advanced charting tools that are both powerful and easy to use.
Customization is everything here. You should be able to stack multiple indicators, draw trendlines, and save your preferred chart layouts. And the data feed has to be rock-solid—real-time or near-real-time data is a must for active traders.
A strong technical analysis setup includes:
- Advanced Charting: Multiple chart types (candlestick, bar, Heikin Ashi) with fully customizable timeframes.
- Comprehensive Indicator Library: All the classics, like Moving Averages, RSI, MACD, and Bollinger Bands, should be included.
- Backtesting Capabilities: The ability to test your strategies against historical data is crucial for validating your approach before risking real money.
- Drawing Tools: A complete toolkit for marking up charts with trendlines, Fibonacci retracements, and key support/resistance levels.
To see how different platforms deliver on this, check out our detailed guide on the 12 best technical analysis software picks, where we go much deeper.
Superior User Experience and Workflow
Finally, a platform can have all the features in the world, but if it's a nightmare to use, it’s worthless. A great user experience (UX) is what separates a good tool from a great one. The interface needs to be clean, fast, and intuitive, so you can find what you need without wanting to pull your hair out.
A customizable dashboard is a huge plus. It lets you build a personal command center showing only the stocks, news, and metrics you care about. This is what turns a generic tool into your tool.
Seamless integration with your brokerage account is another game-changer. Being able to execute trades directly from the platform streamlines your entire workflow and lets you act on insights the second you find them. With these benchmarks in mind, you're now ready to properly size up any platform that comes your way.
Comparing the Best Stock Research Tools
Picking the right stock research tool is a personal call. It really boils down to your investing style, what you're trying to achieve, and how you like to consume information. The perfect platform for a long-term value investor will likely feel clunky and overwhelming to a day trader, and vice versa.
This comparison is designed to cut through the marketing fluff and get straight to what matters. We'll look at four of the heavy hitters—Seeking Alpha, Morningstar, Koyfin, and TradingView—through the lens of practical, everyday use, so you can find the best fit for your own workflow.
Feature Comparison of Top Stock Research Tools
To give you a quick overview, this table breaks down how each platform stacks up, who it's built for, and what makes it unique. It's a high-level look to help you orient yourself before we dive into the specifics of each tool.
| Tool | Ideal Investor Profile | Key Fundamental Analysis Features | Key Technical Analysis Features | Unique Differentiator |
|---|---|---|---|---|
| Seeking Alpha | Growth & Value Investors | Earnings call transcripts, analyst ratings, financial statements, Quant Ratings. | Basic charting, momentum grades. | Crowd-sourced articles offering diverse bull/bear theses on individual stocks. |
| Morningstar | Long-Term & "Buy and Hold" Investors | Economic Moat Ratings, Fair Value Estimates, analyst reports, Portfolio X-Ray. | Limited; not its focus. | Proprietary, independent research focused on long-term competitive advantages. |
| Koyfin | Data-Driven & Macro Investors | In-depth financial statement analysis, custom dashboards, valuation charting. | Advanced charting, but secondary to fundamental data visualization. | Institutional-grade data visualization and powerful macroeconomic charting tools. |
| TradingView | Technical Traders & Chartists | Minimal; not its focus. | Advanced charting, 100+ indicators, Pine Script, drawing tools, social sharing. | Unmatched charting capabilities combined with a massive social network for traders. |
Each platform clearly carves out its own niche. Your job is to figure out which one aligns best with your personal investment philosophy and day-to-day research habits.
Seeking Alpha: Best for Crowd-Sourced Analysis and Diverse Viewpoints
Seeking Alpha isn't just a data provider; it's a massive community. Its real power comes from a huge library of user-generated research, giving you bullish, bearish, and neutral takes on thousands of different stocks.
This approach means you get a range of opinions you just won't find anywhere else. For almost any public company, you can find multiple articles digging into earnings, competitive threats, and future potential. It's an incredible resource for pressure-testing your own ideas and spotting risks you might have overlooked.
- Ideal Investor Profile: Growth and value investors who value qualitative insights and want to explore a wide range of investment arguments.
- Key Differentiator: The sheer volume and variety of its contributed articles. It’s like having an army of analysts working for you.
A standout feature is Seeking Alpha's "Quant Ratings." It’s a proprietary algorithm that scores stocks on value, growth, profitability, and momentum. This provides a clean, data-driven counterpoint to the more qualitative, opinion-based articles, creating a nice blend of human and machine analysis.
Of course, the downside to this open model is that the quality of analysis can be a mixed bag. You'll find seasoned pros alongside less experienced investors. It's a platform that rewards a critical eye—you have to vet the author and their reasoning.
Morningstar: Best for Fundamental Research and Long-Term Investors
For decades, Morningstar has been the go-to for meticulous, independent research grounded in long-term, fundamental value. If you’re a "buy and hold" investor who wants to do a deep dive on a company’s financial health and competitive moat, Morningstar is still the gold standard.
The platform shines when it comes to presenting clear, structured data on financial statements, key valuation metrics, and its signature "Economic Moat" ratings. This moat rating is huge—it’s their assessment of how well a company can sustain a competitive advantage over the long haul. Their analyst reports are detailed, giving you a strong narrative backed by hard data.
For investors who care more about quality and safety than chasing speculative trends, Morningstar's conservative, fundamentals-first approach is a perfect fit. And while their premium service is powerful, you can often find great fundamental tools for free; our guide to the best free stock analysis software is a good place to start.
Koyfin: Best for Institutional-Grade Data and Visualizations
Koyfin has made a name for itself by bringing the kind of data and charting tools once reserved for institutional pros to the rest of us. It's often called a "Bloomberg Lite," and for good reason—it delivers a professional-grade feel without the shocking price tag.
Its biggest strength is the ability to create powerful, custom charts and dashboards. You can easily graph a company's revenue growth against its industry peers or compare the performance of a dozen stocks on a single chart. This makes it an absolute beast for quantitative analysis and spotting broad macro trends that impact your portfolio.
- Ideal Investor Profile: Data junkies, financial analysts, and anyone who needs to perform in-depth quantitative or macroeconomic research.
- Key Differentiator: Its incredible charting and data visualization tools, which help you connect the dots between a single company and the wider economy.
Be warned, Koyfin has a bit of a learning curve. The sheer depth of data can feel overwhelming at first. But if you're willing to put in the time, it offers a level of analytical firepower that's tough to find anywhere else without paying for a pricey professional terminal.
TradingView: Best for Technical Analysis and Social Charting
First and foremost, TradingView is all about the charts. It has become the undisputed king for technical traders thanks to its blazing-fast, intuitive, and incredibly powerful charting engine. With hundreds of indicators, advanced drawing tools, and its own scripting language (Pine Script) for building custom tools, it has everything a technician could dream of.
This infographic highlights just how critical speed and customization are for technical platforms.
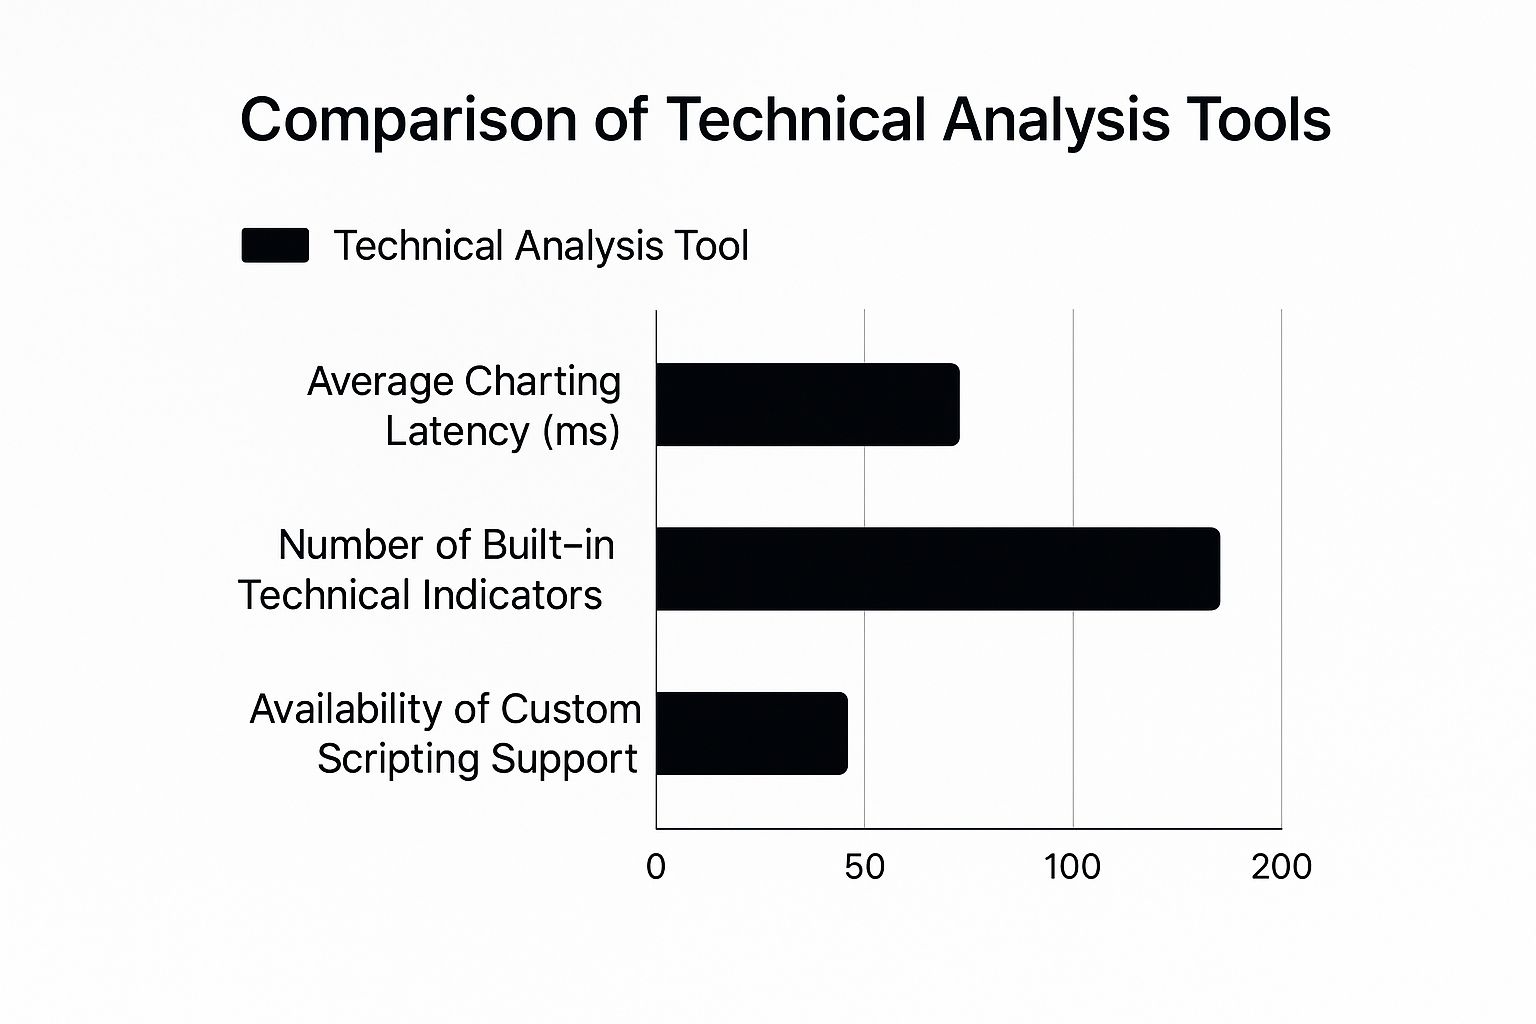
As you can see, platforms built for active traders like TradingView have to prioritize low-latency charting and a massive library of indicators to support quick decision-making.
But what really makes TradingView special is its social side. Traders can publish their chart analysis and trade ideas directly to the platform. This creates a buzzing community where people share strategies and get feedback in real time, turning what's often a solo activity into a collaborative one.
TradingView also plugs directly into dozens of brokers, so you can execute trades right from your charts. That seamless workflow—from analysis to execution—makes it an essential tool for any active trader. If charts drive your strategy, there’s no better platform out there.
How Different Investors Use These Tools

A tool is only as good as the hands that wield it. To bring these comparisons to life, let’s walk through how different investors actually use these platforms in the real world. Seeing them in action will make it much clearer which one is the right fit for your own strategy.
We'll look at three distinct personas: a long-term value investor, a fast-moving swing trader, and a growth-focused portfolio manager. Each one has a completely different goal, timeline, and research style, which means their choice of the best stock research tools will vary dramatically.
The Long-Term Value Investor Workflow
Meet Sarah. She's a classic value investor with a "buy and hold" mindset. Her entire game is finding fantastic, undervalued companies she can stick with for years. She couldn’t care less about day-to-day market chatter; she’s all about deep fundamental analysis and finding businesses with a real competitive edge.
Her go-to platforms are Morningstar Premium and Koyfin.
Here’s how Sarah puts them to work:
Screening for Quality: Sarah starts her hunt in Koyfin. She builds a custom screen to find companies with a market cap over $10 billion, a Debt-to-Equity ratio under 0.5, and a solid track record of free cash flow growth for at least five years. This immediately filters out the junk.
Assessing the Moat: With a shortlist in hand, she pivots to Morningstar. The first thing she looks for is the Economic Moat Rating. She won't even consider a company unless it has a "Wide" or "Narrow" moat, which tells her it has a durable advantage over its rivals.
Valuation and Margin of Safety: Next, she dives into Morningstar's detailed analyst reports to see their Fair Value Estimate. She uses this as a gut check against her own valuation models, looking for stocks trading at a deep discount. That's her margin of safety.
For a value investor like Sarah, deep fundamental data is everything. Tools built for technical charting or social media hype are just noise. Her entire strategy hinges on accurate financials and a solid understanding of a company's long-term business strength.
The Active Swing Trader Workflow
Now, let's look at David. He’s a swing trader trying to catch profits from price movements over a few days or weeks. His decisions are almost entirely driven by technicals, momentum, and what the market is feeling at the moment. He needs real-time data and powerful charts to pinpoint his entries and exits.
David lives inside TradingView Pro+.
Here’s what his process looks like:
Identifying Setups: David kicks off his day using TradingView’s stock screener. He’s hunting for specific technical patterns, like a stock breaking above its 50-day moving average on heavy volume or forming a clean bullish flag.
In-Depth Chart Analysis: Once he has a few promising names, he pulls up their charts. He layers on his favorite indicators—RSI, MACD, and Bollinger Bands—to confirm momentum and spot key support and resistance levels. The platform's drawing tools are crucial for marking up trendlines and Fibonacci levels.
Gauging Market Mood: Before pulling the trigger, David checks the market's pulse. He wants to know if the crowd is with him or against him. To do this, he might use a specialized platform from our guide to the top 10 best sentiment analysis tools to see if sentiment is leaning overly bullish or bearish.
This approach ensures he’s not just blindly trading a pattern; he’s making sure the market’s momentum is at his back.
The Growth-Focused Portfolio Manager Workflow
Finally, there’s Maria. As a portfolio manager, her job is to find high-growth companies in disruptive sectors. She needs a mix of hard numbers to evaluate financial health and qualitative insights to understand the story, the management team, and the competitive landscape.
Maria’s workhorse is Seeking Alpha Pro.
Her research is a blend of fundamental analysis and forward-looking detective work:
Idea Generation: Maria starts by using Seeking Alpha's "Quant Ratings." She filters for stocks with top-tier Growth and Momentum scores, quickly identifying companies that are crushing their industry peers.
Qualitative Due Diligence: For any company that looks interesting, she reads multiple articles from different authors on Seeking Alpha—both the bullish and bearish takes. This gives her a crucial 360-degree view of the investment case and helps her spot risks she might have overlooked.
Listening to Management: One of her most important steps is digging into earnings call transcripts. Seeking Alpha makes them searchable, so she can instantly find what management said about their product roadmap, user growth, or any emerging threats. For a growth investor, these details are gold.
As you can see, the "best" tool is completely situational. The right platform for you is the one that directly plugs into your unique process, whether that means poring over a balance sheet, marking up a chart, or understanding the story behind the numbers.
What's It Really Costing You?
The price tag on a research tool is just the starting point. Let's be honest, the best platforms aren't just expenses—they're investments. They need to pay you back, whether that's in time saved, sharper insights, or a healthier bottom line for your portfolio. Forget the sticker price for a moment and think in terms of a cost-benefit analysis.
You have to look at what you’re actually getting at each pricing level—Free, Basic, or Premium—to find your sweet spot. The goal is to figure out where paying more stops adding real value to your specific strategy. There's a reason everyone is jumping on these platforms.
The market for this kind of software is exploding. It was valued at USD 3.47 billion in 2021 and is projected to hit a staggering USD 11.21 billion by 2031. That’s not just hype; it's a huge shift in how investors make decisions. If you want to dig into the numbers, check out this detailed industry analysis on verifiedmarketresearch.com.
Decoding Pricing Tiers and What’s Hiding in the Fine Print
Most platforms offer a tiered approach, which makes sense. Free plans are perfect for testing the waters, but they’re almost always gated. Expect things like delayed data or a very limited toolbox, which is fine for a casual look but a dealbreaker for anyone serious.
The basic or mid-tier plans are where things get interesting. This is usually where you unlock the core features you need for day-to-day research—real-time data, better screeners, and more technical indicators. For most active retail investors, this is the sweet spot. Premium plans? They're built for the pros or the deeply obsessed, offering things like institutional-grade data, API access, and a direct line to support.
But watch out for the gotchas—the hidden costs that can sneak up on you:
- Real-Time Data Fees: Some platforms advertise a low price but then charge extra for real-time data feeds. For active traders, this isn't optional; it's essential.
- Premium Reports: That exclusive analyst report you need? It might be a separate add-on purchase.
- API Access: If you’re a quant or want to build your own tools, API access is almost always a premium feature with its own pricing.
A tool's real value isn't a long list of features. It's how those features actually fit into your workflow and help you find an edge. A free tool you never open is far more expensive than a paid one that helps you nail a single great trade.
When Is It Time to Pay for a Premium Plan?
So, when does it make sense to upgrade? The moment a lower-tier plan is actively getting in your way. If you find yourself constantly hitting a paywall right when you need a critical piece of data, it’s time to consider it.
A value investor, for instance, would find a premium Morningstar subscription almost non-negotiable. Why? Because their entire thesis might depend on Morningstar’s exclusive Economic Moat and Fair Value estimates. In the same way, a quantitative trader using TradingView would be hamstrung on a basic plan without the backtesting and server-side alerts that come with the higher tiers.
The decision boils down to one question: does the advanced feature solve a real problem in your process? If a premium tool saves you hours of digging for data each week or gives you an insight that helps you dodge a major loss, it pays for itself almost instantly.
Common Questions About Stock Research Tools
Even after you've compared all the features, some practical questions always pop up. It's one thing to look at a checklist, but it's another to know how these tools will actually fit into your investing routine.
Let's clear up a few of the most common concerns investors have before they commit to a platform.
Is the Data in These Tools Accurate?
This is the big one, and the short answer is: mostly, yes. Reputable platforms aren't just pulling numbers out of thin air. They license their data from major providers like S&P Global Market Intelligence or get it straight from exchange feeds and company filings. For core metrics like revenue, earnings, and market cap, you can bet the data is solid.
But here's the catch—sometimes you'll see small differences between platforms, especially with pre-calculated ratios or more obscure metrics. That's usually because they use slightly different formulas. If a huge decision hangs on one specific number, always double-check it against a primary source, like the company's latest SEC filing. The best tools are transparent about where their data comes from.
For the vast majority of investors, the data you get from a top-tier tool is more than reliable enough. Just get into the habit of verifying the absolute must-know numbers before making a major move.
Can These Tools Connect to My Brokerage Account?
Yes, many of them can, but this feature is far from standard. The quality of the connection can also be night and day between platforms.
Some tools are built for it. A platform like TradingView is a prime example—it excels at letting you trade directly from your charts and connects with dozens of popular brokers. It turns your research and your execution into one seamless action.
On the other hand, many platforms focused purely on deep fundamental research, like Morningstar, don't offer brokerage integration at all. Before you sign up, always check the platform's list of supported brokers. For an active trader, finding out your broker isn't supported after you've already paid is a massive headache.
The whole industry is pushing for better integration, but it's a work in progress. As investor demand for seamless, all-in-one solutions grows, companies are racing to keep up. You can read more about these market dynamics on verifiedmarketresearch.com.
Ready to cut through the market noise and understand what investors are really feeling? Fear Greed Tracker provides real-time sentiment scores for over 50,000 assets, giving you a powerful edge. Stop guessing and start making data-driven decisions today at https://feargreedtracker.com.