
Backtesting your trading strategy is the crucial first step before you put any real money on the line. Think of it as a time machine for your trades—it lets you run your ideas against historical market data to see how they would have held up. You get to simulate profits and losses and find the hidden flaws in your system, all without risking a single dollar.
What Backtesting Your Trading Strategy Really Means
At its heart, backtesting is the filter that separates a promising concept from a money pit. You wouldn't build a house without a solid blueprint, right? In the same way, committing capital to an untested strategy is just gambling. This process pulls trading out of the realm of gut feelings and grounds it in data-driven proof.
It’s all about applying your rules to past market data to see what would have happened. You can take a decade of price and volume data, run your strategy, and get a full report of hypothetical results—total profit, maximum drawdown, and a list of every single simulated trade. This is where you can start tweaking things like stop-loss levels or position sizes to see how small changes impact your bottom line.
Properly backtested strategies have been shown to deliver better-than-benchmark returns with lower risk. If you want to dive deeper into the nuts and bolts, you can learn more about historical data analysis for investing on financialmodelingprep.com.
To understand what goes into a good backtest, it helps to break down the key pieces.
Here's a quick look at the essential elements that make up a thorough backtesting process.
Core Components of a Trading Backtest
| Component | What It Is | Real-World Example |
|---|---|---|
| Trading Strategy | The specific set of rules that trigger buy and sell signals. | A moving average crossover system where a "buy" is triggered when the 50-day MA crosses above the 200-day MA. |
| Historical Data | The past price, volume, and other market data your strategy runs on. | Daily open, high, low, and close prices for the S&P 500 from 2010 to 2020. |
| Trade Execution | A simulation of how trades would be opened and closed, including costs. | Assuming a $1.00 commission per trade and a 0.02% slippage on every entry and exit. |
| Performance Metrics | The key numbers that tell you if the strategy was successful or not. | Calculating the Sharpe ratio, maximum drawdown, and total net profit. |
Each of these components is a vital gear in the machine. Miss one, and your results could be completely misleading.
A Practical Example with Moving Averages
Let's make this tangible with a classic: the moving average crossover strategy. This technique uses two moving averages—one short-term and one long-term—to spot potential trend changes.
- The "Golden Cross": A buy signal pops up when the short-term average (like the 50-day) slices above the long-term one (the 200-day). This is often seen as a sign of building upward momentum.
- The "Death Cross": A sell signal triggers when the short-term average drops below the long-term, hinting that a downtrend might be starting.
On paper, it sounds great. But without backtesting, it’s just a theory. By running this against historical data for a stock like Apple (AAPL) or an index like the S&P 500, you get answers to the hard questions. How much money would it have made? What was the biggest losing streak? How many times did it give a false signal that lost money?
Backtesting provides the hard evidence you need to either support or scrap your strategy. In a world driven by data, it offers objective insights into a strategy's potential before you risk a dime.
The Foundation of a Robust Trading System
Ultimately, learning how to backtest is about building confidence and discipline. When you’ve seen your strategy work through bull markets, survive bear markets, and chop through sideways periods, you build the conviction to stick with it during the inevitable drawdowns. It gives your trading a statistical backbone.
This is the "why" behind the "how." In the sections that follow, we'll get into the practical steps—from finding quality data and picking the right tools to analyzing your results. This is your first real step toward becoming a more systematic, less emotional trader.
Sourcing and Preparing High-Quality Historical Data

You’ve probably heard the old programming saying, "garbage in, garbage out." Nowhere is this more true than in backtesting. The quality of your historical data is the absolute foundation of your entire analysis, and rushing this step is a guaranteed way to get misleading results.
Think of your data as the bedrock. If it's cracked, incomplete, or warped, every strategy you build on top of it will be unstable. It might look great on paper, but it's likely to collapse the second it faces live market conditions.
Choosing the Right Data Granularity
The first thing you'll need to decide is the granularity of your data—how often the data points are recorded. This choice will directly shape what kind of strategies you can realistically test. There’s no one-size-fits-all answer; it all comes down to your trading style.
Let's look at the usual suspects:
- Daily Data (EOD): This is your standard open, high, low, and close (OHLC) for each day. It’s ideal for long-term swing or position trading, where the tiny wiggles of intraday price action are just noise.
- Intraday Bars (e.g., 1-minute, 5-minute, 1-hour): For most day traders, this is the sweet spot. Minute-level bars give you enough detail to test strategies based on intraday momentum without completely drowning you in data.
- Tick Data: The most granular you can get. This records every single trade and quote update. It's essential for high-frequency trading (HFT), but frankly, it’s often overkill for the average retail trader.
The granularity you choose has a huge impact on accuracy. While many retail traders get by with daily or minute-level data, the pros often use tick-level data. It lets them capture the true timing of trades and see the bid-ask spread, which helps predict costs like slippage that are invisible in less detailed data. You can learn more about the power of tick data for backtesting on intrinio.com.
For instance, you simply can't test a scalping strategy on daily data. You need to see the market tick-by-tick to know if those tiny profit opportunities ever really existed. On the flip side, using tick data to test a long-term portfolio allocation strategy is just a waste of time and computing power.
Where to Find Reliable Historical Data
Once you know what you need, it's time to go find it. Data sources run the gamut from free-but-limited to expensive institutional feeds.
Free and Low-Cost Sources:
- Yahoo Finance: A classic starting point for free daily EOD data. It covers a huge range of stocks and indices.
- Broker APIs: Many brokers like Alpaca or Interactive Brokers offer free historical data APIs to their clients, and the quality is often decent for recent years.
Paid Data Providers:
- Polygon.io: They offer high-quality, clean historical data for stocks, options, and forex, with different subscription levels.
- Quandl: Now part of Nasdaq Data Link, this is a massive library of financial data, with a mix of free and premium options.
Keep in mind, free data can have a hidden cost—it might have errors, gaps, or miss key adjustments for corporate actions. Paid data is usually cleaner, but you still need to check its integrity. You can find more details in our guide to historical stock prices for investors.
Never blindly trust your data source. Always run some basic sanity checks. Plot a price chart and look for obvious gaps or crazy spikes before you run a single backtest. One bad data point can ruin your whole analysis.
The Critical Art of Data Cleaning
Getting the data is only half the job. Preparing and cleaning it is where a lot of people mess up. Raw historical data is almost never perfect and needs to be processed to reflect what actually happened in the market.
This "data hygiene" process involves a few key steps:
- Handling Missing Data: You'll find gaps in your data. It happens. You need a plan to either fill them (maybe with the previous day's close) or exclude that period entirely. Ignoring them is a great way to crash your backtester.
- Adjusting for Corporate Actions: This is a non-negotiable, must-do step. Prices need to be adjusted for things like stock splits and dividends. A 2-for-1 stock split will cut a stock's price in half overnight, but it’s not a real price drop. If your data isn't adjusted, your backtest will think the stock crashed and trigger false sell signals.
- Detecting Outliers: Scan your data for points that are obviously wrong, like a stock price that inexplicably drops to zero for one second. These are usually data feed glitches and should be removed so they don't wreck your performance metrics.
Taking the time to source good data and clean it meticulously is the boring but essential grunt work. It ensures your backtest is a realistic simulation, not a fantasy, and gives you a true picture of how your strategy might have performed.
Choosing The Right Backtesting Framework
Okay, you've got your hands on some clean historical data. Now for the fun part: picking the engine to run your tests. This really comes down to a few personal questions. How comfortable are you with code? How wild is your strategy? And just how much control do you really need over the simulation?
Your options run the gamut from basic spreadsheets all the way to powerful, dedicated coding libraries. Each path has its own perks and pitfalls.
A lot of traders actually start with a simple Excel or Google Sheets model. It’s a very hands-on way to apply your trading rules to historical prices, column by column. This is fantastic for wrapping your head around a simple strategy's mechanics, but it falls apart fast if you’re testing anything complex or trying to cover a few years of data.
Platforms for Non-Coders
If you want serious backtesting power without writing a line of code, you’re in luck. Several platforms offer slick, user-friendly environments perfect for quickly testing ideas and seeing how they would have played out.
- TradingView: Known for its world-class charting, TradingView has a great built-in strategy tester. It uses a language called Pine Script. While it is a form of scripting, it's far simpler than a full-blown programming language, and the community has shared thousands of scripts you can learn from.
- MetaTrader 4/5 (MT4/MT5): This is a long-standing heavyweight in the forex world. MT4 and MT5 include a "Strategy Tester" that lets you backtest automated trading bots called "Expert Advisors" (EAs). It’s an incredibly powerful tool if your world revolves around currencies.
The beauty of these platforms is they handle all the messy data and visualization for you. The downside? You're playing in their sandbox. Trying to customize your backtest beyond what the platform allows can be a dead end.
Python Backtesting Libraries for Full Control
For total freedom, nothing beats building your own backtest in Python. This path gives you complete control over every single variable in the simulation, from how you handle data to the specific performance metrics you want to track. It's the go-to method for quants and serious algorithmic traders for a reason. Understanding what algorithmic trading is can provide more context on why this level of precision is so critical.
Thankfully, you don't have to start from scratch. Several incredible open-source libraries do the heavy lifting for you:
backtrader: This is a feature-packed and hugely popular framework. It's powerful, has great documentation, and excels at testing strategies across multiple assets. The image above is a classicbacktraderplot—it shows you exactly when trades were made and how your portfolio value changed, which is invaluable for a quick diagnosis.Zipline: Originally from the folks at Quantopian,Ziplineis an event-driven backtesting library built for serious work. It’s especially strong for US equities and automatically handles tricky details like survivor bias.VectorBT: This library takes a different, speed-focused approach. It usespandasandNumPyto run thousands of parameter combinations in the blink of an eye. It’s amazing for rapid exploration, though it can be a bit trickier for complex, path-dependent strategies.
The real magic of a library like
backtraderorZiplineis repeatability and customization. Once a strategy is coded, you can test it on any dataset with a single command and invent custom analytics that you'll never find on a pre-built platform.
A Quick Peek at a Backtrader Code Example
To prove this isn't as scary as it sounds, here’s a bare-bones Python example using backtrader to test a classic moving average crossover strategy. This little script defines the logic, feeds it data, runs the test, and prints the result.
import backtrader as bt
import datetime as dt
Define the strategy
class SmaCross(bt.Strategy):
def init(self):
self.sma_short = bt.indicators.SimpleMovingAverage(self.data.close, period=50)
self.sma_long = bt.indicators.SimpleMovingAverage(self.data.close, period=200)
def next(self):
    if not self.position:  # Not in the market
        if self.sma_short > self.sma_long:
            self.buy()
    else:  # In the market
        if self.sma_short < self.sma_long:
            self.sell()
Set up and run the backtest
cerebro = bt.Cerebro()
cerebro.addstrategy(SmaCross)
Add data feed (replace with your data)
data = bt.feeds.YahooFinanceData(dataname='AAPL', fromdate=dt.datetime(2018, 1, 1), todate=dt.datetime(2022, 12, 31))
cerebro.adddata(data)
cerebro.broker.setcash(10000.0)
print(f'Starting Portfolio Value: {cerebro.broker.getvalue():.2f}')
cerebro.run()
print(f'Final Portfolio Value: {cerebro.broker.getvalue():.2f}')
See? Just a few dozen lines of code can run a full backtest and give you a clear, definitive result.
Which Backtesting Platform Is Right for You
Picking the right tool is a personal choice, and it really depends on where you are in your trading journey. To help you figure out what fits best, here's a quick side-by-side comparison.
| Platform | Best For | Coding Required? | Cost |
|---|---|---|---|
| Excel/Sheets | Simple, educational tests and understanding core concepts. | No (Formulas only) | Free |
| TradingView | Chart-based traders and quick visual testing. | Yes (Pine Script) | Freemium |
| MetaTrader | Forex traders and those using Expert Advisors (EAs). | Yes (MQL4/5) | Free |
| Python Libraries | Traders wanting full customization and complex strategies. | Yes (Python) | Free (Open Source) |
Ultimately, the best backtesting framework is the one you’ll actually use. If you're just getting started, fire up TradingView and see what you can build. As your ideas get more sophisticated, you can always make the leap to a Python library for that next level of power and flexibility.
How to Analyze Your Results and Avoid Common Traps
You run the backtest, and the final number is positive. It's a fantastic feeling, like you’ve just struck gold. But hold off on planning that early retirement—the most important part of the process is just beginning. Now, you have to honestly and critically analyze the results.
That final profit figure is just the headline. The real story, the one that tells you if this strategy is worth risking real money on, is buried in the details.
This is where you switch from being a strategy designer to a strategy detective. Your job is to poke holes in everything, question every assumption, and uncover the hidden risks. A beautiful equity curve can easily mask a strategy that's far too dangerous to trade live.
Looking Beyond Net Profit
The total profit is an obvious starting point, but it tells you very little about the journey. Was it a smooth, steady climb, or a gut-wrenching rollercoaster that just happened to end on a high note? To really understand your strategy's personality, you need to dig into the metrics that measure risk-adjusted returns.
Here are a few non-negotiable metrics to get started with:
- Maximum Drawdown: This is the big one. It’s the largest drop your account took from a peak to a trough during the test. A 50% maximum drawdown means at one point, your account was worth half of what it used to be. You have to ask yourself: could you mentally handle that kind of loss without bailing on the strategy?
- Sharpe Ratio: This metric basically tells you how much return you're getting for the amount of risk you're taking. A higher Sharpe Ratio (anything over 1.0 is generally considered good) suggests your strategy is efficient and isn't just relying on wild swings to make money.
- Calmar Ratio: This is similar to the Sharpe Ratio, but it uses the maximum drawdown as its specific measure of risk. It's especially useful if you’re someone who really hates seeing large dips in your account balance.
The image below shows the basic flow of a backtest, from loading the data to calculating these crucial profit and loss numbers.
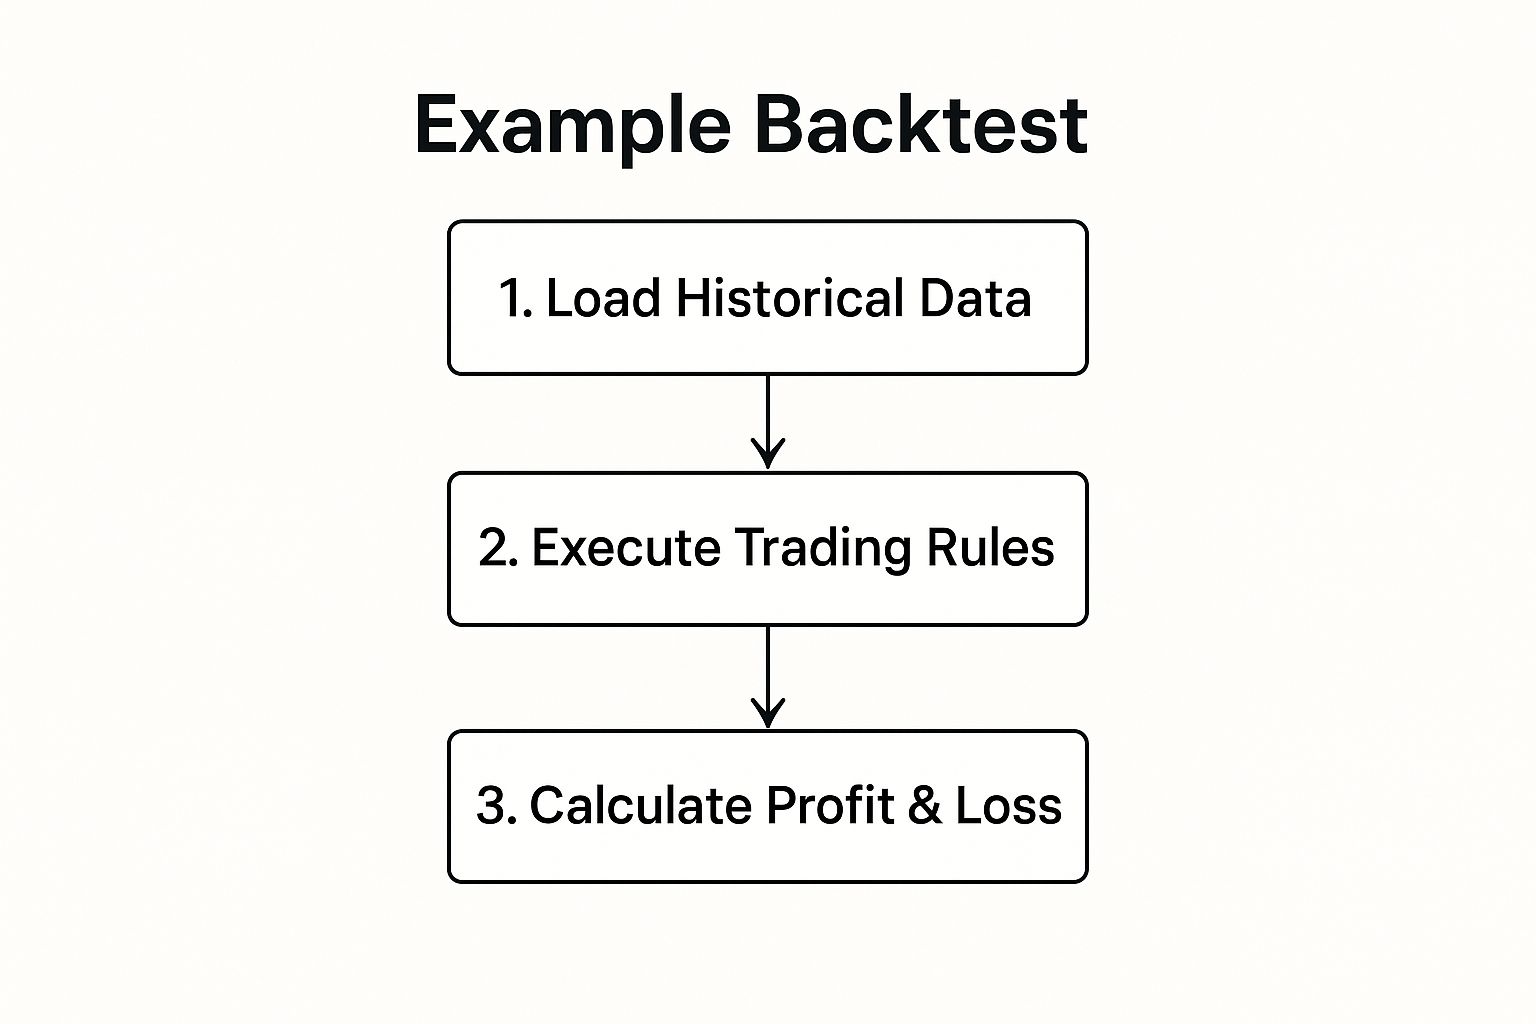
This simple three-step process is the engine that gives you the raw output. Now, it's time to analyze it to see if the strategy has real potential.
Spotting the Silent Strategy Killers
Getting great metrics still isn't the finish line. Now you have to hunt for biases—the hidden flaws that make a backtest look amazing on paper but cause it to fail spectacularly in the real world. These are the traps that catch almost every new trader.
An overly optimized backtest is like a student who memorized the answers to one specific test. They'll get a perfect score on that test, but they'll fail spectacularly as soon as the questions change. Real markets are always changing the questions.
One of the most dangerous traps is overfitting, also known as curve fitting. This happens when you tweak your strategy’s parameters so much that they perfectly match the historical data you tested on. You haven't found a real market edge; you've just memorized the past.
It's also worth thinking about how you came up with the strategy in the first place. You might have started with a hypothesis about how the market works, or you might have used data mining to find patterns. Data mining can uncover some really unique ideas, but it comes with a high risk of overfitting. Any strategy found this way must be validated on data it has never seen before. You can learn more about avoiding these backtesting pitfalls on bookmap.com.
Besides overfitting, two other major biases can completely invalidate your results:
- Survivorship Bias: This happens when your historical data only includes assets that "survived" to today. For instance, testing a stock strategy on the current S&P 500 ignores all the companies that went bankrupt or were delisted. This naturally inflates your results because it excludes all the losers.
- Look-Ahead Bias: This is a subtle but deadly error where your backtest accidentally uses information that wouldn't have been available at the time of the trade. A classic example is using a day's closing price to make a trading decision at the open of that same day.
Building Real Confidence with Walk-Forward Analysis
So, how can you be sure your strategy is robust and not just a fluke of overfitting or bias? The best way is to test it on "out-of-sample" data—a chunk of history your strategy has never seen.
A powerful technique for this is walk-forward analysis. Instead of running one long test on ten years of data, you break it up into smaller pieces.
Here’s a quick look at how it works:
- First, you optimize your strategy on an initial period (say, 2015-2016).
- Then, you run that exact strategy on the next period (2017) to see how it performs on unseen data.
- Next, you slide the window forward, re-optimizing on 2016-2017 and then testing it on 2018.
You keep repeating this process across your entire dataset. If your strategy consistently performs well on the new, unseen "walk-forward" periods, you have much stronger evidence that you've found a genuine, adaptable edge. This kind of rigorous validation is what separates amateur backtesting from a professional approach, and it’s what gives you the confidence to actually put real capital on the line.
Your Go-Live Checklist: From Backtest to Real Money
Nailing a backtest with a killer Sharpe ratio feels amazing. It's a huge milestone, for sure. But let's be real—that’s just the final qualifying lap. The real race is about to begin. Moving a strategy from that clean, simulated world into the chaotic, messy reality of live markets is a whole different ballgame. It demands its own checklist.
Jumping straight from a positive backtest to a full-sized account is one of the fastest ways I've seen traders blow up. The real world has friction, things your perfect simulation probably just ignored. Our job now is to bridge that gap, carefully and methodically.
The Paper Trading Phase
Before you even think about risking a single dollar, your first stop is paper trading. You might also hear it called forward performance testing. It’s simple: you run your strategy in a live market simulation, trade by trade, but with zero real money on the line. Think of it as a full dress rehearsal.
This step is non-negotiable for a few key reasons:
- Workflow Check: Can you actually follow your signals and execute trades in real-time? Is the process smooth, or do you find yourself fumbling when the market is moving?
- Psychological Primer: This gives you a taste of the emotional roller coaster. You’ll see your P&L swing up and down, and even with fake money, it gets your gut used to the feeling.
- Data Sanity Check: It's your chance to confirm that your live data feed is behaving just like the historical data you tested on. You'd be surprised how often discrepancies pop up here, and it's much better to find them now.
Give yourself at least a few weeks—a full month is even better. The goal here isn't to make hypothetical millions. It's to prove your execution is solid and the strategy acts like you expect it to in today's market conditions.
The biggest thing people underestimate is the psychological shift when real money is involved. A 2% drawdown in a backtest is just a statistic on a screen. A 2% drawdown in your live account is a visceral, stomach-churning event that can push you into making terrible, emotional decisions.
Accounting for Real-World Friction
I can almost guarantee your backtest didn't account for all the little costs that slowly bleed your profits away. Live trading is full of "frictions" that can turn a great strategy into a mediocre one. You have to model these before you go live.
- Slippage: This is the gap between the price you thought you'd get and the price you actually get. In a fast market, it adds up, and it's almost always a cost, not a credit.
- Commissions and Fees: Every single trade costs money. These fees might seem tiny, but over hundreds of trades, they can easily wipe out a marginal edge.
- Latency: The split-second delay between your signal firing and your order hitting the exchange matters, especially for faster strategies.
So, if your backtest showed a net profit of 15%, it's time to stress-test it. Rerun the simulation, but this time, bake in some conservative estimates for these costs. If the strategy is still comfortably profitable, you've got something robust. Skip this, and you're setting yourself up for a very rude awakening.
Deploying with a Small, Live Account
Okay, you’ve passed the paper trading test and you've factored in real-world costs. Now it’s time for some skin in the game—but just a little. Fund a small, live account with an amount you are genuinely, 100% okay with losing.
This phase isn't about getting rich; it’s about education. It’s where you test your discipline and emotional control under real financial pressure. A small loss here is the price of tuition, and it will teach you more about your own psychology than a thousand backtests ever could. This is where you really start mastering risk management in trading, the skill that truly separates the pros from the amateurs.
Only after you've shown consistent, disciplined execution over a meaningful period—say, a few months—should you even consider scaling up. This deliberate, phased approach is how you turn a backtested idea into a battle-hardened trading strategy you can manage with confidence for the long haul.
Common Questions About Backtesting
Even with a solid plan, getting into the weeds of backtesting can stir up a lot of questions. It's totally normal to hit a few snags. Let's tackle some of the most common ones head-on to clear things up and keep you moving.
How Much Historical Data Do I Need?
This is easily one of the most frequent questions, and the answer isn't just a simple number. It really depends on your strategy's timeframe and how often it trades. A good rule of thumb is to grab enough data to cover several different market cycles—bull runs, bear markets, and those frustrating sideways periods.
- For day trading strategies: You'll want at least 1-2 years of high-quality intraday data, like 1-minute or 5-minute bars. This gives you thousands of individual trading days to see how your system behaves in different volatility environments.
- For swing or position trading: I’d aim for 10+ years of daily data. This much longer timeframe ensures your strategy has weathered major economic events, market crashes, and the recovery periods that followed.
The real goal here is to rack up enough trades in your backtest—ideally hundreds, if not thousands—to feel confident in the results. A strategy tested on just 20 trades tells you almost nothing about its future potential.
Can a Good Backtest Guarantee Future Profits?
Absolutely not. And it’s critical to burn this into your brain. A fantastic backtest is a great sign and a necessary step, but it is not a crystal ball. The market is a living, breathing thing that's always changing, and past performance is never a reliable promise of future results.
Think of it this way: a backtest proves your strategy had a statistical edge during a specific period in history. It builds your confidence and validates the logic, but the real world will always throw new curveballs your way.
What If My Backtest Results Are Bad?
First off, don't get discouraged! A failed backtest is actually a huge win. It just saved you from losing real money on a flawed idea. This is exactly why we backtest—to find and kill off weak strategies quickly and cheaply.
When a test blows up, treat it like a free lesson. Dig into the results to figure out why it failed.
- Did it fall apart in a specific market, like when volatility spiked?
- Were transaction costs and slippage eating up every last bit of profit?
- Was the win rate so low that the drawdowns were just unbearable?
Use that feedback to tweak your rules or, better yet, scrap the idea and move on to the next one. This loop of testing, failing, and refining is the core of developing a truly robust trading system. Every failed backtest gets you one step closer to one that actually works.
Ready to stop guessing and start making data-driven trading decisions? Fear Greed Tracker provides real-time market sentiment scores for over 50,000 assets, giving you the edge you need to understand market psychology. Use our powerful tools to track fear and greed, analyze technicals, and get alerts when sentiment shifts on your favorite stocks and cryptocurrencies. https://feargreedtracker.com