
Before you can learn how to calculate implied volatility, you first need to get a feel for what it really is. It’s not some rigid, mathematical certainty. Think of it as the market’s collective forecast for a stock's future price swings—a gut feeling turned into a number. It’s the "risk premium" baked right into an option's price, reflecting expected turbulence or calm on the horizon.
What Implied Volatility Really Tells You

At its heart, implied volatility (IV) is a forward-looking metric. It doesn't tell you which way a stock is headed, only the potential magnitude of the move. This is a crucial distinction. It’s the polar opposite of historical volatility, which just tells you what has already happened.
I like to think of it this way: historical volatility is like watching a replay of last week's game. Implied volatility is like checking the betting odds before the opening kickoff. It’s all about what the market expects to happen next.
A Gauge of Market Fear and Greed
When implied volatility is high, it’s a clear signal that traders are expecting big things. They’re anticipating a major price move, often because of some big event looming on the calendar. That uncertainty is what drives the number up.
You’ll almost always see a spike in IV leading up to:
- Upcoming earnings reports: The market is bracing for a surprise that could send the stock soaring or cratering.
- Major company announcements: News of a new product, a merger, or a regulatory headache injects a ton of uncertainty.
- Broad market instability: Widespread economic or political chaos makes all stocks feel riskier, pushing IV up across the board.
On the flip side, low implied volatility means the market is snoozing. It's signaling a period of calm with minimal price fluctuations, usually when there's no major news on the horizon. This sentiment is often captured in broader market indicators. If you want to go deeper, you can learn more by understanding the Stocks Fear and Greed Index and how it reflects this collective emotion.
The Risk Premium in Option Pricing
Ultimately, implied volatility is the component of an option's price that accounts for its chance to become profitable. A higher IV means a fatter premium for the option seller, since they're taking on more risk by betting against a huge price swing.
For an options buyer, high IV means paying a premium for a shot at a big win. For a seller, it means collecting more cash upfront as compensation for taking on that extra uncertainty.
So, when you calculate implied volatility, you're not just getting a number. You're getting a story about market expectations. It reveals just how much fear or confidence is priced into an asset at any given moment, giving you invaluable context for your next move.
Gathering Your Inputs for the Black-Scholes Model
Before you can calculate implied volatility, you need the right ingredients. The Black-Scholes model is the engine that does the heavy lifting, but it’s completely dependent on the data you feed it. Think of it like a recipe: get one input wrong, and the entire calculation will be off.
The good news? You don’t need to dig through obscure financial reports. All five pieces of the puzzle are right there on your trading platform. It’s just a matter of knowing what to look for.
Finding Your Core Option and Stock Data
Let's start with the basics—the data points tied directly to the specific option contract you're analyzing. These are usually the easiest to grab from any options chain.
- Option's Current Market Price: This is the premium, the price you pay (or get paid) to trade one contract, which is then multiplied by 100. Look for the "mark," "mid," or last traded price.
- Underlying Stock Price: Simple enough—it's the current price of the stock. Just make sure the stock price and the option premium you're using are from the same moment in time to avoid any mismatches.
- The Strike Price: This is the price at which you can buy or sell the stock if you exercise the option. It's clearly listed for every single contract.
These first three inputs define the specific option you're looking at. The next two are what give the calculation context, factoring in time and the cost of money.
Incorporating Time and Risk
Now that you have the contract details, it’s time to add two critical variables: the time remaining on the clock and the risk-free interest rate.
First up is the time to expiration. This is a common trip-up point. The model requires this value to be expressed in years, not days. If an option expires in 90 days, you’d use 0.25 (90 / 365). Your trading platform likely shows this as "DTE" (Days to Expiration) to make the initial number easy to find.
Finally, you need the risk-free interest rate. This is meant to represent the return you could get on an investment with virtually zero risk over the option's lifespan.
The gold standard here is to use the yield on a U.S. Treasury bill (T-bill) that has a maturity date closest to your option's expiration. You can use a general number like 5% as a rough estimate, but for precise work, matching the T-bill yield is the way to go.
Black-Scholes Model Input Checklist
To make sure you have everything in one place, here’s a quick checklist of the five key variables you’ll need to plug into any implied volatility calculator.
| Input Variable | Description | Example Source |
|---|---|---|
| Option Price | The current premium of the option contract. | Found on any options chain (look for "Mark" or "Mid" price). |
| Stock Price | The current market price of the underlying stock. | Your brokerage platform's real-time quote. |
| Strike Price | The price at which the option can be exercised. | Clearly listed on the options chain for the specific contract. |
| Time to Expiration | The remaining life of the option, expressed in years. | Calculate from "DTE" (Days to Expiration / 365). |
| Risk-Free Rate | The current yield on a short-term U.S. T-bill. | Check the U.S. Department of the Treasury website. |
Nailing these five data points is the most important part of the process. Once you have them neatly organized, you're ready to let a calculator do the complex math for you.
How the Black-Scholes Model Finds Implied Volatility
Here’s the most interesting part about learning to calculate implied volatility: you don't actually solve for it directly. There isn't some clean formula where you plug in the numbers and "IV" pops out on the other side.
Instead, the process works in reverse, using the famous Black-Scholes model as its engine.
Think of it like this: the Black-Scholes model was originally built to figure out the theoretical price of an option. It takes a bunch of knowns—stock price, strike price, time to expiration, and the risk-free rate—and one big assumption: the stock's future volatility. If you have all that, the model tells you what an option should be worth.
But in the real world, we already have the option's price. It's staring right at us on the screen. The one thing we don't know is what level of future volatility the market has baked into that price.
Working Backward with an Iterative Process
To find implied volatility, trading platforms and calculators essentially play a high-speed game of "guess and check." This is called an iterative process. It starts by plugging in an initial guess for volatility, let's say 20%, into the Black-Scholes formula.
The model then spits out a theoretical option price based on that guess. The computer immediately compares this calculated price to the actual market price of the option.
- If the model's price is too low, it knows the volatility guess was also too low.
- If the model's price is too high, the volatility guess was too high.
So, the system adjusts its volatility guess up or down and runs the entire calculation again. It repeats this loop—calculate, compare, adjust—hundreds or even thousands of times in a split second. This keeps going until it finds the exact volatility percentage that makes the Black-Scholes theoretical price perfectly match the real-world market price.
That single, perfect-fit number is your implied volatility. It's the market's consensus on future price swings, reverse-engineered from what traders are actually paying for the option right now.
This entire process relies on the foundational option pricing model from 1973. Since the Black-Scholes formula doesn't have a simple algebraic solution for volatility, traders depend on numerical methods like the Newton-Raphson algorithm to find the answer. You can dive deeper into this with the CBOE's insights on volatility trading.
Visualizing the Calculation Flow
Getting your head around this backward process is the key to trusting the IV numbers your trading platform shows you. This infographic breaks down the logical flow, from the raw market data to the final implied volatility figure.
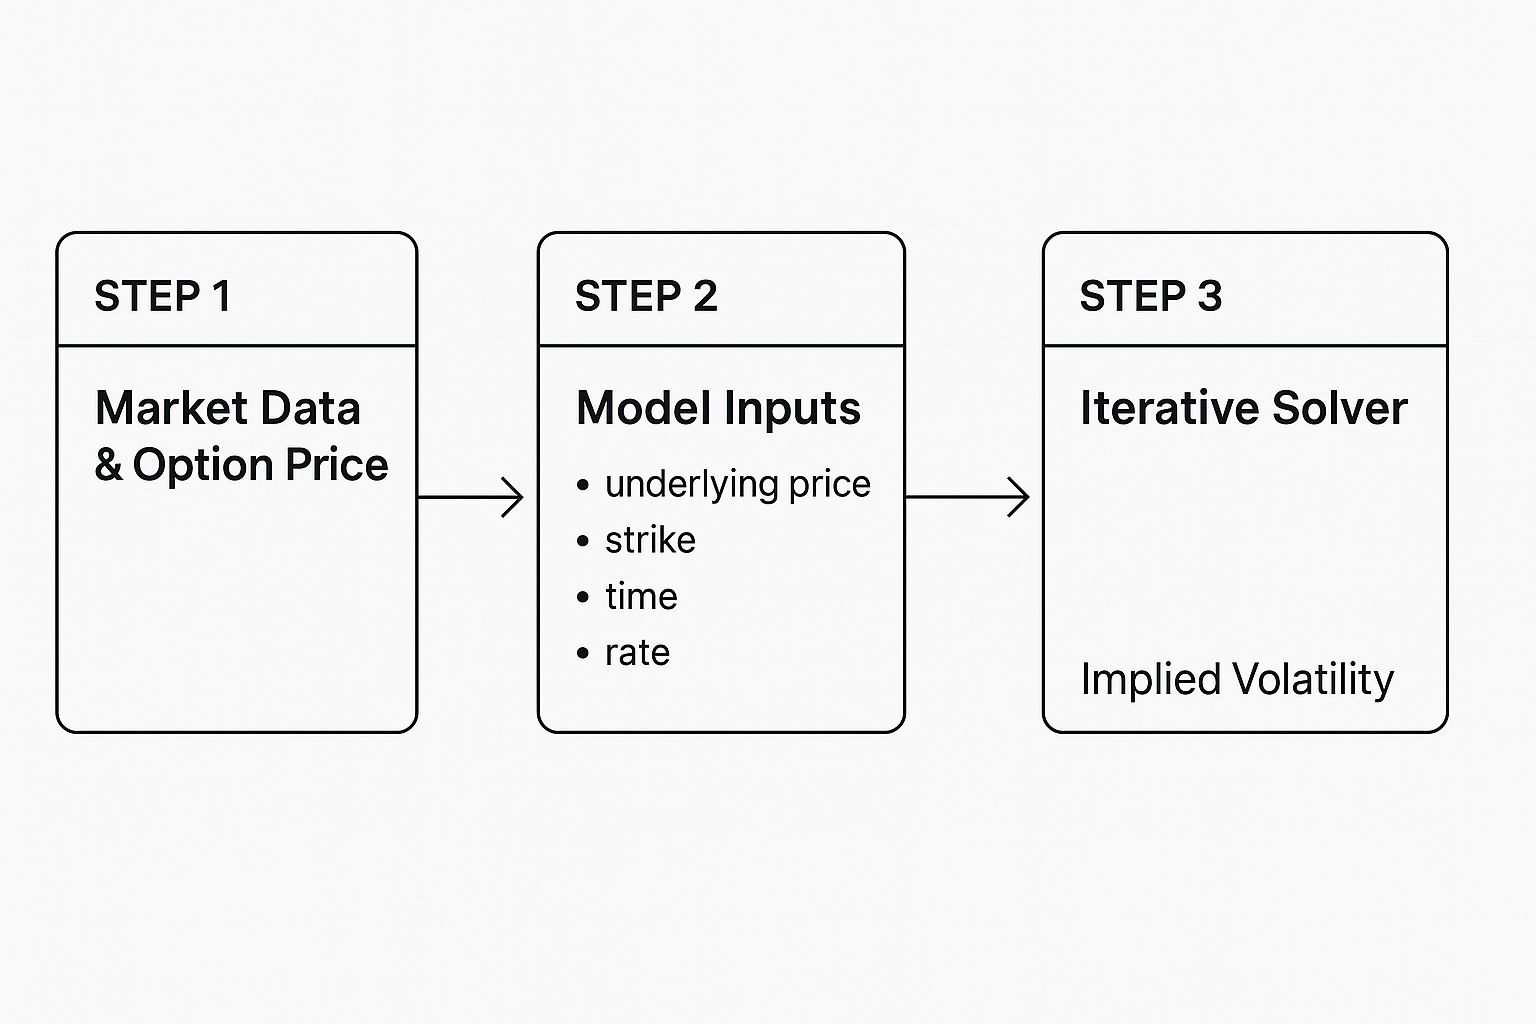
As you can see, the process kicks off with known market inputs and uses the iterative solver as a bridge to uncover the one unknown variable: implied volatility. It really drives home the point that IV isn't a direct input but the output of this reverse calculation.
The good news? You don't need to do any of these complex iterations yourself. Every modern trading platform and online IV calculator has this logic built right in. Your only job is to provide the five accurate inputs we gathered earlier. The machine handles all the high-speed "guess and check" work for you.
This is exactly why having clean, accurate inputs is so critical. The solver is powerful, but it’s only as good as the data it’s fed. A small error in the option price or time to expiration will send the solver on a hunt for the wrong number, leaving you with a misleading implied volatility. Once you understand what’s happening behind the curtain, you can interpret and act on the numbers with much more confidence.
A Real-World Implied Volatility Calculation Example
Alright, theory is one thing, but let's get our hands dirty with some real market data. Nothing makes this click like walking through an actual example.
We're going to calculate implied volatility for a big-name stock, NVIDIA (NVDA), using a free online tool. This exercise will show you exactly how those five key inputs come together in the real world.
For this walkthrough, we'll keep it simple and use an at-the-money call option. Why? Because at-the-money options are usually the most liquid and sensitive to volatility shifts, which gives us the cleanest IV reading.
Sourcing Your Live Market Data
First things first, we need to grab our five essential data points from a live options chain. Let's pretend we're looking at an NVDA call option on an active trading day.
Here’s the hypothetical (but totally realistic) data we've pulled:
- Underlying Stock Price (S): NVDA is trading at $905.00.
- Strike Price (X): We’ve picked an at-the-money call, so the strike is also $905.
- Option Price (Premium): The going market rate for this call option is $45.50.
- Time to Expiration (t): This option expires in 45 days. We have to convert this to years for the formula, so we divide 45 by 365, which comes out to about 0.123.
- Risk-Free Rate (r): A quick check on the U.S. Treasury website shows the 1-month T-bill yield is 5.40%. We'll use this as 0.054.
With these five numbers in hand, we've got everything we need. The next part is easy: we just need to plug them into a reliable calculator.
Plugging the Numbers into a Calculator
Now, just find a free online Black-Scholes calculator. These tools are built to do the heavy lifting for us—that iterative "guess and check" process we talked about earlier.
We just have to carefully punch in each piece of data into the right field.
Here’s a quick summary of what we're entering:
| Data Input | Value |
|---|---|
| Stock Price | $905.00 |
| Strike Price | $905.00 |
| Option Premium | $45.50 |
| Days to Expiration | 45 (or 0.123 years) |
| Risk-Free Rate | 5.40% |
Once everything's entered, we hit "calculate." The tool instantly does its magic, running through different volatility inputs until its own calculated option price matches our real market price of $45.50.
The result? The calculator spits out an implied volatility of 58.5%. This is the exact number that makes the whole Black-Scholes equation balance for our NVDA option.
So, that 58.5% isn't just a random number. It's the market's collective bet on how much NVIDIA's stock will move over the next 45 days.
Now you have a tangible figure you can work with. You can compare it to NVDA's historical volatility or the IV of another stock to get a feel for whether this option is relatively "cheap" or "expensive."
See? The process isn't about being a math wizard. It’s all about gathering accurate data.
Using the VIX to Understand Market-Wide Volatility
While it's crucial to calculate implied volatility for a single stock, you have to remember that no stock exists in a vacuum. A stock’s IV might be spiking for company-specific reasons, or it could just be caught in a tidal wave of market-wide panic.
This is where you need to zoom out. To see the bigger picture, experienced traders turn to the VIX Index.
Often called the market's "fear gauge," the VIX gives you that 30,000-foot view of expected volatility across the entire S&P 500. It works by taking the prices from a massive basket of S&P 500 options and boiling them down into a single, forward-looking number. That number represents the market's consensus forecast for volatility over the next 30 days.
What VIX Levels Are Telling You
Reading the VIX is pretty intuitive. Low VIX? The market is calm, maybe even complacent. High VIX? Fear and uncertainty are creeping in. While there are no hard-and-fast rules, history gives us some reliable signposts.
- Below 20: This generally signals a calm, low-volatility environment. Traders aren't really pricing in any big, sudden moves.
- Between 20 and 30: Things are getting a little tense. This range suggests a heightened sense of uncertainty, common during market pullbacks or periods of indecision.
- Above 30: Now we're talking about significant fear. When the VIX starts climbing toward 40 and beyond, it’s usually tied to major market sell-offs or full-blown crises.
This context is everything. Imagine you see a stock with an IV of 60%, but the VIX is snoozing at 15. You can bet the cause is something specific to that company, like a big earnings report coming up.
But if that same stock has a 60% IV and the VIX is screaming at 45, you know it's part of a much bigger storm. Making that distinction is what separates a decent strategy from a great one. To learn more about applying these concepts, check out our guide on how to use market sentiment analysis for trading.
How the VIX Is Calculated
The VIX is far more sophisticated than a simple average. The Cboe introduced it back in 1993, and it has since become the gold standard for measuring equity market volatility.
The modern calculation, updated in 2003, uses a model-free approach. It aggregates the weighted prices from a huge range of S&P 500 puts and calls to generate a really robust estimate of 30-day expected volatility. You can dig into the VIX's historical data on Cboe.com to see how it has behaved over time.
The VIX doesn't just measure volatility; it quantifies market sentiment. It is the weighted average of the prices of all out-of-the-money puts and calls for the S&P 500, providing a comprehensive and forward-looking snapshot of investor fear.
By adding the VIX to your toolkit, you stop analyzing a single tree and start understanding the entire forest. It provides the essential context you need to interpret the implied volatility of any individual stock, helping you make smarter, more strategic trading decisions.
Common Questions About Implied Volatility
Once you get the hang of calculating implied volatility, a few tricky questions always seem to pop up. Let's tackle the most common ones I hear to clear up any confusion and get you trading with more confidence.
Think of this as your quick-reference guide for the nuances you’ll actually run into.
Can Implied Volatility Be Zero or Negative?
This is a great question because it gets right to the heart of what IV really is.
The short answer? Nope. Implied volatility can never be zero or negative. A zero IV would mean the market expects a stock's price to be perfectly still, with a 0% chance of moving. That’s just not possible in a live, breathing market.
A negative volatility is even more out there—it's mathematically impossible. Volatility measures the size of price swings, and you can't have a negative size. The absolute lowest it can ever go is just above zero.
In the real world, an IV below 5-10% is already exceptionally low. It’s a sign that the market is expecting things to be incredibly calm. A true zero is just a theoretical floor, not something you'll ever see on your screen.
Every asset, even the most stable ones, has some level of uncertainty baked into its price. That uncertainty is exactly what implied volatility captures.
What Is a Volatility Smile or Skew?
Here’s something you'll notice right away. If you plot the IV for options with the same expiration date but different strike prices, you won't see a flat line. Instead, you get a curve, which traders call a volatility smile or a volatility skew.
Volatility Smile: This looks like a literal "smile" on a graph. You often see it in currency markets, where IV is highest for options that are deep in-the-money or far out-of-the-money, and lowest for the at-the-money options right in the middle.
Volatility Skew: This is much more common in the stock market. You’ll see that out-of-the-money put options have a much higher IV than out-of-the-money call options. Why? It reflects fear. Traders are willing to pay a much bigger premium to protect against a sharp market drop (a "crash") than they are to bet on a massive rally.
This skew is a powerful visual. It shows that not all options on the same stock carry the same perceived risk. It's a key part of understanding what is market sentiment, because it shows you exactly where the fear is concentrated.
Is Historical Volatility a Good Substitute?
Not even close. They’re two completely different tools for two completely different jobs.
Historical volatility (HV) looks in the rearview mirror. It tells you how much a stock's price has actually moved in the past. It’s a backward-looking report card on its behavior.
Implied volatility (IV), on the other hand, is all about looking forward. It shows how much the market expects the price to move in the future. It's a forecast, priced by the collective bets of all traders.
You might glance at HV to get a baseline for a stock’s typical personality, but you use IV to price options and gauge current market expectations. One is history; the other is prophecy.
Ready to stop guessing and start measuring? The Fear Greed Tracker provides real-time sentiment scores for over 50,000 assets, turning market fear into your strategic advantage. https://feargreedtracker.com