
If you’ve ever been in a stadium during a nail-biter of a game, you know the feeling. The air crackles with energy. One moment, the crowd is roaring with confidence, absolutely certain of a win. The next, a single bad play sends a wave of anxious silence through the stands.
That collective, gut-level feeling—that emotional rollercoaster—is a perfect picture of market sentiment. It’s the overall mood of investors toward a stock, a crypto, or the market as a whole. It's driven less by cold, hard numbers and more by raw human emotions like fear, greed, and hope.
What Is Market Sentiment, Explained
Simply put, market sentiment is the dominant emotional state of everyone participating in the market. It's a powerful force that can, and often does, push prices around all on its own.
When optimism and greed are the main characters, people are eager to buy, which can send prices soaring. But when fear and pessimism take the stage, selling becomes the default, and prices can tumble just as quickly.
The Psychology Behind The Price
At its heart, understanding market sentiment is all about human psychology. It’s built on the very real idea that we aren't always rational, especially when our money is on the line. Our decisions are often colored by powerful feelings:
- Fear: The deep-seated worry of losing money. This can trigger waves of panic selling.
- Greed: The intense desire for massive profits. This is the fuel for speculative bubbles.
- Hope: The quiet optimism for the future. This encourages people to invest for the long haul.
These emotions create a strong undercurrent that can sometimes completely overpower traditional metrics like a company's revenue or profits. A stock's price might jump not because its business is suddenly better, but simply because a wave of positive sentiment carried it higher.
Market sentiment is essentially the 'crowd psychology' of the financial world. It reflects the idea that the emotions of the group can become a market-moving force in their own right, separate from underlying fundamentals.
Sentiment-Driven vs Fundamental Analysis
It's really important to draw a line between making decisions based on sentiment versus those based on fundamental analysis. Think of fundamental analysis as a detective's work. A fundamental analyst meticulously digs through a company's financial records, evaluates its leadership, and studies its position in the industry to figure out what it’s really worth.
Sentiment analysis, on the other hand, is more like being a weather forecaster. It isn’t trying to determine an asset’s true value. Instead, it’s focused on which way the emotional winds are blowing and how strong they might be. For example, a sharp drop in consumer confidence can signal economic trouble long before it shows up in official GDP reports.
Here’s a quick breakdown to highlight how different these two approaches are.
Sentiment-Driven vs Fundamental Analysis
| Aspect | Market Sentiment Analysis | Fundamental Analysis |
|---|---|---|
| Focus | Investor emotions, mood, and crowd psychology | Company financials, intrinsic value, and economic health |
| Data Sources | Surveys, news headlines, social media, volatility (VIX) | Financial statements, earnings reports, economic data |
| Time Horizon | Typically short to medium-term | Primarily long-term |
| Primary Question | "How do investors feel about the market right now?" | "What is this company or asset actually worth?" |
Grasping this difference is the first step toward using sentiment to your advantage. It’s not about picking one and ignoring the other. The smartest investors learn to blend both—using fundamentals to understand the "what" and sentiment to understand the "why"—to make more informed, context-aware decisions.
Why Market Sentiment Is a Critical Investment Tool
It’s one thing to know what market sentiment is, but it’s another thing entirely to appreciate its power. So, why should you care about the collective mood of the market? Because sentiment can easily become a self-fulfilling prophecy.
Widespread optimism can pump up asset prices far beyond what they’re actually worth, creating dangerous market bubbles. On the flip side, deep-seated fear can trigger massive, panicked sell-offs, pushing prices well below their fundamental value. This creates a powerful force that can generate both incredible risk and immense opportunity.
Sentiment as a Contrarian Indicator
One of the most powerful ways to use market sentiment is as a contrarian indicator. This entire investment philosophy is summed up perfectly by Warren Buffett's timeless advice: "be fearful when others are greedy and greedy when others are fearful."
In short, when the market hits an emotional extreme, it’s often a screaming sign that a reversal is just around the corner.
Peak Euphoria (Extreme Greed): When every headline is glowing, your social media feed is full of success stories, and your neighbor suddenly thinks he’s a stock-picking genius, greed has likely hit its peak. At this point, almost everyone who was going to buy has already bought, leaving very few people to push prices any higher. This is often the flashing red light right before a market top.
Peak Despair (Extreme Fear): Conversely, when the market is drowning in doom and gloom and investors are dumping assets in a panic, it often means the worst is over. When pessimism is at its absolute maximum, most of the sellers have already sold. This can create a potential market bottom and a fantastic buying opportunity for anyone who keeps a level head.
This dynamic works because extreme emotions push prices far away from their fair value. A contrarian investor simply uses these emotional overreactions to their advantage—buying when things look bleak and assets are cheap, and selling when everyone else is euphoric and assets are overpriced.
The Weather Report for Your Investments
Think of your investment strategy like planning a cross-country road trip. Your fundamental analysis—digging into a company's health, earnings, and competitive edge—is your map. It tells you exactly where you want to go and the best roads to take.
Market sentiment, however, is the weather report.
You could have the most accurate, detailed map in the world, but if you ignore a forecast for a blizzard sitting right in your path, you’re driving straight into disaster. It’s the same with investing. You can find a fundamentally solid company, but if you buy in right at the peak of market euphoria, you could still lose a lot of money when the mood inevitably sours.
Ignoring the market's emotional climate is like setting sail without checking for storms. A strong fundamental case provides direction, but sentiment analysis helps you navigate the immediate, and often turbulent, conditions.
Paying attention to market sentiment isn't about chasing pointless "noise." It's a critical part of managing your risk. Data from recent years, for example, shows that sharp drops in consumer sentiment have often preceded weaker employment and revenue growth. It's not a crystal ball, but it gives you valuable context that hard economic data can't provide on its own.
This is what makes sentiment such a vital tool. It helps you decide when to act on your research. It adds a tactical layer to your strategy, helping you sidestep emotional storms or seize the opportunities that widespread fear leaves behind. By combining your map with the weather report, you’re much better equipped to make smarter, more timely decisions.
How to Measure the Market's Emotional Temperature
Okay, so we know market sentiment is a powerful force. But how do you actually measure something so intangible? You can’t exactly hook the stock market up to a polygraph.
Instead, we rely on a handful of smart indicators that act like the market's thermometer. They give us a real, tangible reading on the collective mood. These tools won't predict the future with 100% accuracy, but they provide critical context. They help you tell the difference between rational calm, irrational exuberance, and outright panic.
Let's get practical and look at the instruments you can use to check the market's pulse.
Reading the Minds of Investors with Surveys
One of the most straightforward ways to take the market's temperature is to simply ask investors how they're feeling. That's exactly what sentiment surveys do—they capture a snapshot of optimism or pessimism across different groups of people.
A classic example is the American Association of Individual Investors (AAII) Sentiment Survey. For decades, it has asked its members one simple question each week: "What direction do you feel the stock market will be in over the next six months?" The answers fall into three buckets: bullish (optimistic), bearish (pessimistic), or neutral.
As of mid-2025, for instance, the AAII survey showed bullish sentiment at 43.8%, a big jump from its historical average of 37.5%. When sentiment stretches this far from the norm, it often acts as a contrarian red flag, suggesting things might be getting a little too optimistic. You can see these trends for yourself over on the AAII website.
The VIX: The Market's Fear Gauge
If surveys are like asking the crowd for its opinion, the CBOE Volatility Index (VIX) is like listening to how loudly it's screaming. It’s famously known as the "fear gauge," and it measures the market's expectation of volatility over the next 30 days.
Think of it as a seismograph for market tremors. A low VIX reading (usually below 20) means the market is calm and confident. But when the VIX spikes (climbing above 30), it's a clear sign that fear and uncertainty are creeping in, and investors are bracing for a rocky ride.
A sudden jump in the VIX is a real-time signal that fear is taking over, which almost always happens during sharp market sell-offs.
Decoding Options with the Put/Call Ratio
Another fantastic tool is the put/call ratio. This metric gets right down to where the money is going by comparing the number of bearish options (puts) being traded against the number of bullish options (calls).
Here’s what it tells you in a nutshell:
- A High Put/Call Ratio (above 1.0): This means more investors are buying puts (the right to sell an asset) than calls (the right to buy). It’s a strong sign of bearish sentiment, as traders are either betting on a decline or hedging their portfolios.
- A Low Put/Call Ratio (below 0.7): This indicates that bullish calls are outpacing bearish puts, signaling that investors expect prices to rise.
The put/call ratio gives you a raw look at what traders are doing, not just what they're saying. While surveys measure opinions, this ratio tracks actual bets, making it a potent indicator of the true underlying mood.
Watching this ratio helps you see if the dominant emotion is fear (driving more puts) or greed (fueling more calls). A sharp swing toward either extreme can be a powerful signal for a contrarian trader.
When you put these tools together, you get a much richer, multi-dimensional view of the market's emotional state. No single indicator tells the whole story, but when surveys, volatility, and options data all point in the same direction, you get a much clearer picture. To see how to fit these concepts into a trading strategy, check out our guide on how to use market sentiment analysis for trading.
A Deep Dive into the Fear and Greed Index
While individual indicators like the VIX or put/call ratios give you a piece of the puzzle, some tools pull everything together into one simple, powerful score. The most famous of these is the Fear & Greed Index, which essentially acts as a master dashboard for the market's mood.
Think of it like a chef's special recipe for measuring market sentiment. It carefully combines seven different "ingredients"—each a unique market indicator—and blends them into a single score from 0 (Extreme Fear) to 100 (Extreme Greed). This gives you an at-a-glance snapshot of whether fear or greed is in the driver's seat.
A score of 50 is the neutral middle ground. Anything below 25 points to serious fear, while a score over 75 suggests the market is getting a bit too greedy. By packing so much complex data into one number, it helps investors quickly get a read on the emotional climate.
Breaking Down the Seven Ingredients
To really get what the index is telling you, it helps to know what’s under the hood. It’s built on seven components, each weighted equally, that all contribute to the final sentiment reading. Let's peel back the layers.
The first three ingredients are all about price action—what the market is actually doing.
- Stock Price Momentum: This compares the S&P 500 to its 125-day moving average. When the index is flying high above its average, it’s a sign of greed. When it’s lagging far behind, fear is taking over.
- Stock Price Strength: This one is simple. It tracks the number of stocks hitting 52-week highs versus those hitting 52-week lows on the New York Stock Exchange. More highs point to greed; more lows scream fear.
- Stock Price Breadth: This looks at trading volume. Specifically, is more money flowing into stocks that are rising or stocks that are falling? Heavier volume on advancing stocks is a classic sign of greed and strong buying conviction.
The More Subtle Flavors of Sentiment
The other four components dig a little deeper, capturing the market’s mood from different angles.
- Put and Call Options: Just like the standalone ratio we discussed, this component compares the trading volume of bearish put options to bullish call options. A spike in puts relative to calls signals growing fear.
- Market Volatility: No surprise here—this is the VIX. A higher VIX reading means more uncertainty and jitters, which pushes the index closer to the "Fear" end of the scale.
- Safe Haven Demand: This looks at how stocks are performing compared to Treasury bonds over the last 20 trading days. When investors get scared, they often dump stocks and run to the relative safety of bonds. So, if bonds are outperforming stocks, it’s a clear sign of fear.
- Junk Bond Demand: This measures the "spread," or the difference in yield, between safer investment-grade bonds and riskier junk bonds. When investors feel confident (greedy), they're happy to take on more risk for a little extra return, so the spread tightens. When they're fearful, they demand a much bigger reward for taking that risk, and the spread widens.
Each of these indicators tells its own story. The table below gives a quick summary of what each one is tracking.
Components of the Fear & Greed Index
| Indicator | What It Measures | Signal for Fear/Greed |
|---|---|---|
| Stock Price Momentum | S&P 500 vs. its 125-day moving average | Greed: Index is far above its average. Fear: Index is far below. |
| Stock Price Strength | Number of stocks at 52-week highs vs. lows | Greed: More highs than lows. Fear: More lows than highs. |
| Stock Price Breadth | Trading volume in rising stocks vs. falling stocks | Greed: Higher volume in rising stocks. Fear: Higher volume in falling stocks. |
| Put and Call Options | Ratio of put option volume to call option volume | Greed: More calls than puts. Fear: More puts than calls. |
| Market Volatility | The VIX (CBOE Volatility Index) | Greed: Low VIX reading. Fear: High VIX reading. |
| Safe Haven Demand | Performance of stocks vs. Treasury bonds | Greed: Stocks outperform bonds. Fear: Bonds outperform stocks. |
| Junk Bond Demand | Yield spread between junk and investment-grade bonds | Greed: Narrowing spread. Fear: Widening spread. |
By blending these seven distinct metrics, the index gives you a well-rounded and robust picture of market sentiment. If just one or two indicators are flashing red, the overall reading might not move much. But when all seven start screaming fear at once, the index will nosedive, giving you a powerful contrarian signal.
The following chart shows just how much these sentiment trends can swing over time.
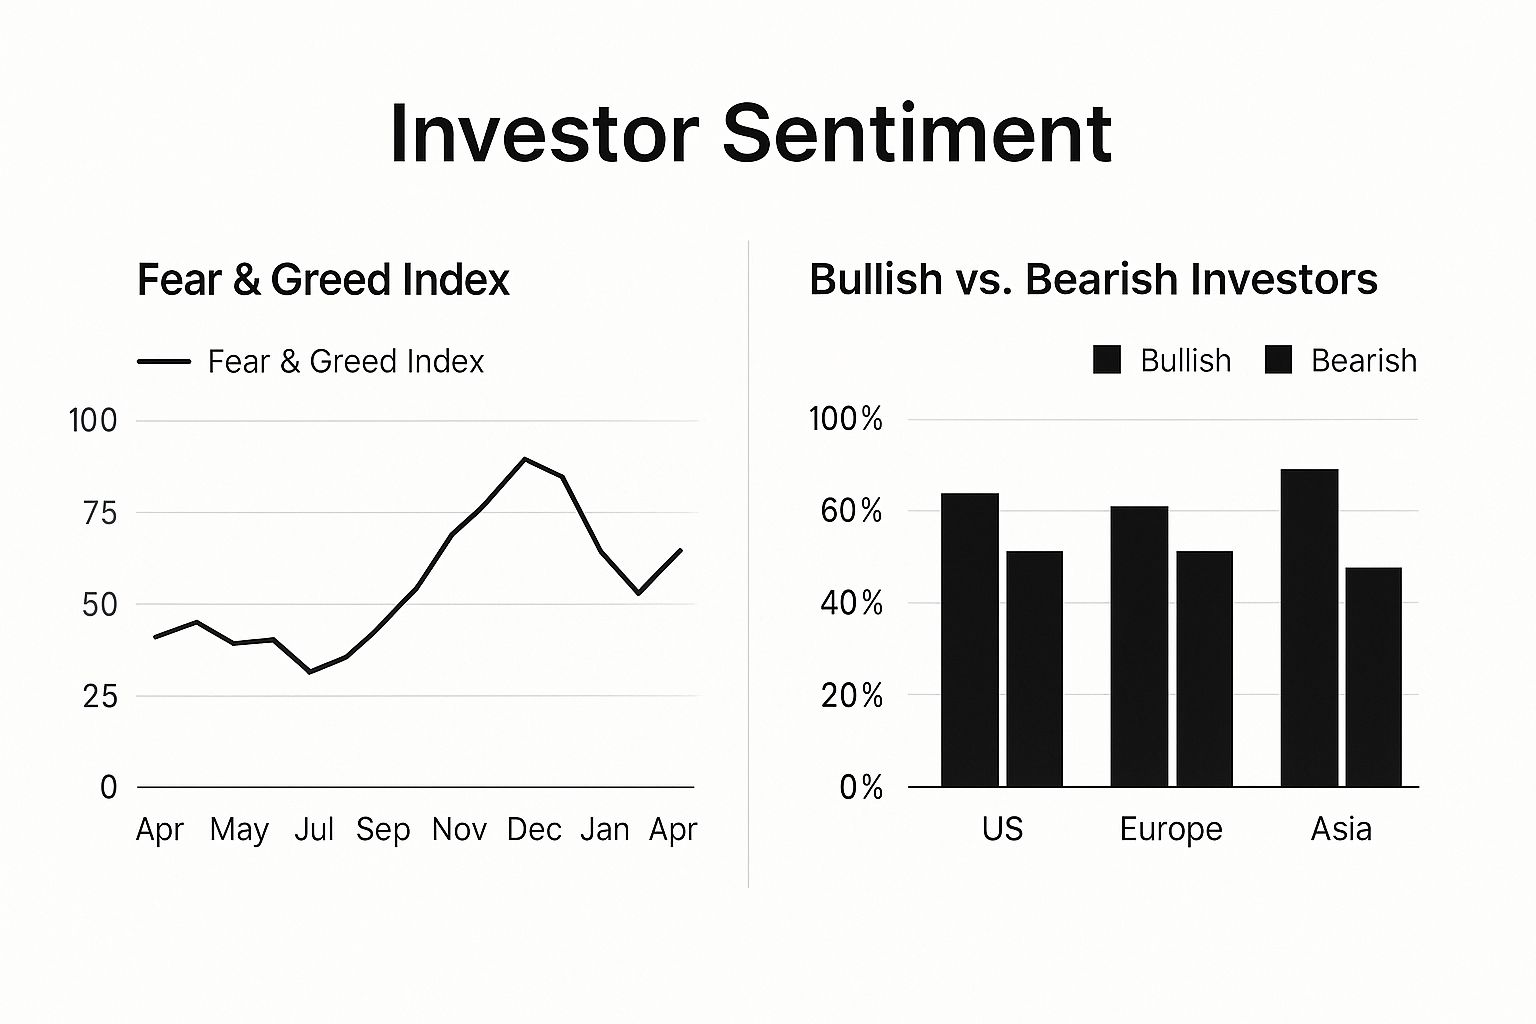
As you can see, the index captures the constant ebb and flow of investor emotion.
You can see for yourself how these forces interact by checking out a live Fear & Greed Index stock market tracker. Learning to interpret not just the final score, but what's driving it, will give you a much richer understanding of the market's psychological state.
Applying Market Sentiment to Your Investment Strategy
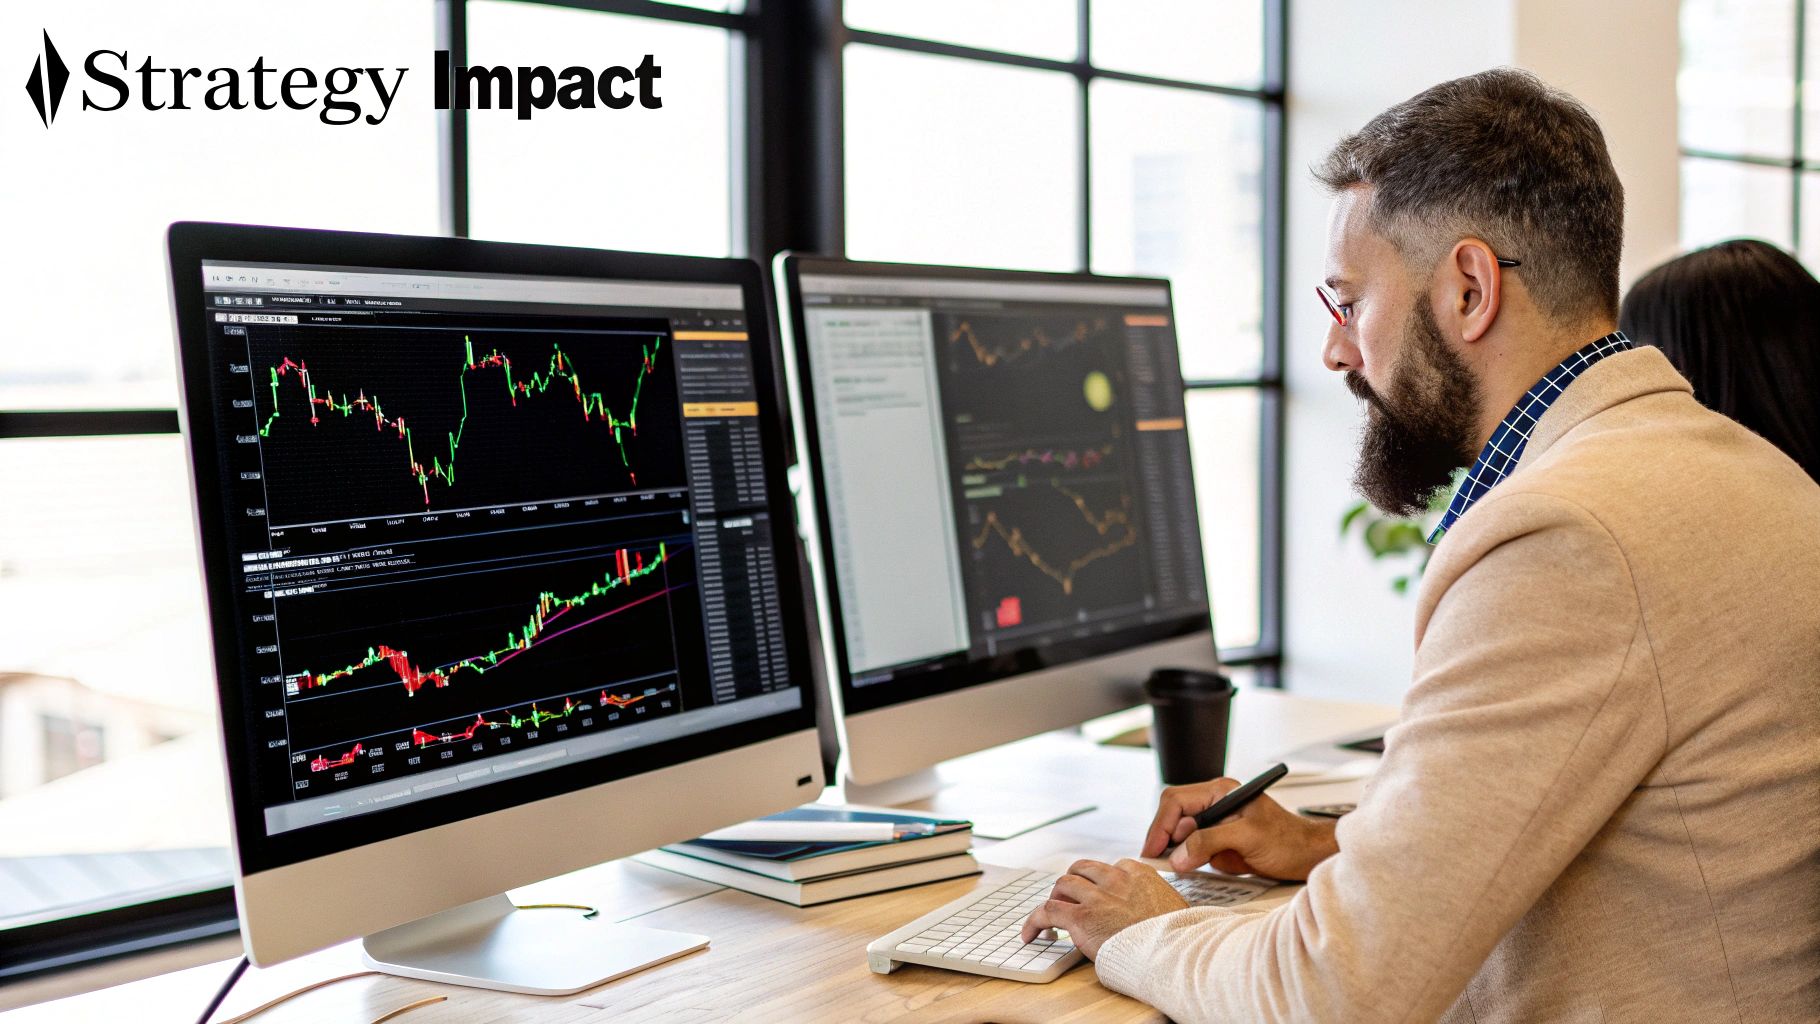
Alright, so you understand what market sentiment is and how it’s measured. That’s a great start. But the real magic happens when you move from knowing to doing. This is where you can start using the market's emotional swings to your advantage.
The core idea is captured perfectly by one of the most famous quotes in investing: "Be greedy when others are fearful, and fearful when others are greedy." This isn't just a catchy phrase; it's a powerful framework for contrarian investing. It’s about using the market’s emotional extremes as your signposts for when to buy and sell.
Adopting a Contrarian Mindset
So, what does it mean to be a contrarian? It’s simple: you deliberately go against the crowd. When everyone is euphoric and convinced a stock can only go up, a contrarian sees flashing warning lights. When panic fills the air and everyone is desperately selling, a contrarian smells opportunity.
Think of it this way. If everyone is already wildly optimistic and has bought in, who’s left to drive the price higher? The runway for growth just got a lot shorter. On the flip side, when absolute despair takes over and the last sellers have thrown in the towel, the downward pressure is exhausted. This can create a solid price floor.
This strategy uses sentiment indicators not as a crystal ball, but as a risk management tool. It helps you spot when the emotional pendulum has swung too far in one direction, signaling a potential reversal is on the deck.
Practical Scenarios for Using Sentiment
Let’s get concrete. How does this actually play out when you’re managing your portfolio? It’s all about adding context to your decisions.
Here are a couple of real-world scenarios:
When the Market is 'Extremely Greedy' Picture this: the Fear & Greed Index is screaming 85. The news is all sunshine and rainbows, and your friends won't stop bragging about their latest crypto gains. This is a textbook sign of extreme greed. A smart investor using sentiment data would see this as a time for caution. You might:
- Take some profits on positions that have had a massive run-up.
- Rebalance your portfolio, maybe shifting some money from high-flying tech stocks into something more stable.
- Hold off on making new, large investments until things cool down a bit.
When the Market is 'Extremely Fearful' Now, let's flip the script. The Fear & Greed Index has tanked to 10. Every headline is predicting doom, and a massive sell-off is underway. For a contrarian, this is a green light. It could be the perfect time to:
- Buy high-quality assets at a discount. This is when great companies effectively go "on sale" because of widespread panic.
- Start 'dollar-cost averaging' into stocks or funds you believe in for the long haul.
- Do your homework on companies that have been unfairly hammered in the sell-off.
Sentiment analysis is not a replacement for fundamental research; it's a powerful supplement. Fundamentals tell you what to buy. Sentiment helps you decide when to buy or sell it.
The Role of Sentiment in a Balanced Strategy
It’s crucial to remember that sentiment should never be the only reason you make a trade. Emotions can keep a market irrational longer than you can stay solvent. A market that looks "too greedy" can always get even greedier before it finally turns.
Your decisions should always be anchored in fundamentals—a company’s financial health, its edge over competitors, and its real-world growth prospects. Sentiment data is the final layer you add on top, giving you critical insight into timing and risk.
By weaving sentiment indicators into your process, you can sidestep two of the biggest traps for investors: buying at the peak of FOMO (fear of missing out) and panic-selling at the bottom. To go deeper on this, check out our guide, A Trader's Guide to the Fear and Greed Index. It will give you an even clearer picture of how to put these metrics to work.
Frequently Asked Questions About Market Sentiment
As you start to get a feel for market sentiment, it's natural for a few questions to pop up. It’s a pretty nuanced topic, and the small details are what make it so powerful. Here, we'll tackle some of the most common questions to clear up any lingering confusion and help you use these ideas with confidence.
Let's dive in and get you some clear, straightforward answers.
Is Market Sentiment the Same as Technical Analysis?
Not quite, but they work hand-in-hand. Think of them as a doctor-and-patient scenario.
Technical analysis is like reading the heart monitor. It’s all about the charts, patterns, and trading volume—the what. It shows you trends and potential entry or exit points based on what prices have done in the past.
Market sentiment, on the other hand, is the why. It’s the diagnosis that explains those heart monitor readings. It’s the collective fear or greed that’s actually causing the chart patterns to form. Sentiment indicators add a crucial layer of psychological context, helping you confirm or second-guess what the technicals are telling you.
For instance, a technical analyst might spot a classic bearish pattern forming on a chart. A quick glance at the Fear & Greed Index showing "Extreme Greed" would back up that bearish view, suggesting the market is overbought and probably due for a pullback.
Can Market Sentiment Predict a Stock Market Crash?
It can’t predict a crash with pinpoint accuracy, but it’s an incredibly powerful warning sign. It’s less of a crystal ball and more like a barometer measuring the atmospheric pressure before a big storm rolls in.
When you see extremely high levels of greed, euphoria, and just general complacency across multiple indicators, it often comes right before a major market correction. That’s because widespread optimism usually means the market has gotten speculative, overvalued, and totally detached from its underlying fundamentals.
Sentiment acts as an early-warning system for risk. When indicators are screaming "Extreme Greed," it's not giving you a date for the downturn, but it is signaling that the odds of a sharp, painful drop are much higher than normal.
On the flip side, moments of "Extreme Fear" can be a fantastic signal that a market bottom is getting close. When everyone has already panicked and sold, it often means the worst is over. It highlights periods of maximum opportunity, even if it doesn't name the exact day the market will turn around.
How Do I Know if Sentiment Is High or Low?
Knowing if sentiment is "high" (bullish) or "low" (bearish) is all about context. A single number doesn't mean much on its own; it’s just one data point in a much bigger story.
Here’s how to get that context:
- Look at Historical Averages: Compare the current number to its long-term average. If the AAII Bullish Sentiment is at 45% but its historical average is 37.5%, you know sentiment is running hotter than usual.
- Check Recent Ranges: See how the indicator has been moving over the past year or two. Is the current reading near the top or bottom of that range?
- Know the Extreme Thresholds: Many tools, like the Fear & Greed Index, have predefined zones. A score below 25 is typically "Extreme Fear," while a score above 75 signals "Extreme Greed." These tell you when the pendulum has swung way too far in one direction.
It's also smart to look at sentiment from a broader economic perspective. Consumer confidence, measured by global standards like the OECD’s Consumer Confidence Index (CCI), gives another angle. A CCI score above 100 signals optimism, while below 100 points to pessimism. For example, when the UK's GfK Consumer Confidence Index dropped to -19 in July 2025, it pointed to widespread caution, which was matched by a surge in savings—a classic sign of negative economic sentiment translating into real-world behavior. You can explore more about how these global economic indicators work and discover more insights on TradingEconomics.com.
How Often Should I Check Market Sentiment Indicators?
There’s no single right answer—it completely depends on your investing style and how long you plan to hold your positions.
For long-term investors, checking key indicators like the Fear & Greed Index or the AAII survey weekly or bi-weekly is usually enough. Your goal is to keep a general pulse on the market’s emotional state without getting bogged down in the daily noise. This helps you spot major emotional shifts that could signal big opportunities or risks on the horizon.
Day traders and swing traders, however, are playing a much faster game. They might watch indicators like the VIX or real-time put/call ratios multiple times a day. For them, small, immediate shifts in sentiment can be critical data for their very next trade.
Ready to stop guessing what the market is thinking? With the Fear Greed Tracker, you can access real-time sentiment scores for over 50,000 stocks and cryptocurrencies. Our platform transforms complex data into a clear, actionable score, helping you see when the market is fearful (and full of opportunity) or greedy (and full of risk). Make smarter, data-driven decisions and turn market emotion into your strategic advantage. Start tracking sentiment today at https://feargreedtracker.com.