
Let's get straight to it: day trading risk management isn't just a chapter in a textbook. It's the set of battlefield rules you live by to protect your capital. It’s not about dodging losses—losses are part of the game. It’s about making sure your wins are bigger than your losses, which is the only way to survive and thrive in this business.
Why Risk Management Is Your Most Important Trade
Here’s the unfiltered truth: most people who try day trading fail. Not because they can’t pick a winning stock—that's the easy part. They fail because they have zero plan for when a trade inevitably turns against them. One bad, unmanaged loss can vaporize weeks of hard-earned profits.
Think of it like a pilot's pre-flight check. A pilot with thousands of hours in the cockpit never skips the checklist. For a day trader, risk management is that checklist. It's not a "nice-to-have" safety net; it’s the core business plan that separates the pros from the gamblers.
The numbers tell a brutal story. Recent studies show that around 72% of day traders lose money. Only a tiny fraction—about 3%—manage to be consistently profitable. The dropout rate is just as stark. 40% of new traders are gone within a month, and after three years, just 13% are still trading.
This workflow breaks down the essential components of a solid risk management plan.

As you can see, it all starts with defining your risk. That single decision then dictates everything else, from how much you buy to where you get out.
The Four Pillars of Day Trading Risk Management
To build a trading career that lasts, you need to internalize four core principles. Think of them as the four legs of a table—if one is missing, the whole thing comes crashing down. Together, they create a defensive shield for your capital, keeping you in the game long enough to find your edge.
For a deeper dive, check out our complete guide on mastering risk management in trading.
Here's a quick look at these pillars and why each one is non-negotiable.
| Principle | What It Is | Why It Matters |
|---|---|---|
| The 1% Rule | A hard rule to never risk more than 1% of your total trading capital on a single trade. | It makes it mathematically impossible for one or two bad trades to wipe you out, ensuring you survive a losing streak. |
| Position Sizing | Calculating the exact number of shares to trade based on your risk tolerance and where your stop-loss is set. | It standardizes risk. A loss on a volatile, high-priced stock costs you the same as a loss on a stable, low-priced one. |
| Stop-Loss Orders | A pre-set order to automatically sell your position if it hits a specific price, locking in a small, defined loss. | It takes emotion out of the equation. You're no longer hoping a loser will "come back"—the decision is already made. |
| Risk-Reward Ratio | Comparing a trade's potential profit to its potential loss. Professionals won't touch anything less than a 1:2 ratio. | It ensures your winners pay for your losers, and then some. This is how you can be profitable even if you lose more trades than you win. |
Mastering these four pillars isn't about being scared or trading timidly. It’s about being a professional. It's about being precise, disciplined, and treating trading like a business where protecting your capital is always job number one.
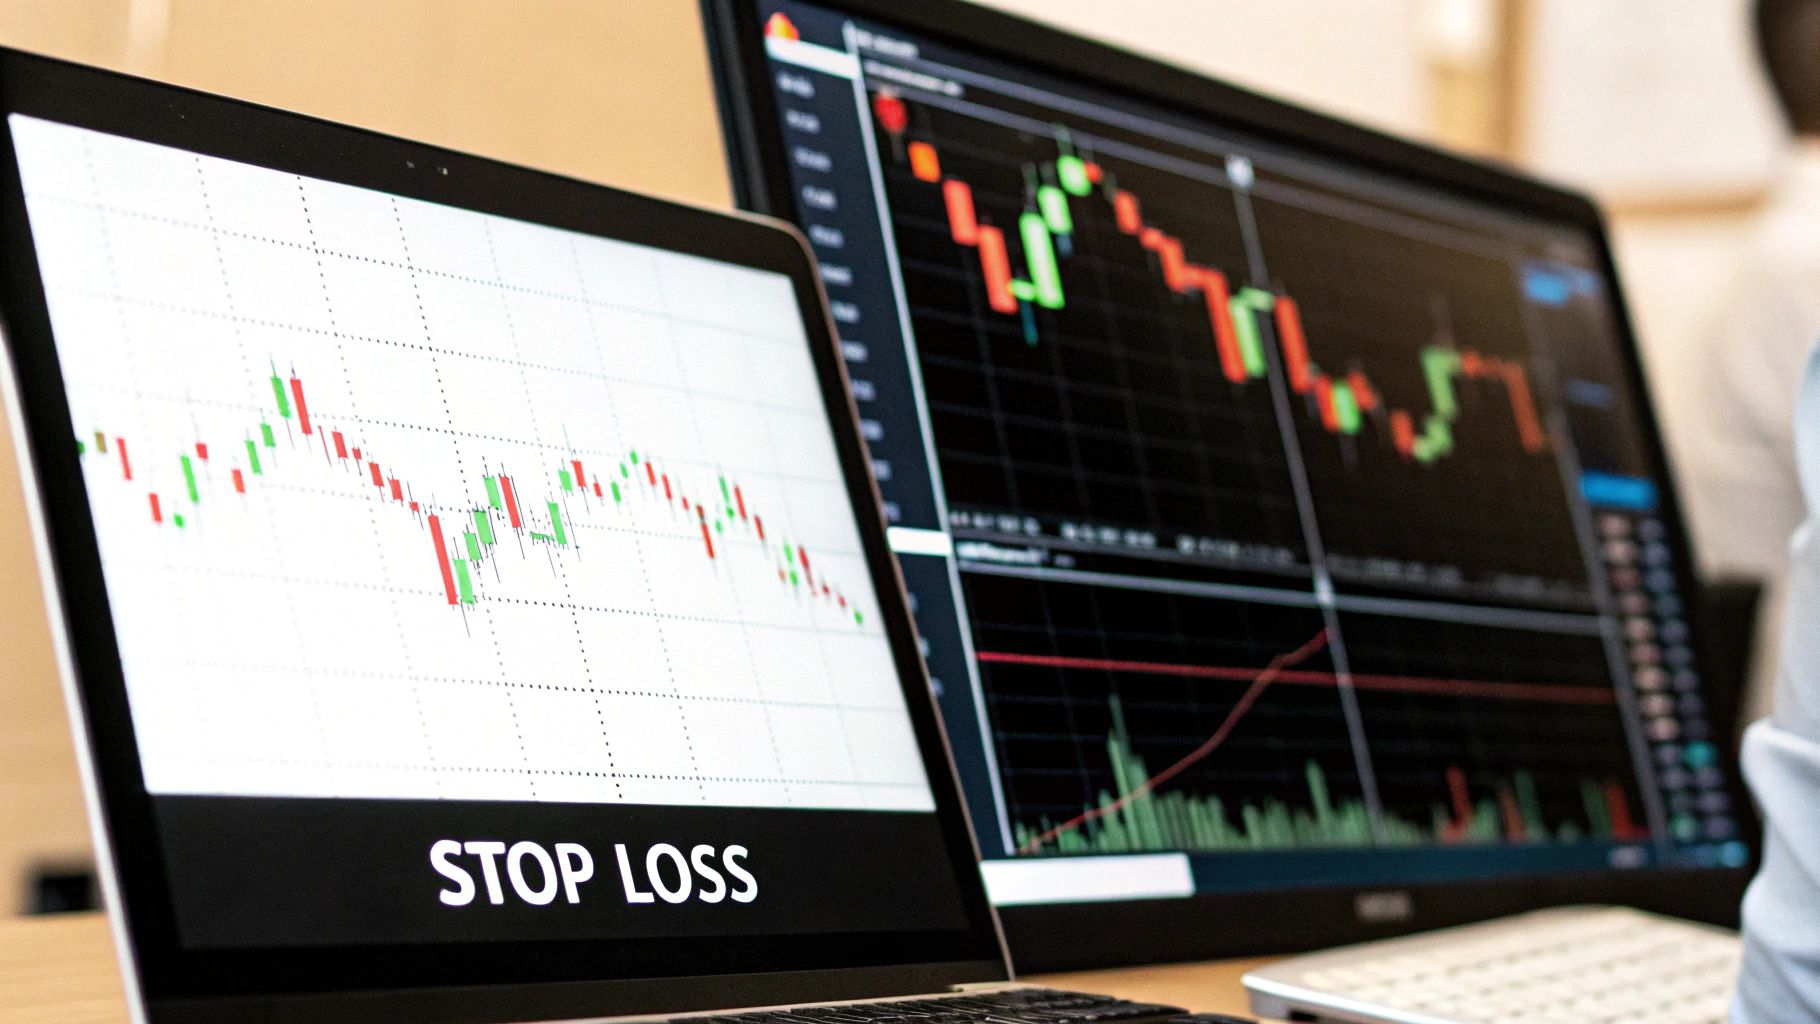
Setting Your Financial Eject Button with Stop Loss Orders
In the breakneck world of day trading, a stop-loss order is the single most important tool in your arsenal. Think of it like the eject button in a fighter jet. You set it before you even take off, hoping you never have to use it. But if things go sideways and the trade nosedives, you hit that button without a second thought to get out with a small, planned loss.
This isn't just about placing an order; it's about pre-committing to discipline. You're letting your logical, pre-trade brain make a binding decision for your future, emotional brain—the one that might be tempted to "just hold on a little longer" and hope for a miracle. And let’s be clear: hope is a disastrous trading strategy.
The need for this kind of mechanical rule is written in the history of the markets. Even during massive bull runs, traders without discipline get wiped out. Take the dot-com bubble of the late 1990s. As the S&P 500 and Nasdaq were screaming higher, a staggering 64% of day traders still lost money. As the data from that era on CurrentMarketValuation.com shows, making money isn't just about picking the right direction; it's about having rigid rules to protect yourself.
Placing Your Stop Like a Pro
Just pulling a number out of thin air—like deciding to sell if a stock drops 5%—is a classic rookie move. A pro's stop-loss is never arbitrary. It’s placed based on what the market structure is telling you, not a random guess.
Your goal is to set the stop at a logical point where, if the price hits it, your entire reason for taking the trade is officially proven wrong. This means using a bit of technical analysis to find key price levels.
- Support and Resistance Levels: This is the bread and butter of stop placement. If you buy a stock because it bounced cleanly off a strong support level, your stop goes just below that level. If the price breaks that support, your thesis is busted.
- Moving Averages: Key moving averages (like the 20-day or 50-day) often act as dynamic support or resistance. A solid strategy is to place your stop just on the other side of a major moving average that the price has been respecting.
- Volatility-Based Stops (ATR): The Average True Range (ATR) indicator is a fantastic tool that measures a stock's recent volatility. To avoid getting shaken out by normal, noisy price wiggles, you can set your stop at a multiple of the ATR (say, 2x ATR) below your entry. This gives the trade room to breathe based on its own typical behavior.
A stop-loss is not a suggestion; it's a rule. The moment you move your stop to give a losing trade more room, you've thrown your risk plan out the window and started gambling.
Different Types of Stop Orders
Not all stop orders are created equal. The one you choose depends on your strategy and what you’re trying to accomplish.
Standard Stop-Loss Order (Stop-Market)
This is the most basic version. When your stop price is hit, it triggers a market order to sell at the very next available price.
- Pro: It guarantees you get out of the trade. No questions asked.
- Con: In a very fast or gapping market, the price you actually sell at could be much worse than your stop price. This is called slippage.
Stop-Limit Order
This is a two-part order. When your stop price is hit, it triggers a limit order to sell, but only at your specified limit price or better.
- Pro: Protects you from getting a terrible fill during extreme volatility. You set the worst-case price you're willing to accept.
- Con: If the price plummets right past your limit price without trading at it, your order might never get filled. You could be stuck in an even bigger losing trade.
Trailing Stop-Loss
A trailing stop is a dynamic order that automatically moves up as the trade goes in your favor. You set it to "trail" the price by a certain dollar amount or percentage. For example, a $1 trailing stop on a stock bought at $50 will move up to protect a new price of $51 if the stock hits $52. If the price then falls back to $51, the stop triggers.
- Pro: It automatically locks in profits as a trade works for you, all while still protecting your downside.
- Con: A quick, sharp pullback can stop you out prematurely, kicking you out of a good trade that was just taking a breather.
Ultimately, the stop-loss is the foundation of your entire risk management plan. It’s what enforces discipline and ensures that no single bad trade can ever blow up your account.
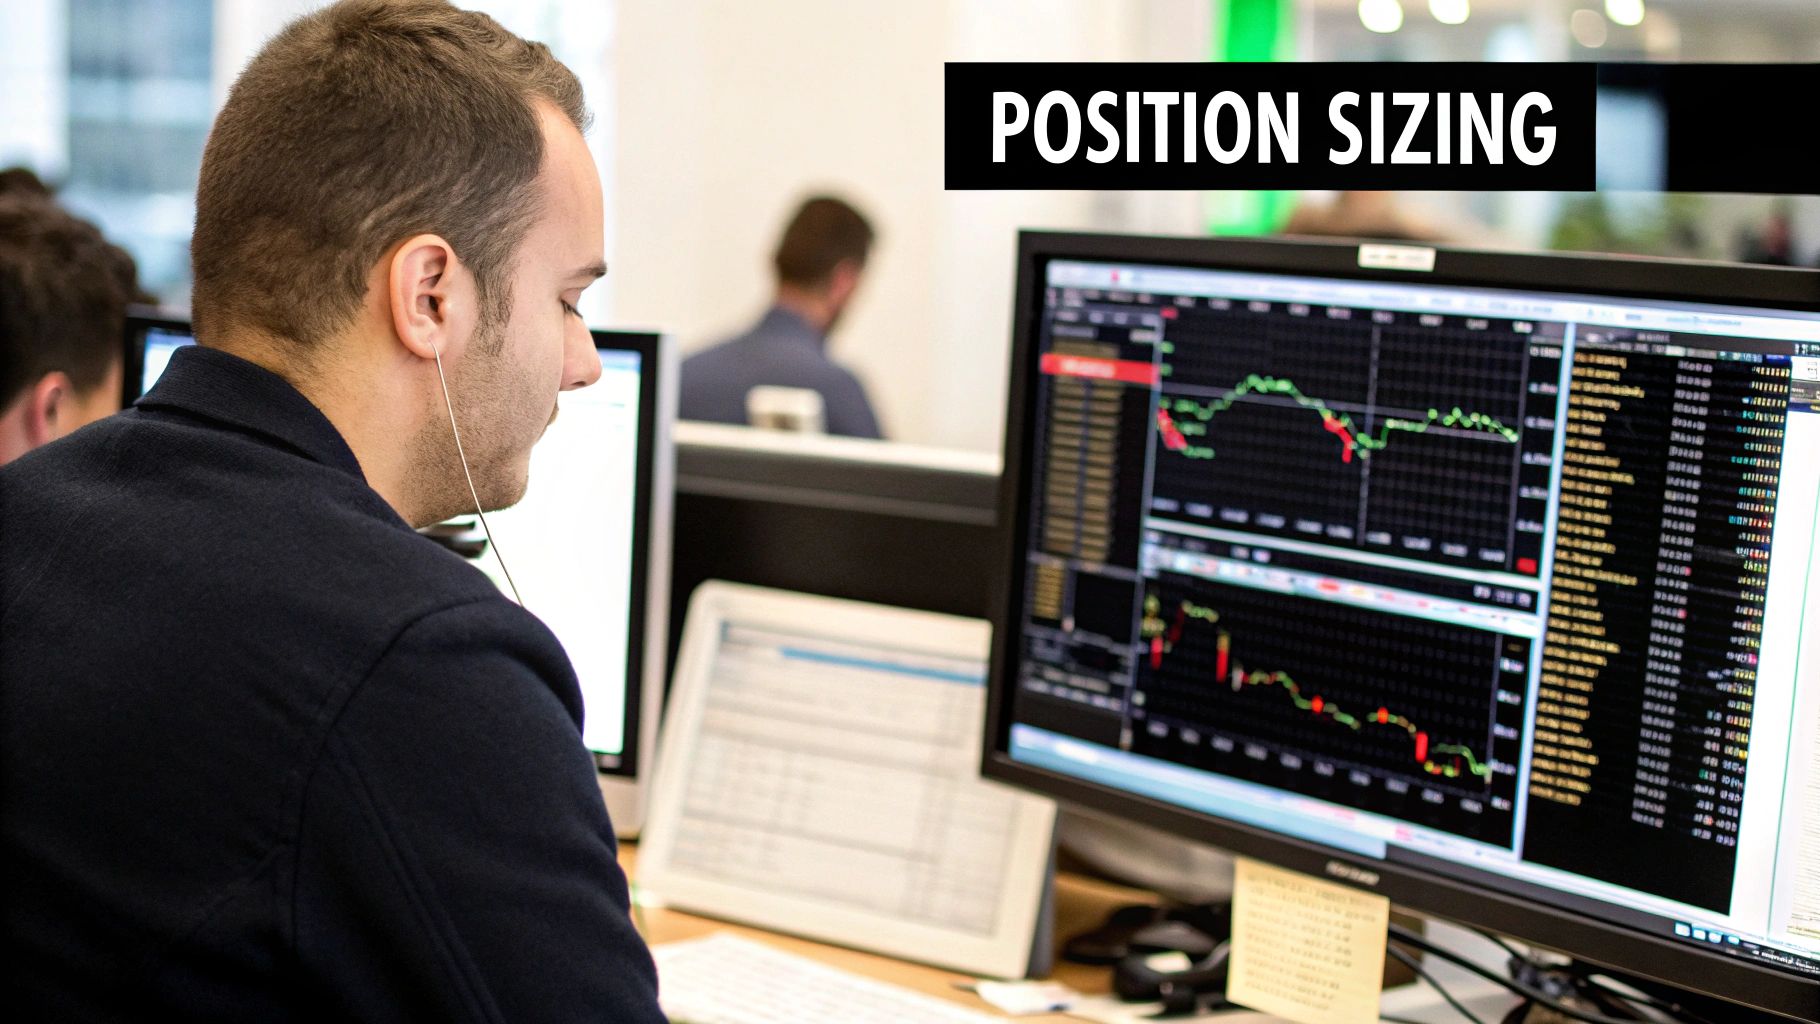
How to Calculate Position Size for Every Trade
Okay, you’ve set a hard stop-loss. That's your safety net. Now, we need to talk about position sizing. Think of it this way: if a stop-loss is your eject button, then position sizing is the control dial for how much is actually on the line. It's the single most powerful tool you have to make sure every trade carries the exact same, pre-planned dollar risk, no matter the stock's price or how wild its swings are.
So many new traders blow this part. They might risk a random percentage of their account that just feels right, or worse, buy a round number of shares like 100 or 500. This is pure gambling, not trading. A 5% loss on one trade might just be a scratch, but that same 5% loss on a position that takes up half your account? That’s a catastrophe in the making.
Proper position sizing takes the emotion and guesswork completely out of the equation. It turns trading into a calculated business where your risk is a fixed, manageable number every single time. It’s how a trader with a $10,000 account and another with a $50,000 account can enter the exact same trade and both risk an identical dollar amount, say $100.
The Core Position Sizing Formula
Figuring out your position size is a simple, three-step math problem. You just need to know three numbers before you even dream of hitting the "buy" button.
- Maximum Account Risk: How much, in dollars, are you willing to lose on this one trade? For most disciplined traders, this is guided by the 1% rule—never risk more than 1% of your total trading capital on a single idea.
- Trade Entry Price: Simple enough. This is the price where you plan to buy the stock.
- Stop-Loss Price: The price where your trade idea is proven wrong, and you get out. This is determined by your technical analysis, not a random guess.
The gap between your entry and stop-loss is your per-share risk. It’s the amount you stand to lose on each share if the trade goes south.
Your ideal position size is never based on how much you think you can make. It's determined entirely by how much you are willing to lose if you are wrong. This mental shift is fundamental to long-term survival.
With those numbers plugged in, the formula is straightforward:
Position Size (Number of Shares) = (Total Account Risk in $) / (Entry Price - Stop-Loss Price)
This simple calculation ensures your total potential loss is locked in at your predetermined comfort level, no matter what the market throws at you.
Position Sizing in Action
Let's walk through a couple of real-world examples to see this in practice. Imagine two traders, both sticking to the 1% risk rule.
Trader A: The Smaller Account
- Account Size: $10,000
- Max Risk (1%): $100
- Trade Idea: Buy XYZ stock at $50.00
- Stop-Loss: Set just below a support level at $49.50
First, let's find the per-share risk:$50.00 (Entry) - $49.50 (Stop) = $0.50 per share risk
Now, we use the position sizing formula:$100 (Max Risk) / $0.50 (Per-Share Risk) = 200 shares
Trader A should buy 200 shares of XYZ. If the trade hits the stop-loss, the loss will be exactly $100 (200 shares x $0.50 loss), which is precisely 1% of the account.
Trader B: The Larger Account
- Account Size: $50,000
- Max Risk (1%): $500
- Trade Idea: Same trade—buy XYZ at $50.00 with a stop at $49.50
The per-share risk is identical: $0.50.$500 (Max Risk) / $0.50 (Per-Share Risk) = 1,000 shares
Trader B should buy 1,000 shares. If the stop is triggered, their loss is $500 (1,000 shares x $0.50 loss), which is also exactly 1% of their account. This is the power of methodical risk management in action.
Using The Risk-To-Reward Ratio for Smart Trade Selection
Let’s be honest: winning every single trade is a pipe dream. The real secret to successful day trading isn't about having a flawless record. It’s about making sure your winning trades are big enough to more than cover your losing ones.
This is where the risk-to-reward ratio comes into play. Think of it as the business plan for every single trade you take. It forces you to ask one simple, powerful question before you click "buy": Is the potential reward actually worth the risk? If the answer isn't a clear and confident "yes," you walk away. No exceptions.
It’s a bit like how a casino operates. The house doesn't win every hand of poker, but it has a built-in mathematical edge that guarantees it profits over the long run. A solid risk-to-reward ratio is your personal house edge, giving you a statistical advantage that pays off over hundreds of trades.
Calculating Your Trade's Odds
Figuring out this ratio is refreshingly simple. You just need three key numbers, all of which you should have locked in before you enter a trade:
- Entry Price: The price where you buy the stock.
- Stop-Loss Price: Your pre-planned exit if the trade turns against you.
- Profit Target: A realistic price where you intend to take your profits.
Here’s the formula:
Risk-to-Reward Ratio = (Profit Target - Entry Price) / (Entry Price - Stop-Loss Price)
Let's walk through a quick example. Imagine you want to buy a stock trading at $25. Your chart analysis shows a solid support level at $24.50, so you place your stop-loss just below it. That means your total risk per share is $0.50. You also spot a key resistance level at $26.50, making it a logical profit target. Your potential reward is $1.50 per share.
Plugging this into the formula, your risk-to-reward ratio is $1.50 (Reward) / $0.50 (Risk), which simplifies to a clean 1:3 ratio. That’s an excellent setup.
A foundational rule for professional traders is insisting on a minimum risk-to-reward ratio of 1:2. This means for every $1 you risk, you stand to make at least $2. This discipline is what allows you to stay profitable even if you lose more trades than you win.
Why a Favorable Ratio Is Everything
The real magic of this concept is the impact it has on your bottom line. It completely shifts your focus from the impossible goal of being perfect to the achievable goal of being profitable. This mindset is what separates traders who last from those who burn out.
To see just how powerful this is, let's look at how different ratios affect profitability.
Impact of Risk-Reward Ratio on Profitability (Assuming 100 Trades & $100 Risk per Trade)
This table breaks down how your win rate and risk-reward ratio work together to determine your net profit. Notice how a better ratio can turn a losing strategy into a winning one.
| Win Rate | Risk-Reward Ratio | Winning Trades Profit | Losing Trades Loss | Net Profit/Loss |
|---|---|---|---|---|
| 40% | 1:1 | $4,000 | -$6,000 | -$2,000 |
| 40% | 1:2 | $8,000 | -$6,000 | $2,000 |
| 40% | 1:3 | $12,000 | -$6,000 | $6,000 |
| 55% | 1:1 | $5,500 | -$4,500 | $1,000 |
| 55% | 1:2 | $11,000 | -$4,500 | $6,500 |
The numbers don't lie. A trader with a subpar 40% win rate actually loses money with a 1:1 ratio. But by only taking trades with a 1:3 ratio, that same trader becomes highly profitable. This mathematical edge is the cornerstone of consistent trading.
Of course, setting realistic profit targets is a huge part of this. To get a better feel for market psychology and whether a trend has room to run, you can learn more about using the Stock Fear and Greed Index to your advantage.
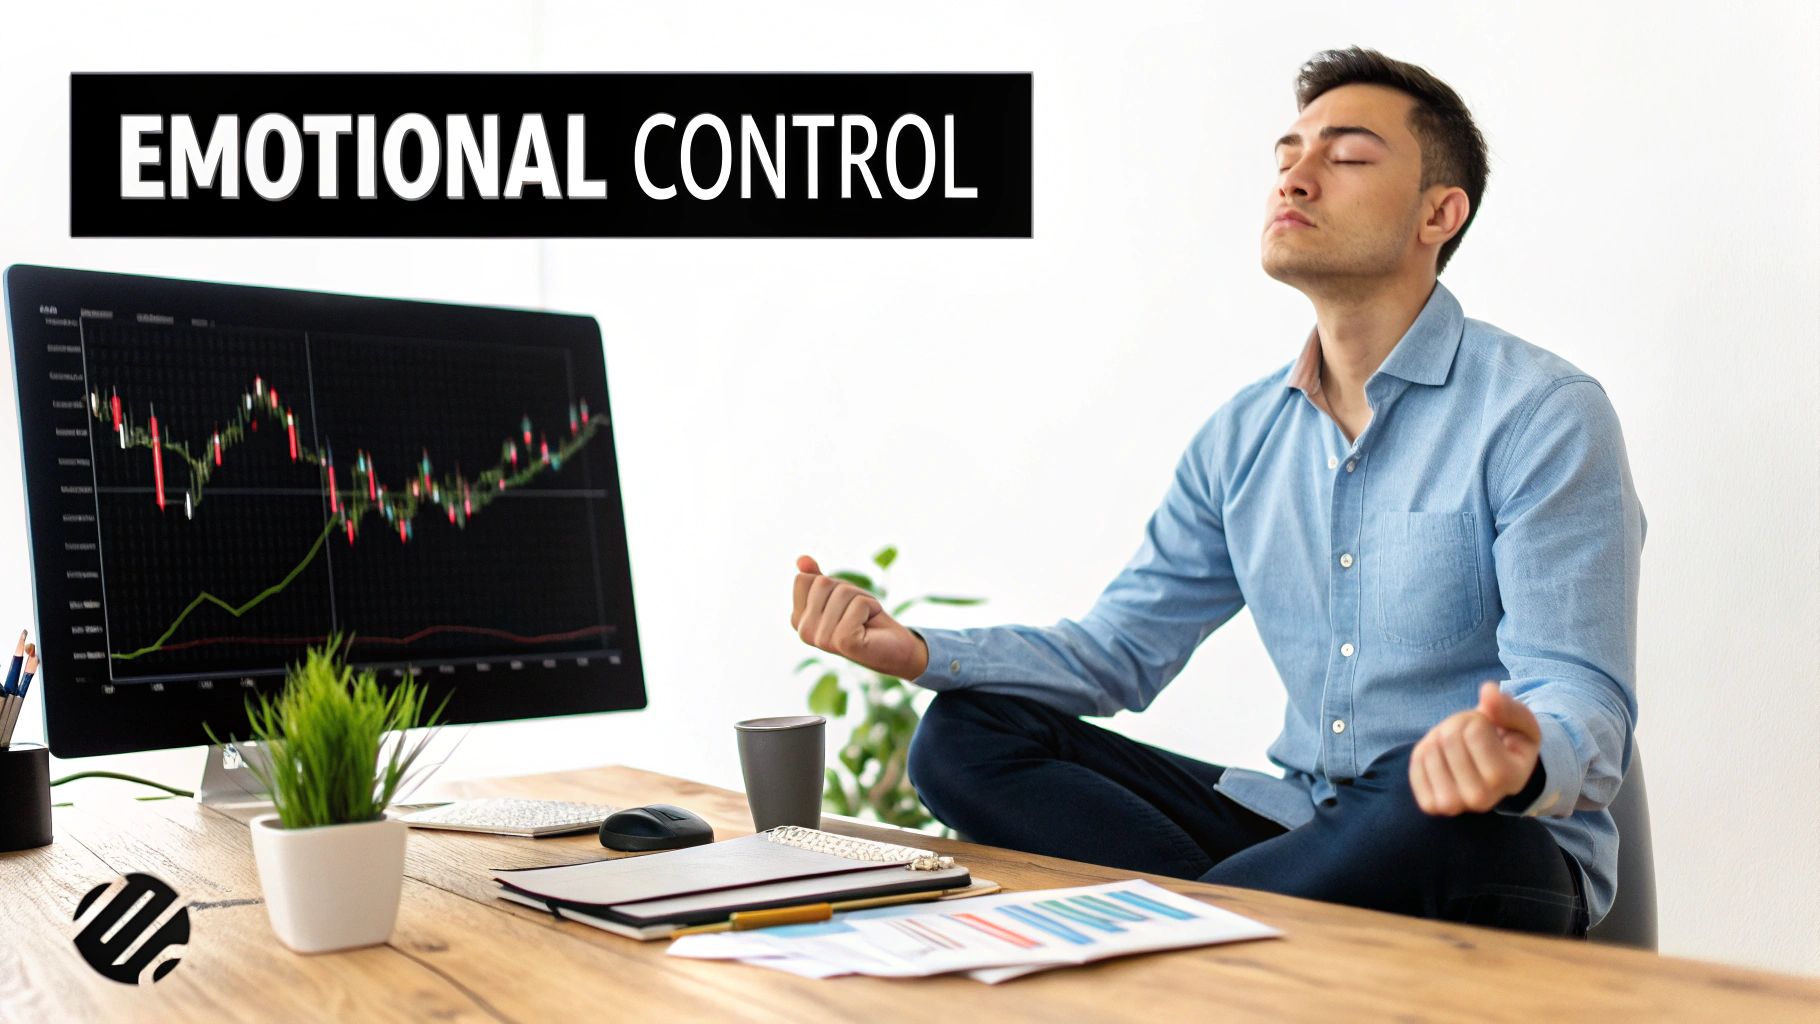
Mastering the Psychology of Day Trading Risk
You can have the most sophisticated stop-loss strategy and a flawless position-sizing formula, but none of it matters if you can't control the one variable that truly matters: yourself. The best day trading risk management plan is useless if you abandon it in the heat of the moment. This is where the real work begins—taming the powerful emotions that can sabotage even the most brilliant technical setup.
Think of an elite athlete in a high-stakes game. They don’t let fear or excitement dictate their next move. Instead, they fall back on thousands of hours of training and muscle memory. For a trader, that training is your risk management plan. Your job is to trust it, especially when your gut is screaming at you to do the exact opposite.
Confronting Your Cognitive Biases
The most common trading mistakes aren't random. They're predictable psychological traps, or cognitive biases, that every single trader has to face. Spotting them in your own behavior is the first step to beating them.
- FOMO (Fear of Missing Out): You see a stock rocketing higher and jump in without a plan, terrified of missing out on easy gains. This almost always leads to buying at the top, right before a painful reversal.
- Revenge Trading: After a frustrating loss, you immediately dive into another, often larger, trade to "make your money back." This is a trade driven by anger, not strategy, and it’s a fast track to even bigger losses.
- Greed: A trade is going your way and hits your profit target. But you don't sell. You get greedy, holding on for just a little more, only to watch it reverse and turn a solid win into a breakeven or even a loss.
These aren't personal failings; they're hardwired human responses. The trick is to build systems that protect you from these impulses when you're most vulnerable.
A trading plan is a contract you make with yourself when you are rational, to protect you from the decisions you might make when you are emotional. Honoring that contract is the definition of discipline.
Forging Your Mental Armor
Discipline isn't something you're born with. It's a muscle you build through consistent practice and practical habits. At its core, effective day trading risk management is about managing your own psychology with a few non-negotiable rules.
Start by keeping a detailed trading journal. Don't just log your entries and exits. Write down why you took the trade and, just as importantly, how you felt during it. Were you anxious? Overconfident? Bored? This simple practice will reveal emotional patterns you never knew you had, linking specific feelings to costly mistakes.
Another critical step is setting a hard daily loss limit. This is your "game over" number for the day. If your net losses hit this amount—say, 2% of your account—you shut down your platform and walk away. No exceptions. This single rule is your best defense against the downward spiral of revenge trading. It ensures one bad day doesn't bleed into a week-long disaster.
You can also use objective data to ground your decisions and fight back against emotional biases. Below is a snapshot from our Fear & Greed Tracker, which measures real-time market sentiment.
This tool shows you whether the broader market is acting out of extreme fear or excessive greed. Using this data can provide an objective check against your own feelings. It helps you question whether your urge to buy is based on a solid setup or if you're just getting swept up in widespread FOMO.
You can learn more about how to use market sentiment analysis for trading to refine this approach. In the end, mastering risk is really about mastering yourself.
Lessons Learned from Major Market Crises
Every risk management rule day traders live by today was written in the wreckage of yesterday’s market disasters. The principles we treat as gospel—like hard stop-losses and strict position sizing—weren't dreamt up in a comfortable office. They were forged in the fire of financial meltdowns that wiped out anyone who wasn't prepared.
Think of these events as the ultimate case studies. They show us, in brutal detail, why risk management isn't just a good idea. It's the hard-won wisdom that separates a short-lived thrill ride from a long-term trading career.
Black Swans and the New Normal
The Dot-Com Bubble of the early 2000s delivered a painful lesson in what happens when irrational hype meets reality. When the music stopped, tech stocks that felt unstoppable suddenly plunged 80% or more. Many went to zero. Traders who bought into the "this time it's different" narrative and ditched their risk plans saw their accounts vaporize.
This crash hammered home a timeless truth: any stock, no matter how popular, can fail catastrophically. It was this painful awakening that led to the widespread adoption of trailing stops and more disciplined profit-taking strategies, all designed to lock in gains before a trend violently reverses.
Then came the 2008 Financial Crisis, which introduced the world to the "black swan" event—a high-impact disaster that no conventional model saw coming. The collapse of Lehman Brothers sent a tidal wave of panic across the globe, proving that institutions once considered "too big to fail" could, in fact, shatter.
This crisis changed how we think about risk forever. It taught us that we have to plan for the "impossible" and that a problem in one corner of the market can spread like a virus, infecting everything.
From Crisis to Modern Best Practices
These historic meltdowns were the direct catalysts for the risk management tools we rely on today. Studies of events like the 1987 crash, the Dot-Com Bubble, and the 2008 crisis reveal how profoundly they reshaped trader behavior and regulation. The 2008 crisis, in particular, forced regulators to demand stricter capital reserves and more transparency to prevent the same kind of reckless risk-taking from happening again. You can dig deeper into the history of day trading at QuantifiedStrategies.com to see this evolution.
This painful evolution gave us the core defenses that protect modern traders:
- Stress Testing: We now run simulations to see how our portfolios would hold up under extreme scenarios, essentially re-living past crises to find weak spots before they become real problems.
- Systemic Risk Awareness: There’s a much deeper understanding that risk isn’t isolated. A crisis in the housing market, as we saw in 2008, can easily ignite a domino effect across the entire financial system.
- Mandatory Discipline: The scars from these disasters are precisely why rules like the 1% rule and non-negotiable stop-losses are so critical. They are your shield against the market's inherent unpredictability.
Studying these past blow-ups isn't just a history lesson. It’s about arming yourself with the crucial context behind the rules that will protect your capital when the next market storm inevitably hits.
Common Questions About Day Trading Risk Management
You can understand all the rules of risk management, but putting them into practice when the market is moving is a different beast entirely. It’s normal to have questions when you’re trying to connect the theory to your actual trading screen.
Let’s clear up some of the most common sticking points traders run into. Think of this as your practical, no-fluff guide to turning those core principles into confident action.
What Is the 1 Percent Risk Rule and Should I Always Follow It?
The 1% rule is a simple but powerful guideline: never put more than 1% of your total trading capital on the line for any single trade. If you have a $20,000 account, this means the most you can afford to lose on one position is $200.
For anyone new to trading, this rule isn't just a suggestion—it's your lifeline. Its entire purpose is to make sure you can survive a nasty losing streak without blowing up your account. A string of five, seven, or even ten bad trades in a row is a reality every trader faces, and this rule ensures you live to trade another day.
Once you have a proven strategy and months of experience, you might see some pros adjust this to 1.5% or even 2% for their highest-conviction setups. But anything over 2% is just gambling, not trading.
My Stop Loss Keeps Getting Hit Right Before the Price Reverses
This is one of the most maddening things in trading. You get "shaken out" of a trade, only to watch it immediately rocket in the direction you predicted. It’s a classic sign that your stop-loss is sitting in an obvious, predictable spot.
Amateurs love to place stops at clean, round numbers or obvious support levels. This makes them easy targets for institutional algorithms designed to hunt for liquidity by triggering these clusters of stop orders.
The fix? Stop basing your stop-loss on a random price point and start basing it on the market's actual volatility. The Average True Range (ATR) indicator is the perfect tool for this.
Instead of guessing, try placing your stop 1.5x or 2x the current ATR value away from your entry. This gives the trade enough breathing room to handle the market's normal noise and wiggles, tailoring your risk to that specific stock's behavior. It also forces you to think twice before chasing a trade that has already run up too far, making you less vulnerable to a quick pullback.
How Do I Manage Risk When a Stock Gaps Against My Position Overnight?
An overnight gap is a day trader’s nightmare, and your standard stop-loss is useless against it. If bad news hits after hours and the stock opens way below your stop, your order will execute at the first available price—potentially creating a loss far larger than you ever planned for.
There’s only one foolproof way to handle this risk: don't hold day trades overnight.
True day trading means you are 100% flat—all positions closed—before the market shuts down. This completely removes the risk of an earnings bomb or unexpected news causing a catastrophic gap against you. If your strategy requires holding for multiple days (that’s swing trading, not day trading), you have to bake in that gap risk by trading significantly smaller position sizes.
Want to get an edge by seeing what the rest of the market is thinking? The Fear Greed Tracker analyzes real-time sentiment for over 50,000 assets using 16 unique data points. It's a powerful way to add a layer of market psychology to your risk management decisions. See today's market sentiment on feargreedtracker.com.