
The stock fear and greed index is a fascinating tool. It boils down seven critical market indicators into a single score that tells you just how fearful or greedy investors are getting. Think of it as a contrarian’s cheat sheet, flagging potential buying opportunities when everyone is panicking or selling signals when euphoria takes over.
Decoding The Market’s Emotional Pulse
Imagine the index as the market’s collective mood ring. It won’t predict the future with 100% certainty, but it gives you a surprisingly clear snapshot of the dominant emotion—panic or euphoria—that’s driving decisions at any given moment.
This is a huge deal, because extreme emotions almost always come before major market shifts. When investors get overwhelmingly greedy, they start ignoring risks and chase prices to levels that just aren't sustainable. On the flip side, when fear grips the market, they often sell everything in sight, pushing prices far below what they're actually worth.
Capitalizing On Market Emotions
This is where you can put the timeless wisdom of legendary investors like Warren Buffett into practice. His famous advice, "be fearful when others are greedy and greedy when others are fearful," is the perfect playbook for using the index.
The index essentially quantifies that exact principle. When the score drops, signaling widespread fear, it’s like a green light for disciplined investors to start hunting for bargains. When it soars, showing too much greed, it’s a warning sign to maybe take some chips off the table. You can dive much deeper into this strategy in our complete trader's guide to stock market fear and greed.
The index has proven its worth time and again during major market events. For instance, during the 2008 global financial crisis, it cratered to a low of 12. In March 2020, as the COVID-19 pandemic took hold, it hit an unbelievable low of 2, reflecting pure panic. Conversely, during the 2017 tech rally, it soared above 80, screaming exuberant greed.
By understanding what drives these scores, you gain a massive strategic edge. Instead of getting swept up by the emotional tide, you can use it to your advantage.
The core idea is simple: The stock fear and greed index helps you identify when the market’s emotional pendulum has swung too far in one direction, creating potential opportunities for those who remain rational.
Interpreting Stock Fear And Greed Index Scores
To make this even more practical, let’s break down what the different score ranges mean. This table is a quick reference guide to help you translate the index's number into a potential market condition.
| Score Range | Sentiment Level | Potential Market Condition |
|---|---|---|
| 0-24 | Extreme Fear | The market is in panic mode. Potentially undervalued, may be a buying opportunity. |
| 25-49 | Fear | Investors are cautious and risk-averse. Stocks may be fairly or slightly undervalued. |
| 50 | Neutral | Sentiment is balanced. The market is not driven by strong emotion. |
| 51-75 | Greed | Investors are optimistic and buying aggressively. Stocks may be overvalued. |
| 76-100 | Extreme Greed | Euphoria has set in. The market may be in a bubble, signaling a potential correction. |
Knowing these levels helps you move from just seeing a score to understanding its implications and making smarter, more level-headed decisions in your own investment framework.
Deconstructing The 7 Signals Behind The Index
The Stock Fear & Greed Index isn't just a number pulled from thin air; it’s a sophisticated score calculated from seven distinct market indicators. Each one provides a unique lens into investor emotion. When you put them all together, you get a remarkably clear picture of whether the market is in the grip of fear or running hot with greed.
To really get what the index is telling you, you need to lift the hood and look at the engine. Think of these seven components as key witnesses in a case to determine the market’s psychological state.
The concept map below shows you how major pieces like Market Momentum, Stock Price Strength, and Volatility all feed into that single, powerful score.
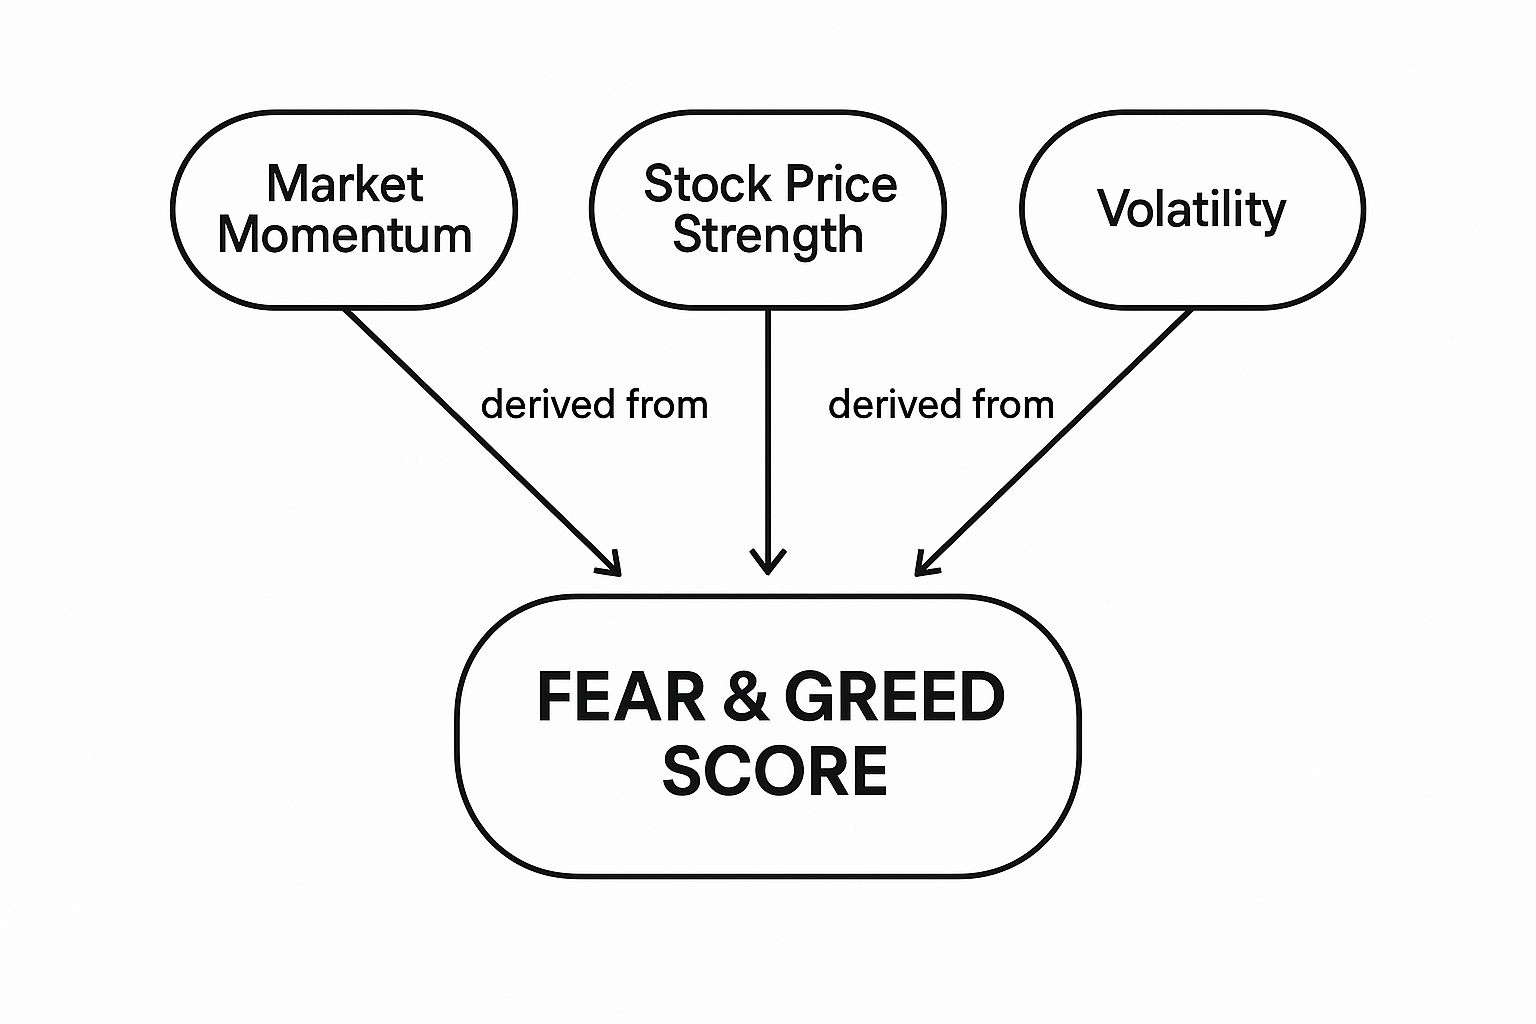
This visual shows the index isn’t just based on one feeling. It's a composite measure, which is what makes its final reading so robust and reliable.
1. Stock Price Momentum
First up is Stock Price Momentum. This basically acts as the market’s report card, comparing the S&P 500 to its 125-day moving average. It’s a simple way to see if the market is outperforming its recent history.
When the S&P 500 is trading well above that long-term average, it’s a sign of strong positive momentum. This points directly to greed—investors are feeling good and confidently bidding prices higher.
But if the index slips below its 125-day average, momentum is fading. That’s a clear signal of growing fear as caution begins to creep in and selling pressure builds.
2. Stock Price Strength
Next, we look at Stock Price Strength. This indicator digs a bit deeper by comparing the number of stocks hitting 52-week highs versus those hitting 52-week lows on the New York Stock Exchange (NYSE).
A healthy, broad-based rally should have a ton of stocks hitting new highs. It shows widespread confidence and is a classic sign of greed.
The big red flag is when a few mega-cap stocks are propping up the index while an army of smaller stocks is hitting 52-week lows. This divergence screams underlying weakness and rising fear, suggesting the rally is built on shaky ground.
Key Insight: A market where more stocks are hitting new lows than highs, even if the main index is up, is a market running on fear, not fundamentals. It signals that investors are losing confidence in the broader market's health.
3. Stock Price Breadth
Closely related is Stock Price Breadth, which analyzes the trading volume of rising stocks versus falling stocks. It uses the McClellan Volume Summation Index to see where the real money is flowing.
Is a high volume of shares being traded in advancing stocks? That means a broad base of investors is enthusiastically joining the party—a clear indicator of greed.
On the flip side, if declining stocks are seeing more trading action, it shows conviction is behind the selling. This signals widespread fear as investors scramble to get out.
4. Put And Call Options
The options market is a fantastic window into what traders are actually betting on. This signal looks at the put/call ratio, comparing the trading volume of bearish put options (a bet prices will fall) to bullish call options (a bet prices will rise).
When investors are buying way more calls than puts, the ratio is low. It reflects extreme optimism and a carefree attitude, pointing straight to greed.
Conversely, a high put/call ratio is a textbook sign of fear. It means investors are actively buying "insurance" in the form of puts to protect themselves against a potential market drop.
5. Junk Bond Demand
Believe it or not, the demand for high-yield "junk" bonds is an incredible gauge of the market's appetite for risk. This indicator measures the spread, or yield difference, between risky junk bonds and safe investment-grade corporate bonds.
When investors are feeling greedy, they’re happy to take on the extra risk of junk bonds for a better return. This closes the yield spread and signals greed.
But when fear takes hold, investors flee to safety. They dump their junk bonds, causing the spread to widen dramatically as they demand a much higher premium for taking risks. That’s a clear signal of fear.
6. Market Volatility (VIX)
You’ve probably heard of this one. The Market Volatility Index (VIX), often called the "fear gauge," measures the market's expectation of volatility over the next 30 days.
A low VIX reading suggests investors are complacent and expecting smooth sailing. This lack of worry is a hallmark of greed.
In contrast, a spiking VIX shows investors are bracing for turbulence and big price swings. This surge in expected volatility is a direct measure of market fear.
7. Safe Haven Demand
Finally, Safe Haven Demand looks at the performance of stocks versus treasury bonds over the last 20 trading days. It tracks the classic "flight to safety."
During periods of greed, investors pour money into stocks, which tend to outperform safer bonds as everyone chases growth.
But when fear grips the market, the opposite happens. Investors sell stocks and pile into safe-haven assets like treasury bonds to protect their capital. When bonds start outperforming stocks, it’s a sure sign that risk aversion is the dominant emotion.
How To Interpret What The Index Is Telling You
Knowing what the seven indicators mean is one thing. But translating the final stock fear and greed index score into a real strategy? That’s where the magic happens. The real power of this tool comes alive when you can look at the daily number and understand what it’s telling you about the market's next move.
Think of the index less like a crystal ball and more like a barometer for market pressure. It operates on a simple 0-100 scale, where each level reveals the emotional state driving investors.
Reading The Extremes: Fear Versus Greed
The most powerful signals flash at the emotional extremes. These are the moments when the market’s collective mood swings too far in one direction, creating incredible opportunities for disciplined investors who know what to look for.
A score dropping toward 0 signals Extreme Fear. This is where panic selling takes over and investors start dumping assets, often without thinking. It’s chaotic, sure, but it’s exactly the environment value investors crave—quality assets often go on sale.
On the other hand, a score climbing toward 100 screams Extreme Greed. This is the peak of market euphoria. Investors chase returns with little regard for risk, and the fear of missing out (FOMO) is palpable. For a savvy investor, this is a blaring warning that the market might be overheated and due for a pullback.
Contrarian Insight: The stock fear and greed index isn't a tool for following the herd. It’s a roadmap for doing the opposite. Extreme fear often signals a potential buying opportunity, while extreme greed warns that it might be time to take profits or play defense.
The Neutral Zone: Consolidation And Confirmation
Not every signal is a fire alarm. The "Neutral" zone, typically around a score of 45 to 55, offers its own brand of valuable insight. When the index hangs out in this middle ground, it usually points to a period of market consolidation.
During this phase, emotions are balanced. Neither buyers nor sellers have the upper hand. It’s the market taking a breather, digesting recent moves before deciding where to go next.
A neutral reading can also confirm a trend’s health. If the market is in a steady uptrend but the index stays neutral or just slightly greedy—not extremely so—it suggests the rally is sustainable and not fueled by wild emotion. You can dive deeper into this idea in our guide on how to use market sentiment analysis for trading.
Understanding Historical Context
To truly master this tool, you need to see the bigger picture. A deep dive into the CNN Fear and Greed Index from 2011 to mid-2025 shows an average value of 49.09—almost perfectly neutral. Over that time, it hit 0 (maximum fear) and peaked at 97 (extreme greed).
What’s really interesting is how often these extremes occurred. Markets registered extreme fear on about 15% of days, while extreme greed only appeared 10% of the time. This suggests that periods of fear tend to last longer and happen more frequently than periods of greed. You can explore more historical data on FinHacker.cz to see these patterns for yourself.
This data reinforces a core market truth: fear is a more persistent emotion than greed. Knowing this helps you develop the patience to wait for the right moments. Once you move beyond just the daily score, you can start using the index to strategically inform your entry points, exit plans, and overall portfolio management.
Actionable Trading Strategies Using The Index
Alright, so you understand the theory behind the stock Fear & Greed Index. Now for the fun part: turning that knowledge into a real-world advantage. This is where you go from being a spectator to a strategist, using the daily index score to make tangible moves that can sharpen your trading and investment plans.
What’s great about this tool is its flexibility. It’s not a one-trick pony. You can use it for aggressive contrarian plays, cautious trend-following, and everything in between. The real skill is matching the right strategy to the market’s mood—and, of course, your own tolerance for risk.
Let's break down three powerful ways you can use the index, each designed for a different market environment. Think of this as your playbook for fear, greed, and even those sleepy, neutral days.
The Contrarian Entry Strategy
This is the classic Warren Buffett approach and probably the most famous way to use the Fear & Greed Index. The logic is simple but incredibly powerful: be greedy when others are fearful. This strategy gives you a systematic way to pinpoint exactly when fear is peaking.
The goal here is to step in and buy when everyone else is selling out of sheer panic. It’s during these fire-sale moments that quality assets are most likely to be trading at a discount. You're intentionally moving against the herd, betting that their collective freak-out is a massive overreaction.
Here’s how you can put this into practice, step-by-step:
- Watch for Extreme Fear: The trigger you’re looking for is an index reading below 25. This is your signal that panic is taking hold and a contrarian opportunity might be just around the corner.
- Confirm with Your Own Homework: Never, ever trade on the index alone. Once you spot extreme fear, pull out your other tools. Look for technical support levels on a chart. Double-check that the fundamental story of a company you’ve been eyeing is still intact. The index tells you when to look; your own analysis tells you what to buy.
- Scale Into Your Positions: Don’t just dump all your cash in at once. The market can stay fearful for days or even weeks. A smarter move is to buy in stages. For example, you could invest 25% of your planned capital when the index hits 20, another 25% if it sinks to 15, and so on. This is a form of dollar-cost averaging that helps you get a much better entry price if the market has a bit further to fall.
Example in Action: The market tumbles, and the Fear & Greed Index plunges to 18. You've been waiting for a chance to buy a great tech stock. You pull up its chart and see it's nearing a major long-term support zone. The combination of extreme market fear and solid technical confirmation gives you the green light to start buying while others are hitting the sell button in a frenzy.
The Profit-Taking And Defensive Strategy
Just as extreme fear signals a buying opportunity, extreme greed flashes a giant warning sign. When euphoria takes over and the index soars, it’s a good time to consider selling or at least re-evaluating your positions. It’s a hint that assets might be overvalued and a pullback could be brewing.
This isn’t about trying to perfectly time the market top—that’s a fool’s errand. This is about disciplined risk management. It’s a nudge to look at your winning trades, trim positions that have gotten a bit frothy, and protect those hard-earned gains before sentiment inevitably shifts.
When greed takes over, follow these steps:
- Spot Extreme Greed: Your primary trigger is an index score climbing above 75. This suggests that FOMO (Fear Of Missing Out) is in the driver's seat and rational thinking has taken a back seat.
- Review Your Winners: Which stocks in your portfolio have had the biggest run-ups? Have they become an oversized part of your portfolio? Are their valuations starting to look a little stretched?
- Trim and Rebalance: Think about selling a portion of those high-flyers to lock in some profits. You don't have to sell everything. Trimming just 10-20% can dramatically reduce your risk while still leaving you with skin in the game if the rally continues.
- Think Defensively: If the index pushes into the 90s, it might be time to get even more cautious. You could consider rotating some capital into defensive assets like bonds or consumer staples stocks, which tend to hold their value better when the market gets rocky.
The Trend Confirmation Strategy
Not every signal from the stock Fear & Greed Index is about going against the crowd. Sometimes, its most valuable insight comes from what it isn't telling you. A neutral reading can be an excellent tool for confirming the health of an ongoing market trend.
This strategy is perfect for traders who want to make sure a rally is built on a solid foundation, not just speculative hype. It helps you sidestep those "fake-out" rallies that look great for a day or two before fizzling out.
Here's how to use the index to confirm a trend:
- Identify a Healthy Trend: You see the market is in a clear uptrend, steadily making higher highs and higher lows.
- Check the Index Reading: You glance at the Fear & Greed Index and see it’s hovering in the 50-70 range (Neutral to Greed, but not Extreme Greed).
- Read the Signal: This is actually a fantastic sign. It tells you the uptrend is moving forward without getting overheated. The rally still has room to run because it hasn't reached that point of wild euphoria that often precedes a crash. This should give you more confidence to hold your positions or even add to them carefully.
On the flip side, if the market is trending up but the index is already screaming at 90, that’s your cue to be cautious. The trend might be on its last legs.
Trading Strategies Based on Index Levels
To bring it all together, here’s a simple table outlining how you can react to different levels of fear and greed. Think of it as a cheat sheet for translating market emotion into action.
| Index Level | Sentiment | Primary Strategy | Action Example |
|---|---|---|---|
| Below 25 | Extreme Fear | Contrarian Entry | Begin buying quality assets in stages, confirming with other analysis. |
| 25-49 | Fear | Watch and Wait | Identify potential targets for your watchlist; prepare for a contrarian entry. |
| 50-70 | Neutral/Greed | Trend Confirmation | Hold or add to positions in a healthy uptrend with confidence. |
| Above 75 | Extreme Greed | Profit-Taking/Defense | Trim winning positions, rebalance your portfolio, and consider defensive assets. |
By combining these strategies, you’re no longer just reacting to headlines. You're building a well-rounded approach that prepares you to navigate whatever emotional rollercoaster the market decides to go on next.
Common Pitfalls And How To Avoid Them
While the stock Fear & Greed Index is a fantastic tool for reading the market's emotional temperature, treating it like a crystal ball is the fastest way to get burned. To really get the most out of it, you have to know its limits and sidestep the common traps that snag even experienced traders. Think of its signals as valuable intel, not as direct orders to buy or sell.
The single biggest mistake? Acting on the index alone. That’s a recipe for disaster.
The index is more like a smoke alarm than a firefighter. It tells you there might be a fire, but it can’t tell you if it's a small kitchen flare-up or the whole house is about to go up in flames. An "Extreme Fear" reading is your cue to start digging deeper, not to blindly hit the buy button. Same goes for "Extreme Greed." Before you make a move, you have to back it up with other analysis.
The Danger Of Lingering Extremes
One of the trickiest things about the index is how long it can hang out in the red zones. It's a classic mistake to see "Extreme Greed" and assume a market top is right around the corner, or that "Extreme Fear" means a bottom is guaranteed. It just isn't that simple.
During a strong bull run, the index can stay parked in "Greed" or "Extreme Greed" for weeks, sometimes even months. If you sell out at the very first sign of greed, you risk missing a huge chunk of the rally.
Key Takeaway: The market can stay irrational longer than you can stay solvent. An "extreme" reading is a condition, not a stopwatch. It tells you the emotional heat is high, not that it’s about to break.
On the flip side, during a long bear market, fear can become the new normal. The index might plunge into "Extreme Fear" and just… stay there. Buying too early just because the meter is low is how you catch a falling knife—buying into a stock that just keeps on dropping. This is precisely why risk management is everything. To build a more durable strategy, check out our guide on mastering risk management in trading.
How To Avoid These Common Pitfalls
The key to avoiding these traps is discipline. It’s all about changing your mindset from seeing the index as a magic button to seeing it as one important dial on your dashboard.
Here are three core rules to live by:
Rule 1: Use It As A Confirmation Tool. Let your own research—whether it's fundamental or technical—form your main idea. Then, use the stock Fear & Greed Index to either confirm or challenge that idea. If your analysis says a stock is a buy and the index is screaming "Extreme Fear," your confidence in that trade should go way up.
Rule 2: Wait For The Turn. Instead of buying the second the index hits "Extreme Fear," try waiting for it to actually turn and start heading back toward neutral. This can help you avoid buying into a freefall. The same logic works for selling: when greed is peaking, waiting for the index to start pulling back can give you a much better exit signal.
Rule 3: Always Consider The Context. You have to look at the bigger picture. Is a major economic announcement driving the fear? Is the greed just isolated to one hot sector, like tech, or is it spread across the whole market? Understanding the why behind the number gives you a much smarter perspective than the reading alone.
By accepting its limitations and blending its insights with a solid, well-rounded strategy, you can turn the index from a potential pitfall into a seriously powerful ally.
Frequently Asked Questions
Even after you get the hang of the stock fear and greed index, a few questions usually pop up. It's a powerful tool, but like any good tool, you need to understand its nuances to use it well. Let's clear up some of the most common questions so you can start applying it with confidence.
Think of this as moving from just knowing what the index is to truly understanding how to weave its insights into your own investment strategy.
How Reliable Is The Stock Fear And Greed Index?
The best way to think about the index is as a highly reliable barometer of market sentiment, not as a crystal ball for trading. Its real power is in how it's built—it blends seven proven market indicators into one easy-to-read score, giving you a bird's-eye view of the market's emotional state.
History shows a strong link between extreme readings and major market turning points. A score deep in "Extreme Fear" has often signaled a major market bottom was near. On the flip side, "Extreme Greed" has frequently popped up right before a significant correction.
But it’s not a perfect timing tool. The market can stay "extremely fearful" or "extremely greedy" for weeks, sometimes tricking traders into jumping the gun. The smartest way to use the stock fear and greed index is as a confirmation signal. Always pair its readings with your own technical or fundamental analysis before pulling the trigger on a trade.
Can I Use This Index For Cryptocurrency Or Forex?
This is a really important distinction. The original CNN Fear & Greed Index was built specifically for the U.S. stock market. Its ingredients, like S&P 500 momentum and junk bond demand, are all about equities. They have zero connection to other asset classes.
So, trying to trade Bitcoin or the EUR/USD pair using the stock market's index just won't work. The drivers are completely different.
Important Note: The "Fear & Greed" concept became so popular that dedicated indices have been created for other markets, especially crypto. These alternative tools use crypto-specific data, like social media buzz and on-chain metrics. Always double-check that you’re using the right index for the asset you’re trading.
How Often Should I Check The Index?
How often you peek at the stock fear and greed index really comes down to your personal investing style. There’s no single right answer, but here’s a good rule of thumb:
For Long-Term Investors: Looking at it weekly, or even monthly, is plenty. You're not trying to time daily blips; you're hunting for those big, generational shifts in sentiment that signal a fantastic long-term buying opportunity.
For Swing Traders: If you hold positions for a few days or weeks, checking it daily is a great habit. It gives you fantastic context for your entry and exit points, helping you see if the market's mood is on your side.
For Day Traders: Honestly, the index isn't very useful for intraday moves. It only updates once per day after the U.S. market closes, which is far too slow to keep up with the fast-paced action inside a single trading session.
No matter your style, checking it more than once a day is overkill. Its value is in capturing the broad, settled emotion of the market, not the frantic minute-by-minute noise.
Ready to stop guessing the market's mood? With Fear Greed Tracker, you get real-time sentiment scores on over 50,000 assets, powered by a proprietary 16-indicator algorithm. Transform market fear into your strategic advantage by tracking live data, setting custom alerts, and making decisions backed by powerful insights. Start your analysis today at feargreedtracker.com.