
Sentiment analysis for the stock market is simply a way of using technology to measure the collective mood of investors. It scans online sources like news articles and social media chatter to figure out if the overall feeling is positive, negative, or neutral. This lets traders put a number on market psychology and gain an edge that goes beyond traditional financial data.
Why Market Mood Matters More Than Ever
Picture the stock market less as a collection of charts and more as a giant, ongoing conversation. Every news headline, every tweet, every earnings call is a whisper that can quickly swell into a roar, moving prices in an instant. Traditional analysis is great for telling you the "what"—revenue, earnings, debt. Sentiment analysis, on the other hand, tells you the "how"—as in, how people feel about all that information.
This emotional layer is what makes markets so unpredictable. Fear, greed, optimism, and flat-out panic are powerful forces that can shove a stock's price miles away from what its financials say it's worth.
A company can have a perfect balance sheet, but if a wave of bad press hits, the stock can tank. On the flip side, a burst of social media hype can send a little-known stock to the moon, no matter what its fundamentals look like.
Tapping into the Collective Mindset
Back in the day, getting a read on the market's mood was an art form. You had to be a seasoned trader on the exchange floor, picking up on the subtle cues. Today, technology has turned that art into a data-driven science. With sentiment analysis for stock market data, we can "listen" to millions of these conversations at once, turning a mess of unstructured text into a clear indicator of investor emotion.
This gives you a few critical advantages that old-school metrics just can't provide:
- Early Warning Signals: Big shifts in public sentiment often happen right before a major price move, giving you a valuable head start.
- Confirmation of Trends: See a strong technical breakout on a chart? It’s a lot more convincing when it’s backed by a surge of positive online chatter.
- Contrarian Opportunities: Extreme fear can signal that the market has oversold, creating a potential buying opportunity. Extreme greed can mean a market top is near. Tools like the Fear & Greed Index are built to spot these moments. You can learn more by understanding the Stocks Fear and Greed Index in our detailed guide.
From Whispers to Actionable Data
Modern AI makes it possible to measure all this market psychology with incredible speed and scale. Algorithms can sift through thousands of news articles, social media posts, and analyst reports in real-time, assigning a simple sentiment score—positive, negative, or neutral—to each one.
When you add up all those individual scores, you get a powerful trendline that shows you the collective mood around a stock or even the entire market. This isn't about having a crystal ball. It’s about adding a crucial layer of context to your strategy, helping you make smarter decisions and avoid getting swept up in irrational herd behavior.
How Sentiment Analysis Actually Works
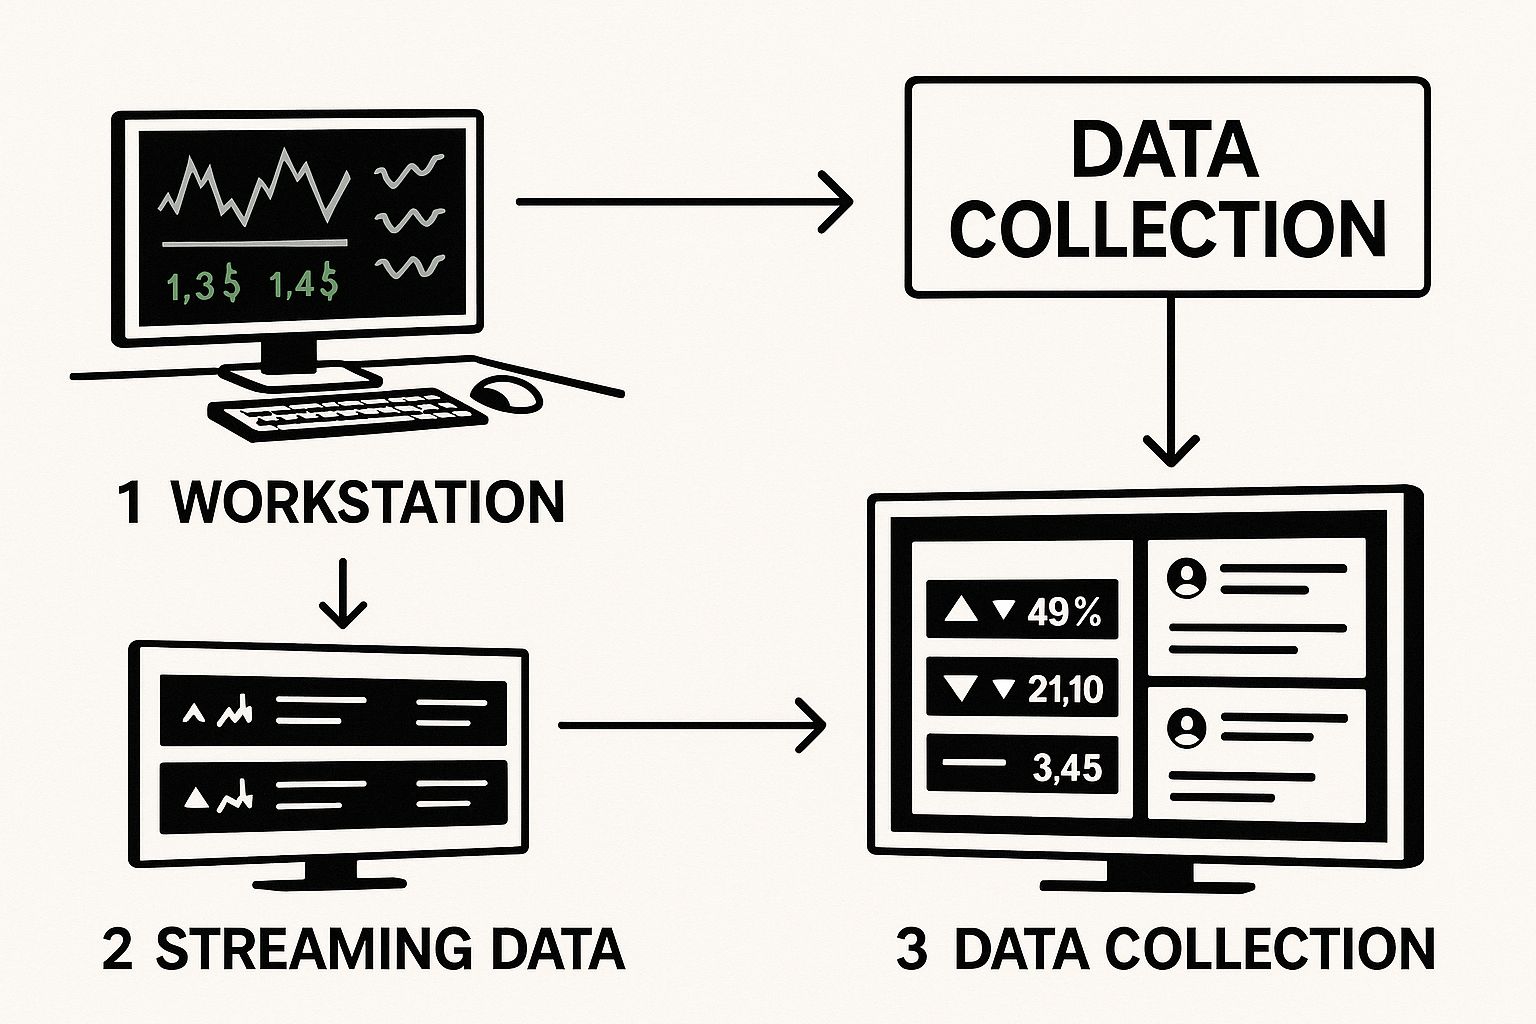
Turning millions of online comments, news headlines, and forum posts into a clean, actionable signal might seem like magic. It’s not. It’s a structured, three-step process that you can think of like a refinery: raw, messy crude oil (public opinion) goes in one end, and refined, high-value fuel (a clear sentiment score) comes out the other.
This process kicks off by casting a wide net to capture the global conversation about a stock, a sector, or the market as a whole.
Step 1: Data Sourcing
First things first, you need raw material. Sentiment analysis algorithms feed on text—and lots of it. The goal is to vacuum up data from a diverse set of sources to get a well-rounded, unbiased view of what people are thinking and feeling.
Not all sources are created equal. Some capture instant, raw emotion, while others offer more measured, thoughtful analysis.
Here's where the algorithms look:
- Social Media Platforms: Twitter (now X) and Reddit forums like r/WallStreetBets are goldmines for real-time, unfiltered investor reactions. They’re fantastic for spotting sudden mood swings, especially around trending or "meme" stocks.
- Financial News Outlets: Major publications like The Wall Street Journal, Bloomberg, and Reuters carry immense weight. Their tone can shape market perception in an instant, and algorithms can scan thousands of headlines and articles in seconds.
- Analyst Reports and Blogs: Professional analysts and influential bloggers publish deep dives on specific stocks. Mining these documents reveals the kind of expert sentiment that often moves institutional money.
- Corporate Filings: Even dry, official documents like SEC filings contain clues. An uptick in cautionary phrases or risk-related language might signal that a company is bracing for challenges.
To make sense of these varied inputs, it helps to see how they stack up. Different sources provide different signals, and understanding their nuances is key to interpreting the final sentiment score.
Primary Data Sources for Stock Market Sentiment Analysis
| Data Source | Type of Content | Sentiment Signal Speed | Best For |
|---|---|---|---|
| Social Media (X, Reddit) | Unfiltered posts, comments, memes | Real-time (seconds to minutes) | Capturing retail investor hype and sudden mood shifts. |
| Financial News | Headlines, articles, press releases | Fast (minutes to hours) | Gauging broad market reaction to major events (e.g., earnings). |
| Analyst Reports | In-depth research, ratings | Slow (days to weeks) | Understanding expert, institutional-level opinion. |
| Corporate Filings (SEC) | Official reports, risk disclosures | Very Slow (quarterly) | Identifying long-term corporate outlook and potential red flags. |
Ultimately, the best systems pull from a wide array of platforms to build a complete, holistic picture of market sentiment.
Step 2: Sentiment Scoring
Once all that raw text is collected, the real work begins. This is where algorithms act as translators, reading each piece of content and assigning it a sentiment score. The simplest models drop text into one of three buckets: positive, negative, or neutral.
A headline like, "Apple Reports Record-Breaking iPhone Sales," would get a clear positive score. On the flip side, "Apple Faces Antitrust Investigation" would be tagged as negative. Easy enough.
But more advanced systems go much deeper. They can identify nuanced emotions like fear, excitement, or uncertainty. They can also grasp intensity—understanding that "disastrous earnings report" is far more negative than "mixed quarterly results." This is the engine that powers modern sentiment analysis for stock market applications.
The real power here is quantification. Sentiment scoring turns subjective human emotion into objective data that can be tracked, measured, and plugged into trading models.
This isn’t just a theory. Research shows that folding public sentiment data into traditional forecasting models can boost stock price prediction accuracy by around 20%. Why? Because fundamentals only tell part of the story. Prices are also driven by perception, hype, and fear.
Step 3: Data Aggregation
A single positive tweet or one negative news article doesn't move markets. It’s the collective weight of opinion that matters. The final step, aggregation, is where the big picture finally emerges.
Individual sentiment scores from thousands of sources are compiled over time to create a single, easy-to-read trendline.
By aggregating all these scores, we can see if the overall mood is turning more optimistic or pessimistic. This gives us a powerful leading indicator of where the market might be headed next.
This aggregated score helps traders answer critical questions:
- Is the positive buzz around a stock growing, or is it starting to fade?
- Did a bad earnings report cause a temporary dip in sentiment, or is a lasting negative trend setting in?
- Is market sentiment reaching levels of extreme fear or greed that often signal a reversal?
By weaving thousands of individual data points into a single, coherent narrative, traders can finally see the forest for the trees. This aggregated view transforms the noisy chatter of the market into a clear, strategic signal. To learn more about how these final numbers come together, check out our guide to stock market sentiment indicators.
The AI That Reads Between the Lines
To really get what makes sentiment analysis tick, we need to pop the hood and look at the AI doing the heavy lifting. Not all sentiment analysis models are built the same—they range from simple word-counters to sophisticated AI that can pick up on sarcasm and nuance.
Think of it like a student learning a language. You start with basic vocabulary, then move on to grammar and sentence structure, and eventually achieve a native fluency that understands context, culture, and slang. Each step up the ladder brings a sharper, more accurate read on the market.
Level 1: Rule-Based Systems
The most basic form of sentiment analysis is the rule-based approach. Picture a massive dictionary where every word has a positive or negative score. Words like "profit," "growth," and "breakthrough" get a thumbs-up, while "loss," "risk," and "decline" get a thumbs-down.
The system just scans a news article or tweet, tallies up the points, and spits out a final score. It’s fast and simple, great for churning through huge amounts of text in a hurry.
But you can see the problem right away. This method is completely literal and misses context. It would see the phrase "not bad" and flag it as negative because of the word "bad," even though we know it’s a mildly positive comment. That’s where smarter systems come in.
Level 2: Classic Machine Learning Models
The next level up is classic machine learning (ML). Instead of following a pre-written rulebook, these models learn from experience. They’re trained on thousands upon thousands of financial articles and social media posts that have already been labeled by humans as positive, negative, or neutral.
Through this training, models like Logistic Regression and Support Vector Machines (SVM) learn to spot the patterns that signal different sentiments. They move beyond single words to recognize which phrases and word combinations usually point to a particular market mood, making them a huge improvement over rule-based systems.
In fact, these models laid the groundwork for modern financial analysis. One study analyzing Twitter sentiment for big-name stocks found that both Logistic Regression and SVM models hit roughly 82% accuracy—proving their worth long before today’s more complex AI came along. You can explore the findings on machine learning classifiers to see the full comparison.
These ML models are the workhorses behind many sentiment analysis tools today, offering a reliable and scalable way to measure market emotion. They were a game-changer in turning messy, unstructured text into clean, actionable data.
Level 3: Advanced NLP Models
At the very top, we have advanced Natural Language Processing (NLP) models. These are the true masters of language in the AI world, with names you might have heard of, like BERT. Unlike older models that just read words in order, these systems understand context on a much deeper level.
BERT can read an entire sentence or paragraph all at once, letting it grasp how words relate to each other. It knows that "a crushing defeat for competitors" is good news for your company. It can even detect the sarcasm in a tweet like, "Oh, great, another market dip."
This kind of deep understanding is absolutely critical for sentiment analysis for stock market data, which is packed with jargon, nuance, and forward-looking language. These models can tell the difference between a CEO who sounds genuinely confident and one who is just robotically reading a script on an earnings call. By catching these subtle cues, advanced NLP gives us the most accurate read on what investors are really thinking and feeling.
From Data to Decisions: Real-World Trading Strategies
Knowing the theory is one thing. Actually using it to make money? That’s a different game entirely. The real magic of sentiment analysis for the stock market happens when you weave it into practical, everyday trading strategies.
Pros don’t just glance at a sentiment score and call it a day. They use it as a powerful lens to either confirm what they’re already thinking, challenge their own assumptions, or spot opportunities that old-school metrics completely miss. It’s the "why" behind a stock’s move, giving you a peek into the mass psychology that’s really pulling the strings.
Using Sentiment as a Confirmation Tool
One of the simplest ways to start is by using sentiment as a confirmation signal. Let’s say you’re a technical trader and you spot a classic bullish breakout on a chart. The price smashes through a key resistance level, volume is high—it’s a textbook signal for a potential move up. Solid, but never a sure thing.
Now, imagine layering sentiment data on top of that. What if, at that exact moment, social media chatter explodes with optimism and news headlines are glowing? That’s your confirmation. The alignment between the technical chart pattern and the market’s mood gives you much higher conviction to pull the trigger on that trade.
The same logic works in reverse. If a stock tumbles below a critical support level and sentiment simultaneously turns ugly, it's a strong reinforcement of the bearish case.
Embracing the Contrarian Approach
Sometimes, the most profitable move is the one nobody else is making. This is where sentiment analysis really shines as a contrarian indicator. The market is always swinging between fear and greed, and when one of those emotions hits an extreme, it’s often a sign that a reversal is right around the corner.
When the entire market is drowning in extreme fear, it often means the sellers have run out of steam and the stock is oversold. This can be a prime buying opportunity for anyone brave enough to step in while everyone else is running for the exits.
On the flip side, when sentiment hits euphoric levels of extreme greed, consider it a flashing warning sign. That’s often the point of maximum financial risk, where the hype has gotten way ahead of the fundamentals and a pullback is looking more and more likely.
One of the best-known tools for this is the CNN Fear & Greed Index, which rolls up multiple indicators into a single, easy-to-read score for the broader market.
Algorithmic Trading and Risk Management
Beyond what you or I might do at our desks, hedge funds and high-frequency trading firms are plugging real-time sentiment feeds directly into their algorithms. These systems can fire off thousands of trades in milliseconds, reacting to shifts in public mood faster than any human ever could.
For instance, an algorithm could be programmed to automatically dump a position the second negative sentiment about a company's new product launch crosses a certain threshold.
Sentiment data is also a crucial tool for managing risk. A portfolio manager might set up alerts for all their holdings. If one of their stocks suddenly gets hit with a wave of negative public perception, it’s an early warning to start digging deeper. It allows them to get out ahead of bad news before it’s fully baked into the stock price.
This is why historical social sentiment data is now a must-have. Real-time and archived sentiment indexes are used across all major markets. Platforms even offer APIs that provide historical sentiment scores for stocks like Apple (AAPL), pulled from a massive aggregate of social media and news. You can see how historical sentiment APIs work to get a feel for how this data is structured and used by quantitative analysts.
Finding the Right Sentiment Analysis Tools
Okay, so you get how sentiment analysis works. The next logical question is: what tools should you use to actually put this into practice?
The world of sentiment analysis for stock market tools is surprisingly vast. It caters to everyone from the casual investor who just wants a quick gut check to the hardcore quant building a sophisticated trading algorithm. The right tool for you really boils down to your technical skills, trading style, and just how deep down the rabbit hole you want to go.
The good news? You don’t need a degree in data science to get in the game. Many platforms are built for regular people, weaving sentiment data right into the trading interfaces you already know.
Integrated and User-Friendly Platforms
For most retail traders, the best solution is a tool that does all the heavy lifting for you. These platforms neatly package sentiment data into easy-to-read indicators, charts, or news feeds. No coding, no complicated setup—just instant insight. They’re perfect for quickly gauging the mood around a stock you’re watching.
- Stocktwits: Think of it as the "Twitter for traders." It’s built entirely around real-time social sentiment. Its trending tickers and message boards give you a raw, unfiltered look at what retail investors are buzzing about, right now.
- TradingView: While famous for its killer charting tools, TradingView also bakes in news sentiment indicators. These tools scan headlines and articles, then plot a sentiment score directly on your price chart. This lets you visually connect mood swings with market action.
Platforms like these are great starting points because they blend sentiment analysis directly into your existing workflow.
Advanced Data APIs for Custom Solutions
Now, for developers, quants, and serious traders who crave more control, data APIs are the answer. An Application Programming Interface (API) is basically a direct pipeline to raw sentiment data feeds. It lets you plug sentiment scores straight into your own custom-built trading models, backtest strategies, and create personalized alerts.
Think of it like this: an integrated platform gives you a pre-cooked meal, while an API gives you access to a fully-stocked professional kitchen. You have all the raw ingredients and tools to create whatever you want.
Leading API providers offer access to both historical and real-time social sentiment, pulling from sources ranging from major news outlets to social media chatter. This raw data is gold for anyone looking to build a truly unique edge by combining sentiment with other technical or fundamental indicators in a proprietary system.
Choosing Your Path
The right tool is simply the one that fits your approach to the market. There's no single "best" option—only the one that aligns with your goals and comfort level.
Whether you prefer a simple visual indicator on a chart or a powerful stream of raw data to crunch yourself, there's a solution out there. For a detailed breakdown of different options, check out our guide on the top 10 best sentiment analysis tools in 2025. It compares a bunch of platforms for different needs to help you make a smart decision.
Common Mistakes and How to Avoid Them

Jumping into sentiment analysis without understanding its weak spots is a recipe for disaster. While sentiment analysis for stock market data is an incredible tool, it's not a crystal ball. Treating it like one is a fast track to some very expensive mistakes.
The best approach? A healthy dose of skepticism. You have to know the built-in limitations before you can trust the signals.
One of the biggest traps is the classic "garbage in, garbage out" problem. An algorithm is only as sharp as the data you feed it. If you’re pulling from bot-infested social media feeds or heavily biased news sites, the conclusions it spits out will be just as unreliable.
That means a sudden spike in positive chatter might not be genuine investor excitement at all—it could just be a coordinated spam campaign. Always double-check signals across a few different, reputable data sources. It’s the only way to avoid getting suckered by manufactured hype.
Misinterpreting Nuance and Sarcasm
Human language is a messy, beautiful thing. Sarcasm, inside jokes, and weird financial slang are everywhere on platforms like Reddit and X (formerly Twitter). Even the smartest AI can get tripped up by it.
Think about it. An algorithm sees the phrase, "Great, my portfolio is down another 10%" and might flag it as positive just because it saw the word "great." It completely misses the context and gets the meaning backward, leading to a dangerously wrong sentiment score.
Remember, an algorithm doesn't feel emotion; it only recognizes patterns in text. Always sanity-check extreme sentiment readings against the actual online conversation to ensure the machine isn't being fooled by clever human expression.
Another huge hurdle is our own brains. We all suffer from confirmation bias—the tendency to look for information that backs up what we already believe. If you're bullish on a stock, you'll naturally gravitate toward positive sentiment signals and brush off the negative ones.
Maintaining a Balanced Strategy
To fight this, you have to treat sentiment data as an objective tool. Use it to challenge your assumptions, not just to pat yourself on the back. Ask yourself: what is the bearish sentiment telling me that I'm completely missing?
Here are a few practical tips to keep you out of trouble:
- Diversify Your Data: Never, ever rely on a single source. Cross-reference what social media is saying with data from financial news outlets and professional analyst reports. This gives you a much more rounded view.
- Combine It with Other Analysis: Sentiment is just one piece of the puzzle. It should support—not replace—your fundamental and technical analysis. Use them all together to build a solid investment thesis.
- Stay Aware of the Noise: Social media is loud and chaotic by nature. Don't react to every little emotional flare-up. Instead, look for sustained trends in sentiment that build over time.
In the end, sentiment analysis is just one component in a much larger, diversified strategy. If you understand its flaws and use it wisely, it can add a powerful layer of insight to your trading. Just don't let it be the only voice in the room.
Frequently Asked Questions About Sentiment Analysis
As you start digging into sentiment analysis for the stock market, you'll probably run into a few common questions. Let's clear them up so you can use this data with confidence.
Can Sentiment Analysis Predict Exact Stock Prices?
This is the million-dollar question, and the answer is a hard no.
Think of sentiment analysis less like a crystal ball and more like a weather barometer. High pressure doesn't guarantee a sunny day, but it definitely improves the odds.
In the same way, a huge spike in positive sentiment doesn't mean a stock is automatically going to the moon. It’s a signal—a sign of growing bullish pressure. The smartest traders use it to confirm what their fundamental or technical analysis is already telling them, giving them a much richer view of where a stock might be headed.
What Is the Easiest Way to Start?
You don't need a Ph.D. in data science to get going. The simplest way in is to just start watching.
Pick a few stocks you know inside and out and monitor their real-time sentiment stream on a platform like Stocktwits. You’ll quickly get a feel for how online chatter lines up with price action.
Another great first step is to add a news sentiment indicator to your charts on a platform like TradingView. It gives you a clean visual overlay, showing you instantly how big headlines are swaying investor mood without ever leaving your price chart.
Key Takeaway: Start small. Just observe the relationship between sentiment and price for a few assets you're comfortable with. This builds an intuitive feel for how market psychology plays out in the real world before you ever risk a dime.
Is Sentiment Data Only Useful for Day Traders?
Not at all. While the real-time feed is a goldmine for short-term traders, sentiment data offers a ton of value for long-term investors, too. You just use it differently.
Day traders are on the lookout for sudden spikes in sentiment that might telegraph an immediate price swing.
Long-term investors, on the other hand, can track sentiment trends over months or even years. A slow, steady rise in public perception around a company's brand can be a powerful leading indicator of future growth. Likewise, a gradual decline in sentiment can be an early warning that a company is losing its edge, long before the bad news ever shows up in an earnings report.
Ready to turn market fear into your strategic advantage? With Fear Greed Tracker, you get real-time sentiment scores for over 50,000 assets, empowering you to make smarter, data-driven decisions. Start tracking the market's mood today at https://feargreedtracker.com.