
Sentiment analysis in trading is really just a tech-savvy way of measuring the market's collective mood.Sentiment analysis in trading is really just a tech-savvy way of measuring the market's collective mood. Is it bullish, bearish, or just plain neutral? It sifts through the noise of news articles, social media chatter, and financial reports to give you a powerful layer of intelligence that you just can't get from charts alone.
How to Decode the Market's Mood
Imagine walking into a crowded auction. Even before the bidding starts, you can feel the energy in the room. You can sense if the crowd is excited and ready to spend aggressively, or if they’re cautious and hesitant. That "feel" gives you an edge, helping you guess how high the bids might go.
Sentiment analysis does the same thing, but for the entire financial market.
Instead of just staring at price charts and financial statements, this approach listens to the global conversation happening 24/7. It uses powerful algorithms to scan millions of data points in real time, asking questions like:
- News Headlines: Is that latest earnings report being framed as a massive success or a disappointing failure?
- Social Media Posts: Are traders on X (formerly Twitter) and StockTwits buzzing with excitement or spreading fear about a particular stock?
- Financial Reports: Does the language in a company's annual report sound confident and ambitious, or defensive and cautious?
By processing this ocean of text, the technology spits out a sentiment score, giving you a tangible measure of the market’s collective mood.
Moving Beyond Price Action
Traditional technical analysis is all about price and volume, which is a bit like looking in the rearview mirror—it tells you where the market has been. Fundamental analysis, while crucial for understanding a company's health, can be slow to influence daily price swings.
Sentiment analysis adds a forward-looking dimension. It taps into the very emotions that cause those swings in the first place. This is where you can find a real edge.
By quantifying the psychological drivers of fear and greed, sentiment analysis helps traders understand the why behind price movements, not just the what. It provides a measurable way to gauge whether market hype is building or if panic is about to set in.
And this isn't just theory. Recent research has shown that a hybrid strategy—one that combines sentiment insights from financial news with standard technical indicators—outperformed a simple buy-and-hold strategy. This approach generated an annualized return of roughly 5.77% on the S&P 500, proving that market sentiment is a valuable predictor that captures nuances price trends often miss. You can read the full research about these performance findings to see exactly how they tested it.
Ultimately, learning to read the market's mood is about gaining a more complete picture. It's not about replacing your old tools, but adding a powerful new one to your arsenal. To get started, you can explore our detailed guide on using sentiment analysis for stocks to read market mood. It breaks down how to interpret these emotional currents and actually use them in your decision-making.
The Technology Behind Sentiment Analysis
Sentiment analysis isn't magic; it's a gritty, data-driven process that breaks down the messy world of human language into cold, hard numbers. Think of it as an assembly line for market opinion. Raw, unstructured text from all corners of the internet goes in one end, and a clean, actionable sentiment score pops out the other.
It all kicks off with data collection. Algorithms are constantly crawling a mind-boggling number of sources where people are talking about the markets. This isn't just about the big financial news outlets and official press releases. It's also about tapping into the unfiltered, real-time chatter on platforms like X (formerly Twitter) and forums like StockTwits.
The image below gives you a sense of just how many data streams feed into a modern sentiment analysis engine.
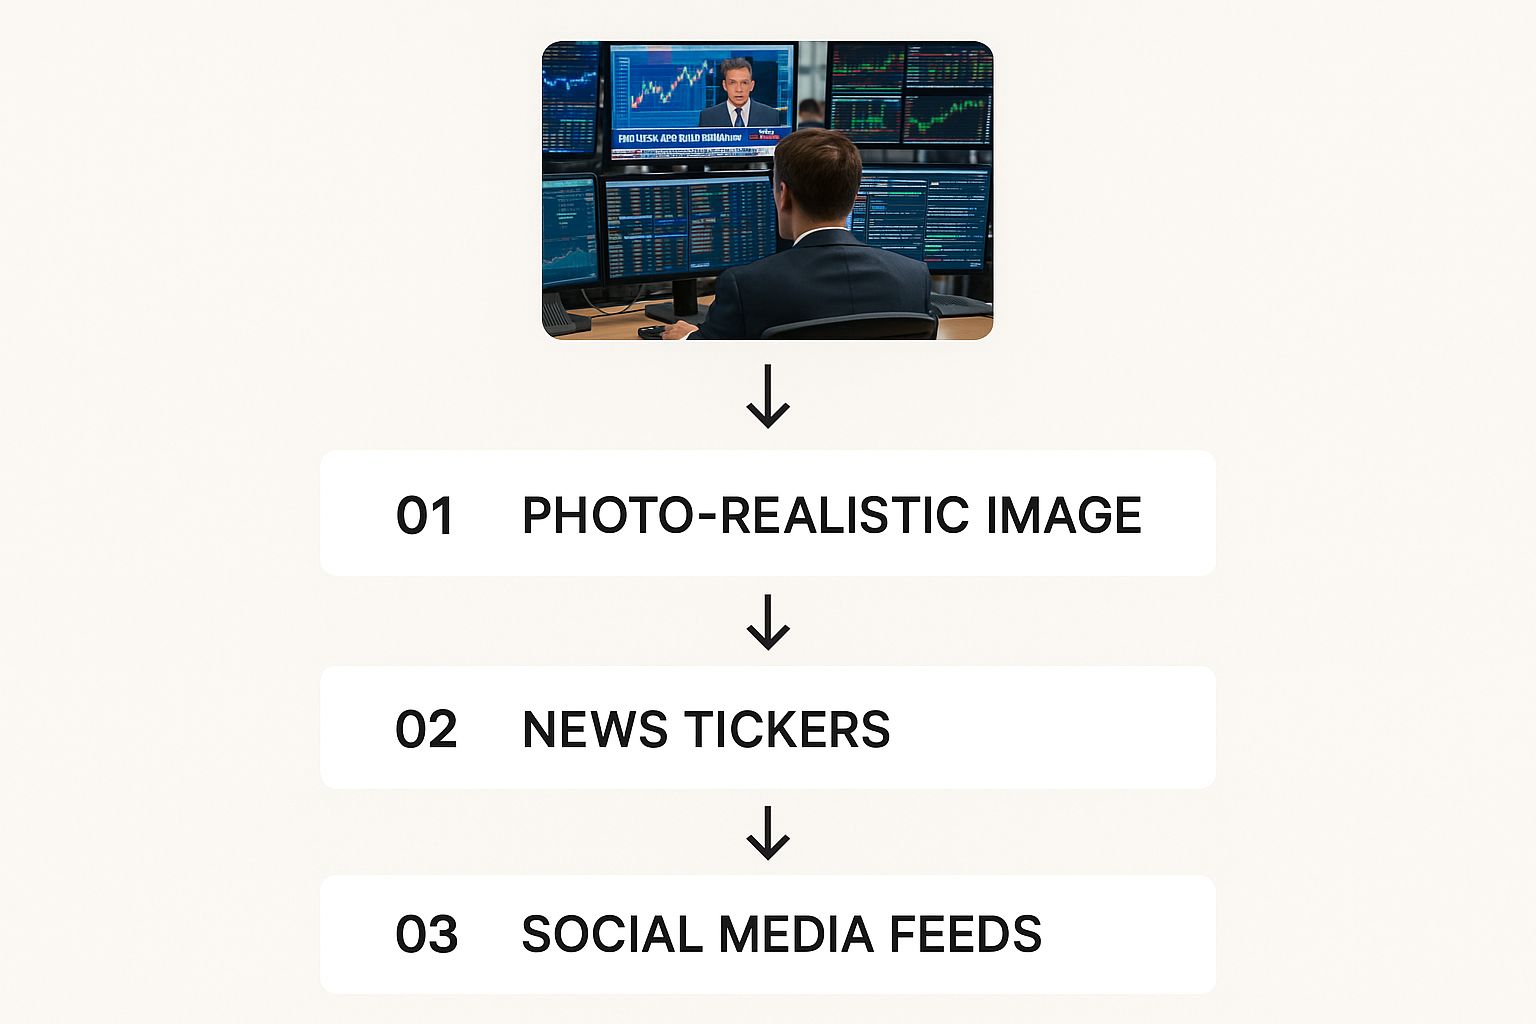
It’s about pulling together news tickers, social feeds, and company reports to get a complete picture of market psychology.
How Machines Learn to Read Moods
Once all that data is in the bucket, the real work begins with something called Natural Language Processing (NLP). This is the branch of AI that teaches computers to understand text and speech the way we do. It’s the secret sauce that makes sentiment analysis more than just a simple keyword counter.
For example, a basic search might see the word "catastrophic" in a headline and immediately flag it as negative. But what if the sentence is, "The company's new product launch was a catastrophic success, crushing all previous sales records"? A well-trained NLP model gets the nuance. It understands the context and syntax to correctly nail the overwhelmingly positive sentiment.
At its core, NLP figures out the complex dance between words to determine the true emotional tone. It learns the difference between a glowing earnings report and a grim product recall by analyzing how sentences are built and the specific language used.
Assigning a Final Sentiment Score
The last step is sentiment scoring. After the NLP model has chewed on the text, it spits out a numerical value or a simple label to quantify the emotion. Usually, this score falls into one of three buckets:
- Positive: This points to bullish or optimistic language.
- Negative: This flags bearish or pessimistic language.
- Neutral: This covers objective, factual statements without a strong emotional charge.
These individual scores are then rolled up across thousands of sources to create an overall sentiment metric for a stock, a crypto asset, or even the entire market. A sudden jump in negative scores could be an early warning of a price drop, while a steady climb in positive sentiment might signal growing investor confidence.
This is where it gets really powerful. Take a strategy like pairs trading, which depends on two historically linked stocks keeping their price relationship intact. A four-year study looking at 300 NYSE companies found that when traders used sentiment analysis to confirm both stocks had similar market vibes, they saw much higher returns than with traditional models. You can check out the pairs trading findings yourself to see how sentiment data can reinforce price correlations.
This whole process—from collection to scoring—is how the emotional chaos of market chatter gets turned into a quantifiable edge.
Finding Reliable Sentiment Data Sources
Knowing the market’s mood is one thing; knowing where to listen in on the conversation is another. Effective sentiment analysis hinges entirely on the quality of your data. Think of it like being a detective—you can’t solve the case with unreliable witnesses. You need credible sources that give you a clear picture of what’s actually happening.
The internet is overflowing with opinions, but most of it is just noise for a trader. The real goal is to find the meaningful signals buried in that chaos. This means tapping into a mix of traditional financial media, real-time social platforms, and specialized metrics that do the heavy lifting for you.
Where to Look for Raw Sentiment Data
The raw material for sentiment analysis is text, and it's everywhere. But savvy traders tend to focus on a few key places where the chatter is most relevant to market moves. These sources are a direct window into what investors, journalists, and the public are thinking.
- Financial News Outlets: Giants like Bloomberg, Reuters, and The Wall Street Journal are foundational. Their reporting influences everyone from institutional investors to retail traders, making their headlines and articles a primary source for any sentiment model. A positive earnings report framed with optimistic language can send a stock soaring.
- Social Media Platforms: X (formerly Twitter) and StockTwits are the modern-day trading floors. They offer unfiltered, minute-by-minute reactions to market events. While incredibly powerful for catching immediate shifts, these platforms can also be full of bots and deliberate manipulation.
- Analyst Reports and Filings: The language used in official documents, like SEC filings or quarterly earnings call transcripts, provides a more formal sentiment signal. The tone executives use can reveal an underlying confidence or concern that the numbers alone don't capture.
Aggregated Indicators: The Fear & Greed Index
Let's be realistic—sifting through millions of data points yourself is impossible. That's where aggregated indicators come in. These tools process huge amounts of information and boil it all down into a single, easy-to-read score.
The most famous example is the Fear & Greed Index. Instead of just looking at one data type, the index combines multiple factors into a score, usually from 0 (Extreme Fear) to 100 (Extreme Greed). For a closer look at how these metrics work, check out our guide to stock market sentiment indicators.
An aggregated index gives you a holistic view of market psychology. It’s like a weather forecast that combines temperature, humidity, and wind speed to tell you what it really feels like outside—a much more complete picture than any single metric.
Quantitative analysis backs this up. One study found a clear link between sentiment scores and market behavior. A progressive increase in sentiment from 36 to 346 over two weeks directly corresponded with rising stock prices and stable trading volume. This shows how sentiment data, when sourced properly and viewed with tools like candlestick charts, can align with—and even predict—price action. You can see the full study and its findings here.
Comparison of Sentiment Data Sources for Trading
Choosing the right sources is a critical first step. Each one has its own strengths and weaknesses, and the best approach often involves using a few in combination.
This table breaks down the most common sources to help you figure out which ones fit your trading style.
| Data Source | Type of Data | Best For | Potential Pitfalls |
|---|---|---|---|
| Financial News | Structured, high-quality articles | Long-term trend analysis and event-driven trades | Can lag behind real-time market reactions |
| Social Media (X, StockTwits) | Unstructured, real-time chatter | Capturing short-term momentum and retail sentiment | High noise-to-signal ratio, risk of manipulation |
| Analyst Reports | Expert opinions and research | In-depth fundamental analysis and sector sentiment | Potential for inherent bias from the issuing firm |
| Aggregated Indices | Combined, multi-factor scores | Quick, at-a-glance market mood assessment | Can oversimplify complex market dynamics |
Ultimately, a multi-source strategy is the most resilient. By combining real-time social chatter with structured news analysis and validated indices, you can confirm signals, filter out the noise, and make trading decisions with a lot more confidence.
Weaving Sentiment into Your Trading Strategy
Knowing the market's mood is one thing. Actually using that knowledge to make better trades? That’s where the real edge is found. Raw data without a plan is just noise, so let's connect the dots between market sentiment and your trading decisions.
Think of sentiment analysis not as a crystal ball, but as a specialized lens. It reveals a layer of information that traditional indicators like moving averages or RSI can't see—the human element. By layering this emotional data over your existing technical or fundamental analysis, you build a much stronger, more adaptive trading system.
This isn't about ditching your current methods. It’s about making them smarter. The goal is to create a practical framework that lets you apply sentiment analysis in a way that fits your style.

Use Sentiment as a Confirmation Tool
One of the simplest and most effective ways to start is by using sentiment as a confirmation tool. You've done your homework, the charts are lining up, and a trade setup looks solid. Before you pull the trigger, check the sentiment score for that final green light.
Imagine your technical analysis points to a bullish breakout for a tech stock. The price just cleared a key resistance level on heavy volume. Everything looks good. As a final check, you glance at its sentiment score and see a steady climb in positive chatter across news sites and social media. That's your confirmation.
This alignment tells you that the market's mood is in sync with your technical read, adding a powerful layer of confidence to your trade. It suggests others are seeing what you see, providing the potential momentum needed for a successful move.
Play the Contrarian with Extreme Sentiment
Markets are emotional beasts, swinging between cycles of fear and greed. When one of these emotions hits an extreme, it often signals that a reversal is just around the corner. This is your chance to use sentiment as a contrarian indicator and move against the herd.
For instance, what if the Fear & Greed Index for a specific crypto plunges into "Extreme Fear" after days of panic selling? A contrarian trader sees this not as a disaster, but as a potential opportunity. The weak hands have likely folded, the asset is probably oversold, and the pessimism is likely overblown. This could be the perfect moment to buy, anticipating a bounce as fear subsides.
Contrarian Trading Principle: The best time to buy is often when there's "blood in the streets" (extreme fear), and the best time to sell is when there's irrational exuberance (extreme greed).
This strategy isn't for the faint of heart—catching a falling knife is always risky and demands strict risk management. But fading extreme emotions is a time-tested strategy used by some of the most successful investors. To learn more about this approach, check out our full guide on how to use market sentiment analysis for trading.
Generate Signals from News and Events
Finally, you can use sentiment to generate trading signals directly, especially for news-driven trades. Events like earnings reports, product reveals, or regulatory news can flip public perception in an instant. Sentiment analysis lets you measure these shifts as they happen.
Let's say a pharmaceutical company releases the results of a major clinical trial. Before the stock price even has a chance to fully react, your sentiment tool flags a massive spike in negative language across financial news and medical forums.
That sudden bearish shift is a powerful trading signal in itself. It tells you the market’s initial interpretation of the news is overwhelmingly bad, creating a high probability of a sharp price drop. A trader acting on this could short the stock to capitalize on the impending downward move.
This method is a favorite among day traders and swing traders who thrive on breaking news. It gives them an edge by measuring the impact of the news, not just the headline.
Real-World Examples of Sentiment Moving Markets
Theory is one thing, but seeing it play out in the wild is another. The financial markets are littered with stories where raw emotion, not cold, hard fundamentals, grabbed the steering wheel. These case studies are perfect illustrations of just how powerfully sentiment can move prices, turning social media chatter into billions of dollars gained or lost.
Looking back at these events isn't just a history lesson. It’s a practical demonstration of how sentiment analysis for trading can give you a real-time edge—helping you spot opportunities or dodge disasters that traditional indicators would miss completely.
Let's break down a couple of the most famous examples.

The GameStop Saga: A Retail Revolution
The GameStop short squeeze in early 2021 is the poster child for sentiment-driven market chaos. For months, big institutional investors had been heavily shorting the struggling video game retailer, convinced it was circling the drain. On paper, they had a point.
But they completely missed the massive, coordinated wave of bullish sentiment building on social media, especially on Reddit's r/WallStreetBets forum. A mix of nostalgia, anti-establishment frustration, and genuine belief in a turnaround fueled a buying frenzy among millions of retail investors.
It created a perfect storm—a classic feedback loop:
- Bullish Sentiment Spikes: Posts and memes about GameStop ($GME) went viral, creating a tidal wave of positive sentiment that was easy to spot on social platforms.
- Buying Pressure Mounts: All that optimism translated directly into incredible buying volume from everyday traders.
- The Squeeze Is On: As the stock price exploded, hedge funds that were shorting GME were forced to buy back shares at insane prices to cut their losses. This, of course, only launched the price even higher.
Any trader using sentiment analysis tools would have seen the conversation volume and positive mentions going parabolic long before the major price spikes. The sentiment data was a screaming leading indicator, signaling that a retail army was about to overwhelm institutional logic.
How a Single Tweet Can Move Crypto Markets
The crypto market is famously twitchy, often reacting violently to the words of influential figures. Nobody has proven this more than Elon Musk, whose tweets have repeatedly sent assets like Bitcoin and Dogecoin on a rollercoaster.
Take 2021, for example. A series of tweets from Musk had a direct, measurable impact on Bitcoin's price. When he announced Tesla would accept Bitcoin as payment, sentiment rocketed, and so did the price. A few weeks later, when he backtracked due to environmental concerns, negative sentiment spiked, and the price cratered.
These events perfectly capture the idea of "influencer sentiment," where one person's opinion can temporarily steamroll every other market factor. For assets with less-established fundamentals, like many cryptocurrencies, this kind of sentiment can be the main driver.
Traders with alerts monitoring keywords like "Bitcoin" and "Elon Musk" could react in seconds. The moment the sentiment of his posts flipped positive or negative, it created an immediate—if risky—trading opportunity. This is a prime example of using sentiment analysis for short-term, event-driven trading where speed is everything.
Lessons from the Trenches
These stories offer some critical takeaways for any trader looking to add sentiment analysis to their toolkit.
- Sentiment can absolutely crush fundamentals. GameStop's balance sheet did not justify its meteoric rise. The move was almost entirely driven by psychology.
- The source of the sentiment matters. For meme stocks, Reddit and X (formerly Twitter) are ground zero. For a blue-chip stock, the tone of a Bloomberg article might carry more weight.
- Extreme sentiment can be a contrarian signal. While the GameStop saga was a wild outlier, extreme bullishness often precedes a sharp pullback once the hype burns out.
Ultimately, these real-world examples prove that market prices aren't just a reflection of numbers on a spreadsheet. They're a reflection of human emotion. With the right tools, you can learn to read that emotion and use it to your advantage.
Choosing the Right Sentiment Analysis Tools
You don't have to build a complex AI from scratch to start using sentiment analysis in your trading. There's a whole ecosystem of tools out there, built for different budgets, skill levels, and trading styles. The real trick is finding the one that fits how you trade.
Think of the options in three main buckets. Each gives you a different way to plug into the market's mood.
- Built-in Platform Indicators: Lots of popular charting platforms, like TradingView, have sentiment indicators ready to go. These are perfect if you're just starting out. They're easy to find and you can drop them right onto your charts alongside your usual technicals.
- Dedicated Software Providers: Then you have companies that live and breathe this stuff, like the Fear Greed Tracker. These platforms are all about deep sentiment analytics, offering their own unique scores, historical data, and powerful ways to visualize what's happening across thousands of assets.
- APIs for Custom Strategies: For the quants and programmers building automated trading systems, an API is the way to go. It gives you the raw sentiment data, ready to be piped directly into your custom algorithms for systematic or high-frequency trading.
Key Features to Look For
When you're comparing tools, don't get distracted by a slick dashboard if the data behind it is weak. The most actionable insights come from a few key things.
First, prioritize tools with broad data source coverage. You want something that scans everything from major news outlets and financial reports to the noisy chatter on social media. The wider the net, the more complete the picture.
Access to historical sentiment data is also a must-have. It lets you go back in time and see how sentiment shifts actually correlated with price action. This is crucial for backtesting and building confidence in your signals. And finally, good visualization tools are essential for spotting trends and outliers without having to squint at spreadsheets all day.
The best tool is the one that slides right into your existing workflow—whether you're a discretionary trader needing a quick gut check or an algo trader who just needs a clean data feed.
To make it a little clearer, here’s a simple breakdown of how the three types of tools stack up.
| Tool Type | Cost | Complexity | Best For |
|---|---|---|---|
| Platform Indicators | Low to Free | Low | Beginners & quick analysis |
| Dedicated Software | Moderate (Subscription) | Medium | Active traders & researchers |
| APIs | High (Usage-based) | High | Algorithmic & automated trading |
Ultimately, the right tool turns market psychology from a fuzzy concept into a real, tangible edge. It just makes your entire trading strategy that much more robust and informed.
Answering Common Questions About Sentiment Trading
Even with a clear strategy, jumping into sentiment analysis can stir up a few questions. Getting these answers straight is the key to using this tool the right way and keeping your expectations realistic.
Let's tackle some of the most common things traders wonder about when they first start weaving market mood into their decisions. This isn't about finding a magic bullet—it's about understanding where sentiment data fits into a smart, well-rounded trading plan.
Is Sentiment Analysis a Standalone Strategy?
Nope. While sentiment can give you some seriously powerful signals, it almost never works in isolation. The best traders use it as a confirmation layer, adding weight to their technical or fundamental analysis.
Think of it as the final gut check on the market’s psychology before you pull the trigger on a trade.
For instance, your chart analysis might show a stock is technically overbought and ready for a pullback. If you then check its Fear & Greed score and see it’s tipped into "Extreme Greed," you’ve got a much stronger reason to open that short position. Relying only on sentiment is a recipe for disaster because public mood can be fickle and doesn't always translate directly into price moves.
How Accurate Is Sentiment Analysis for Predictions?
Sentiment analysis isn't a crystal ball—it won’t give you exact price targets. Its real power is in measuring crowd psychology and spotting the probability of certain market behaviors.
How reliable is it? That comes down to the quality of the data sources and the smarts of the algorithm doing the analysis.
Think of sentiment analysis as a weather forecast for the market. It doesn't tell you exactly where lightning will strike, but it warns you when the conditions are right for a storm.
Research shows time and again that adding sentiment data to trading models improves their performance. The best approach isn't to react to single data points, but to track sentiment trends over time to see where the momentum is really heading.
What Are the Biggest Risks of Sentiment Trading?
The two biggest traps are false signals and misinterpreting the data.
Social media is a huge source of real-time sentiment, but it can be a minefield. Bots and coordinated "pump and dump" campaigns can create a completely fake picture of market opinion, leading you astray.
On top of that, algorithms can get tripped up by human language. Sarcasm, inside jokes, and complex financial slang can be easily misunderstood. A model might flag a sarcastic "to the moon!" comment as genuinely bullish, creating a bad signal.
To stay safe, always cross-reference sentiment data with other indicators and never, ever forget your risk management rules.
Ready to stop guessing the market’s mood and start measuring it? The Fear Greed Tracker gives you real-time sentiment scores on over 50,000 assets, helping you make smarter, data-driven decisions. Explore live market sentiment today.