
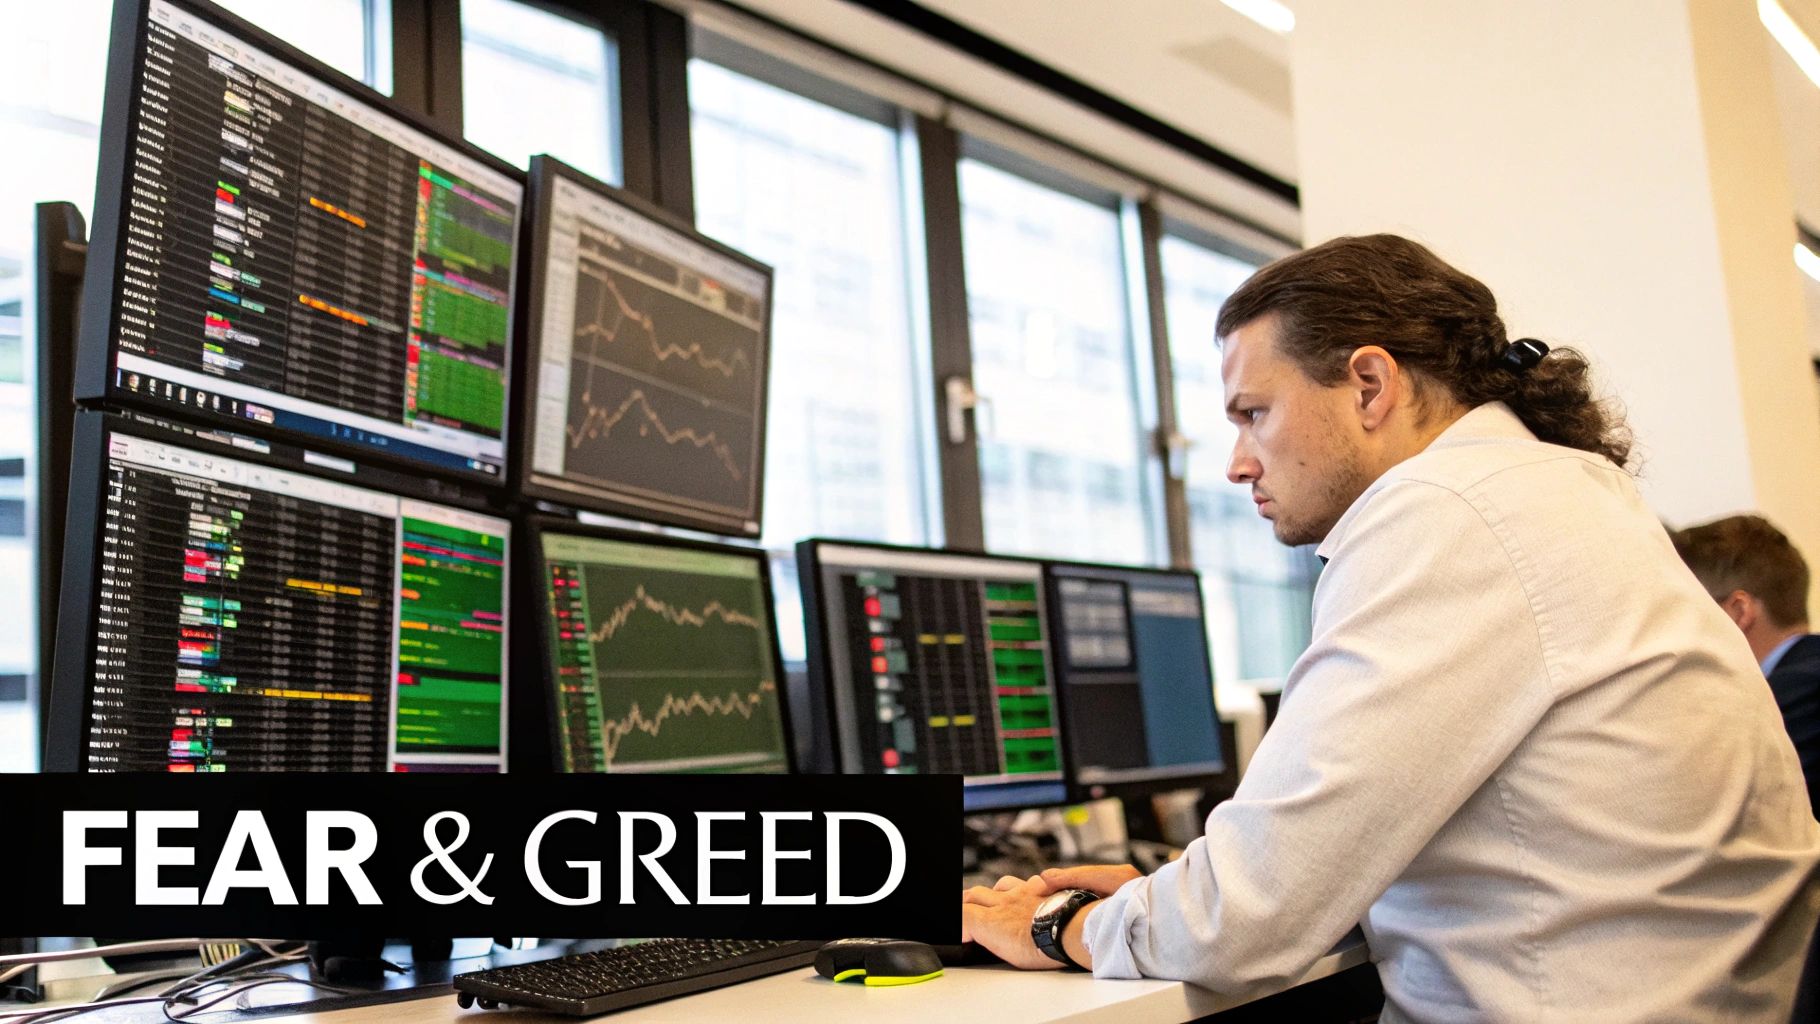
The market Fear & Greed Index is a powerful tool designed to measure one thing: the emotional pulse of the market. It boils down seven key indicators into a single score from 0-100, acting like a market mood ring to tell you if investors are driven more by fear or by greed.
Understanding the Market's Emotional Pulse
Trying to navigate the stock market without understanding its mood is like sailing in choppy seas without a compass. You can guess, sure, but a reliable tool makes all the difference. The Fear & Greed Index is that compass, translating a flood of complex data into a simple, at-a-glance reading of investor sentiment.
The whole idea is pretty simple. When fear takes over, stocks can get pushed way below what they're actually worth. On the flip side, when greed runs wild, prices can get inflated to bubble-like levels.
By putting a number on these emotions, the index becomes an incredibly useful contrarian signal. It helps you spot when the crowd is getting a little too pessimistic or dangerously euphoric.
The Logic Behind the Numbers
The real magic of the index isn't just the final score; it's how it helps you see potential turning points in the market. It forces you to ask the right questions:
- Are stock prices moving because of solid fundamentals, or is it just raw emotion?
- Is the market getting frothy, with investors taking on way too much risk?
- Is widespread panic creating a rare buying opportunity for those with a long-term view?
This constant tug-of-war between fear and greed is a central theme in behavioral finance, which studies how our psychological quirks mess with our financial decisions. If you want to go deeper on that, check out our guide on what is behavioral finance and how does it work.
Warren Buffett famously said to be "fearful when others are greedy and greedy when others are fearful." The index is basically that philosophy, but with data. It’s a practical way to see when the emotional pendulum has swung too far one way or the other.
A Practical Tool for Modern Investors
Let's be clear: no single tool can predict every market move. That's not the goal here. Instead, think of the Fear & Greed Index as another layer of confirmation for your own research.
If the index reading aligns with your analysis, it can give you that extra bit of confidence to pull the trigger. But if it flat-out contradicts your gut feeling, it’s a great signal to pause, step back, and double-check your assumptions. It's a sanity check—a way to cut through the daily noise and get a handle on the bigger emotional picture driving the market.
Breaking Down the Seven Key Index Components
The Fear & Greed Index isn't just some number pulled out of thin air. It’s a carefully calibrated score built from seven distinct market indicators. Think of each component as a different sensor, picking up specific signals from across the financial world. When you blend them all together, you get a surprisingly clear picture of what investors are really feeling.
To trust the index, you have to know what's under the hood. It’s like a chef’s signature recipe—the final result depends entirely on the quality and blend of its ingredients. Let’s pull back the curtain on each one.
Market Momentum and Strength
First up is Market Momentum, which pits the S&P 500 against its own 125-day moving average. When the index is flying high above that long-term average, it’s a classic sign of strong positive momentum—and greed. But if it dips way below, fear is probably creeping in.
Next, we have Stock Price Strength. This one is straightforward: it counts the number of stocks on the New York Stock Exchange hitting 52-week highs versus those hitting 52-week lows. More stocks hitting new highs? That’s bullish optimism, plain and simple.
Then there's Stock Price Breadth. This looks at the trading volume of stocks that are going up versus those going down. When the volume of advancing stocks crushes the volume of declining ones, it tells you the bullish sentiment is strong and widespread, pushing the index toward greed.
This visual shows how some of the most critical inputs—like momentum, volatility, and options—all feed into that final index score.
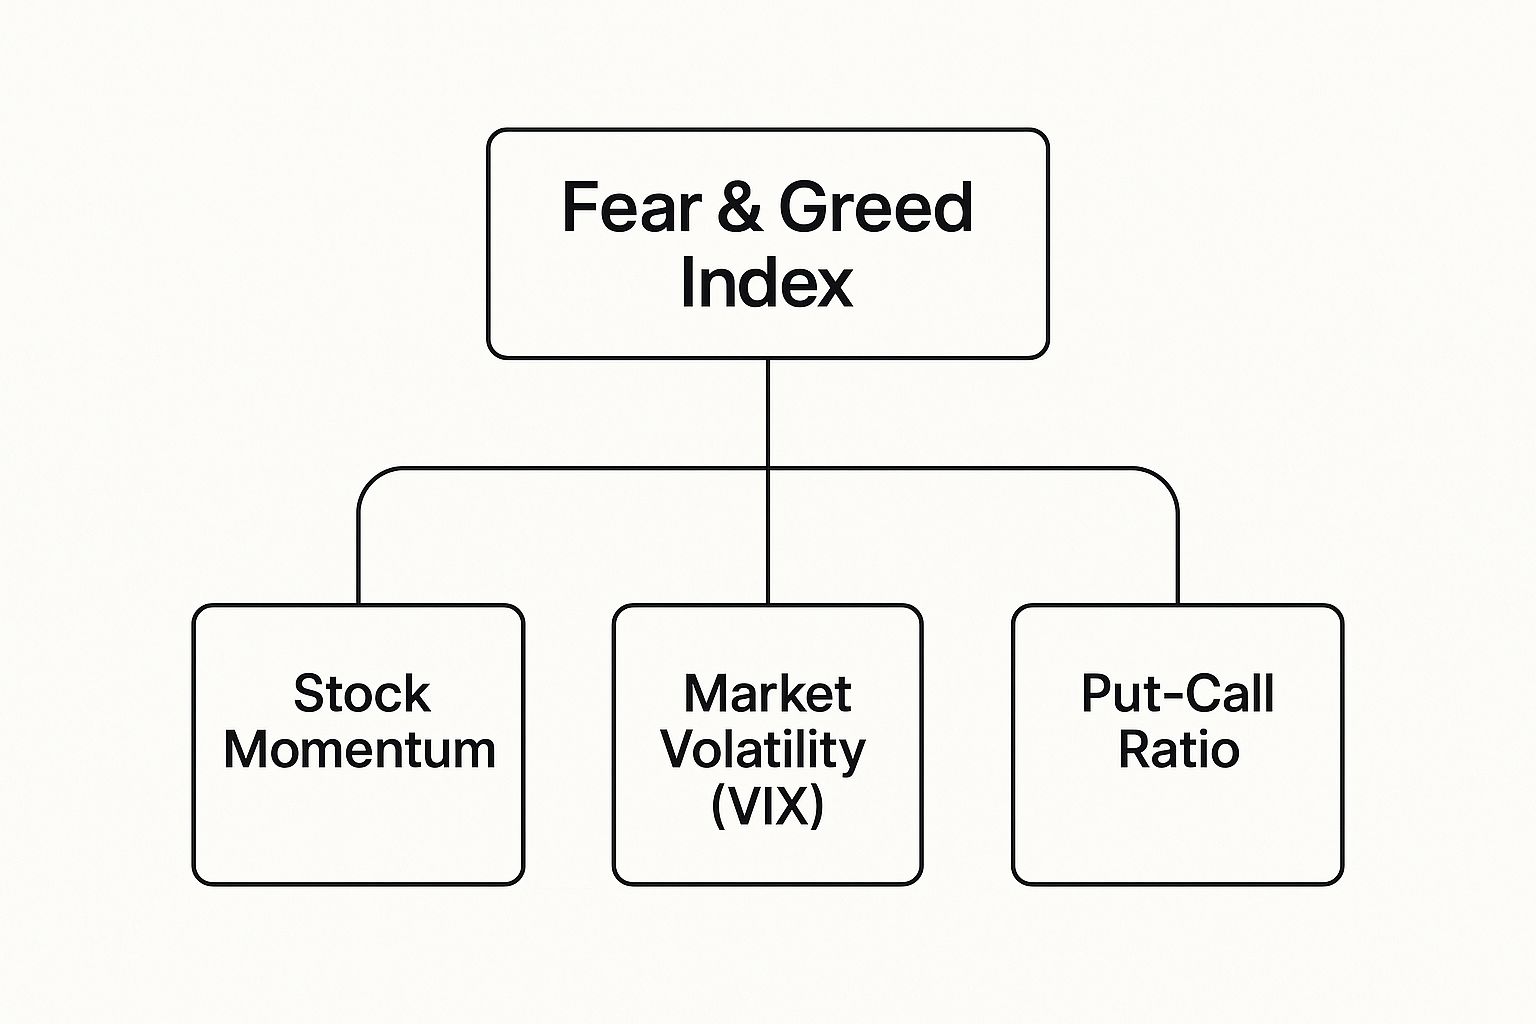
It’s a great illustration of how the index isn't just one thing, but a synthesis of several different data points that together tell a story about market psychology.
Options and Volatility Signals
Now for the betting markets. The Put and Call Options ratio is a direct look at where traders are placing their money. Puts are bets that prices will fall, while calls are bets they’ll rise. When you see a high ratio of puts to calls, it means investors are bracing for a downturn, signaling fear.
Closely related is Market Volatility, which is famously tracked by the VIX. Often called the "fear index," the VIX measures expected volatility over the next 30 days. When the VIX starts climbing, it means uncertainty and fear are on the rise, which naturally pulls the index score down.
It's important to know these seven factors aren't all weighted equally. Each one is measured against its own historical average to see how far it's deviating from the norm. That deviation is what determines its contribution to the final 0-100 score, giving a much more nuanced view of market sentiment.
For a closer look at the exact calculations and weightings, you can check out our detailed breakdown of how the Fear Greed Tracker works.
Risk Appetite Indicators
Finally, let's follow the money. Safe Haven Demand compares the performance of stocks against U.S. treasury bonds. When investors start piling into the safety of bonds, you know fear is high. But when they're chasing the higher returns of stocks, greed is in the driver's seat.
The last piece of the puzzle is Junk Bond Demand. This looks at the yield spread between investment-grade corporate bonds and riskier "junk" bonds. A narrow spread means investors are happy to take on more risk for a little extra return—a classic sign of greed. When that spread widens, investors are demanding a much bigger reward for taking risks, which signals fear.
Here's a quick summary of how each component contributes to the overall index score.
Components of the Fear & Greed Index
| Indicator | What It Measures | Signal for Greed | Signal for Fear |
|---|---|---|---|
| Market Momentum | The S&P 500's position relative to its 125-day moving average. | S&P 500 is high above its average. | S&P 500 is far below its average. |
| Stock Price Strength | The number of stocks at 52-week highs vs. lows. | More stocks hitting new highs. | More stocks hitting new lows. |
| Stock Price Breadth | Trading volume in advancing vs. declining stocks. | Advancing volume is much higher. | Declining volume is much higher. |
| Put and Call Options | The ratio of bearish put options to bullish call options. | More call options being bought. | More put options being bought. |
| Market Volatility | The VIX, which measures expected 30-day volatility. | VIX is low and stable. | VIX is high and rising. |
| Safe Haven Demand | The performance of stocks versus treasury bonds. | Stocks are outperforming bonds. | Bonds are outperforming stocks. |
| Junk Bond Demand | The yield spread between junk bonds and investment-grade bonds. | The spread is narrow. | The spread is widening. |
By bringing these seven unique viewpoints together, the Fear & Greed Index gives us a well-rounded, multi-faceted look at the market's emotional state. When you understand what each component is telling you, the final score becomes a much more powerful tool in your trading arsenal.
How to Read and Interpret the Index Signals
Knowing what goes into the market Fear & Greed Index is one thing, but the real art is learning to read its signals. The index gives you a simple score from 0 to 100, broken down into emotional zones that tell a story about where the market’s head is at.
Think of it like a weather forecast for Wall Street. A reading from 0-25 isn't just a cool breeze; it's a full-blown blizzard of panic. On the flip side, a 76-100 score suggests a heatwave of euphoria is scorching the market, and some investors might be about to get burned.
The smartest way to use these readings is as a contrarian indicator. When everyone else is scared, it often means assets are oversold and cheap. When they're greedy, it’s a red flag that the market might be overbought and due for a reality check.
Decoding the Fear Zones
When the index drops, fear is officially in the driver's seat. This part of the scale has two main areas you'll want to watch.
Fear (26-49): In this zone, investors are getting nervous. They’re selling off their riskier assets, buying up protective options, and generally getting defensive. It's a clear signal that the optimism is starting to wear off.
Extreme Fear (0-25): This is where outright panic lives. A score this low means investors are dumping everything, fueled by bad news and pessimism. The good news? These moments of pure capitulation have historically marked major market bottoms.
This is exactly what Warren Buffett was talking about. When the index screams Extreme Fear, the crowd is running for the exits. For a disciplined investor, that’s your cue to start shopping for quality assets on sale, not to join the herd.
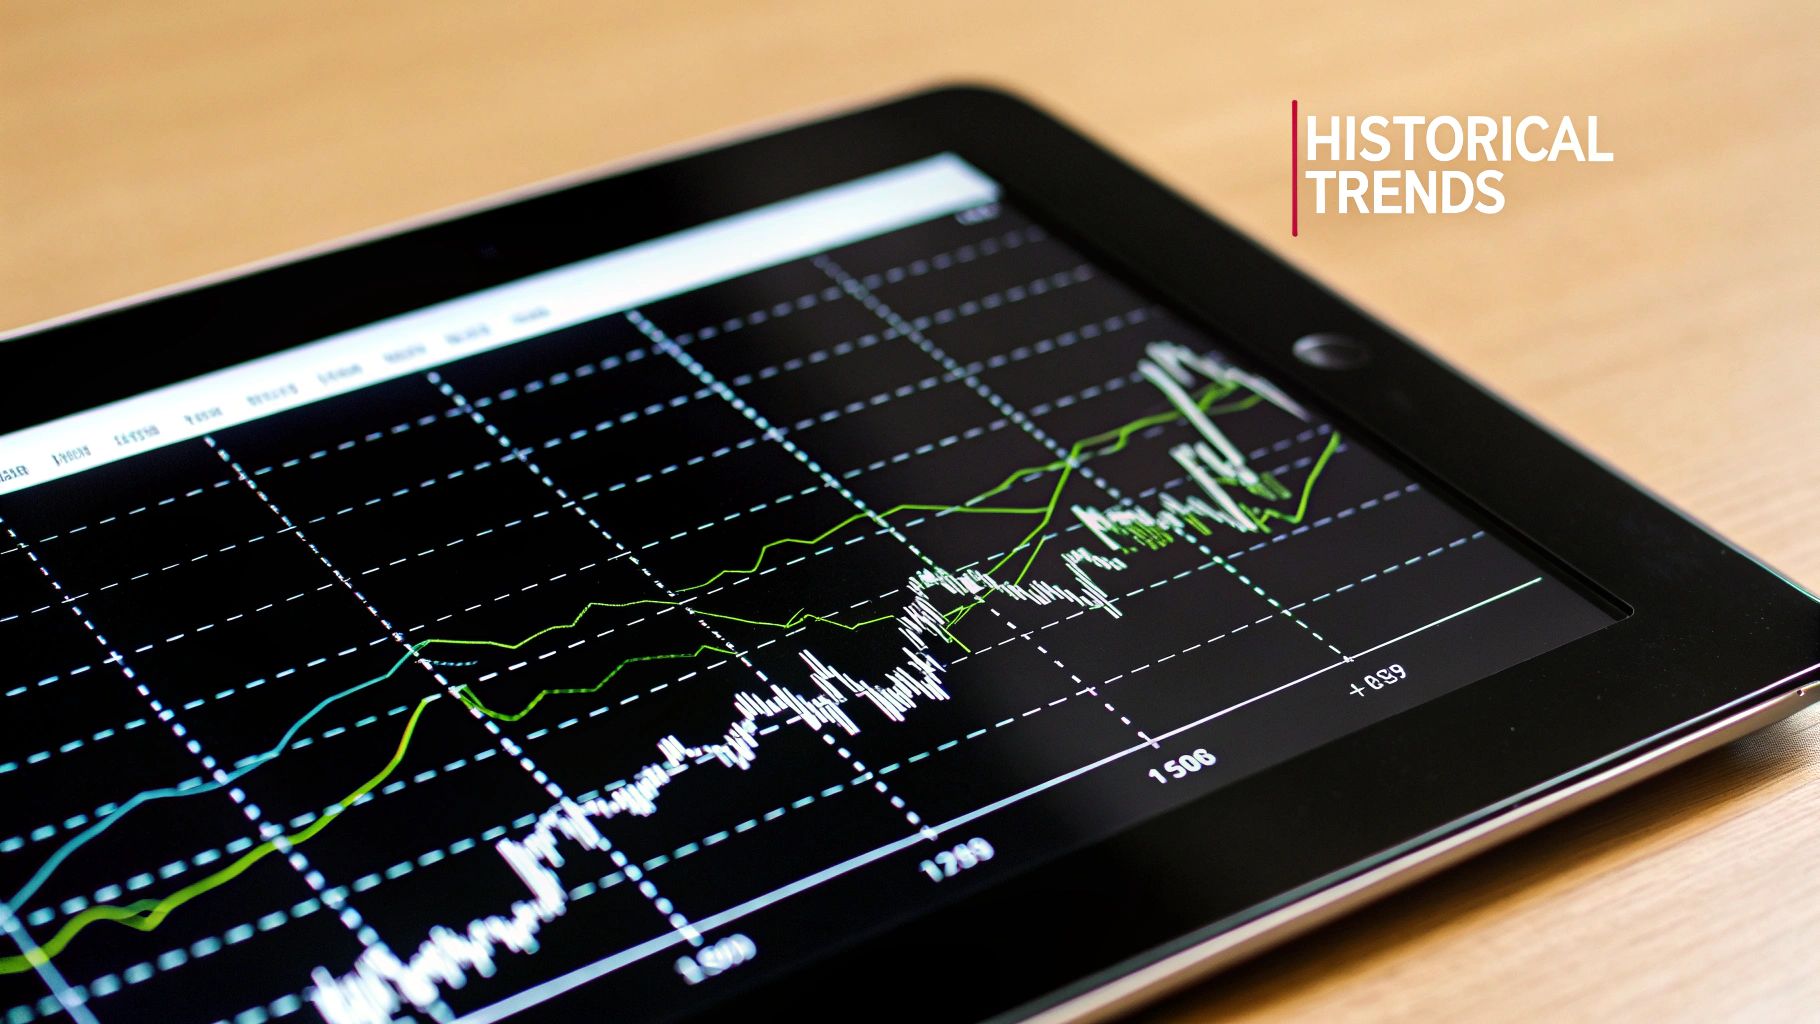
Historical data from 2011 to 2025 shows the average Fear and Greed Index value sits around 49.18—almost dead neutral. Interestingly, extreme fear readings (below 10) only happen about 15% of the time. This tells us that while these moments of peak panic feel intense, they’re relatively rare opportunities. You can dive deeper into the historical performance of the Fear & Greed Index on FinHacker.
Interpreting the Greed Zones
When the needle swings the other way, it’s a sign that investors are getting a little too confident and might be ignoring some serious risks to chase quick profits.
Greed (51-75): Welcome to the confidence zone. Investors are buying, taking on more risk (like loading up on junk bonds), and feeling pretty good. While things look sunny, it can also be the first sign of complacency creeping in.
Extreme Greed (76-100): Now, we're in full-blown euphoria territory. This is where you see speculative bubbles, serious FOMO (fear of missing out), and prices that have completely detached from reality. Just like Extreme Fear can signal a bottom, Extreme Greed is a massive warning sign that a market top could be just around the corner.
When the index gets this high, it’s time to be cautious. Review your portfolio, maybe tighten up your stop-losses, and think twice before chasing that hot stock everyone is talking about. It doesn’t mean a crash is imminent, but it does mean the market is priced for perfection, and the slightest bit of bad news could send it tumbling.
Applying the Index to Your Trading Strategy
Knowing what the market Fear & Greed Index is telling you is one thing. Turning that insight into a real trading edge is something else entirely. We're not talking about replacing your entire analysis, but supercharging it. Think of the index as an emotional overlay that helps you stay objective when everyone else is losing their cool.
The whole game here is contrarian thinking. Warren Buffett nailed it when he advised being "greedy when others are fearful." When the index crashes into Extreme Fear, it’s a screaming signal that panic selling has taken over. This isn't a blind "buy everything" signal, but it's a powerful nudge to start hunting for high-quality assets that have been unfairly hammered down by the mob.
On the flip side, a sky-high reading of Extreme Greed is a massive red flag. It’s the market’s way of saying euphoria is in the driver's seat and investors are probably ignoring huge risks because of FOMO. That's your cue to take a hard look at your portfolio, maybe skim some profits off the top, and tighten up your risk management.
A Framework for Action
To use the index right, you need a disciplined, repeatable process. It's not a crystal ball for picking exact tops and bottoms; it's a confirmation tool. When you combine its readings with your own technical and fundamental homework, you build a much stronger foundation for your decisions.
Here’s a simple, practical framework to get you started:
- Get the Lay of the Land: First, check the current index reading. Is the market scared, greedy, or just cruising in neutral? This gives you the emotional backdrop for the day.
- Think Like a Contrarian: If the index is showing Extreme Fear, your default mindset should be to hunt for buys. If it’s screaming Extreme Greed, your focus flips to managing risk and protecting your gains.
- Do Your Own Homework (This is Crucial): Never, ever trade on the index reading alone. A signal of Extreme Fear should send you to your watchlist to find great assets that now look cheap. Does your technical analysis agree? Are prices bouncing off a key support level? Does your fundamental research still back up the long-term story?
- Execute with a Plan: Once your own analysis lines up with the index’s signal, you can pull the trigger with way more confidence. But remember, your entry and exit points are still dictated by your strategy, not just the sentiment number.
The index is basically a filter for your own cognitive biases. Fear and greed trick us into terrible decisions, like chasing speculative bubbles or panic-selling at the bottom. The index shines a spotlight on these emotional traps, forcing you to step back and trust your analysis, not your gut.
Real World Application Scenarios
Let's make this concrete with a couple of real-world examples.
Scenario 1: Capitalizing on Extreme Fear
The market has been bleeding for weeks. Every headline is doom and gloom. You check the Fear & Greed Index and see it’s sitting at 15 (Extreme Fear). Instead of joining the panic, you see a potential opening.
- You pull up your watchlist of fundamentally solid companies.
- You spot a tech leader you've been eyeing, now down 30% and trading right near a major long-term support zone.
- A quick review of your fundamental notes confirms the company’s growth story hasn't changed.
- The index reading gives you the conviction to start building a position, knowing you’re buying when pessimism is thickest.
Scenario 2: Playing Defense During Extreme Greed
The market is on fire. Your neighbor, your barista—everyone is bragging about their stock market winnings. The Fear & Greed Index is flashing 85 (Extreme Greed).
- You look at your portfolio and see some massive unrealized gains.
- Instead of chasing the rally, you decide it’s time to play defense.
- You might trim a portion of your best-performing stocks to lock in those profits.
- You also tighten the stop-loss orders on your other positions to protect your capital if the party suddenly ends.
Below is a quick cheat sheet summarizing how you might think about different index readings, whether you're a contrarian or a trend-follower.
Index Reading vs. Potential Trading Action
This table breaks down how different investors might interpret and act on the index's signals.
| Index Reading | Investor Sentiment | Potential Contrarian Strategy | Potential Risk |
|---|---|---|---|
| 0-25 (Extreme Fear) | Panic & Capitulation | Look for high-quality, oversold assets to buy. | Catching a "falling knife" if the downtrend continues. |
| 25-45 (Fear) | Anxiety & Pessimism | Begin scaling into positions on your watchlist. | Market could see further downside before recovering. |
| 55-75 (Greed) | Optimism & Excitement | Review portfolio, consider trimming overextended positions. | Missing out on further upside if the rally continues. |
| 75-100 (Extreme Greed) | Euphoria & Complacency | Tighten stop-losses, avoid new long positions. | Selling too early and leaving profits on the table. |
Ultimately, becoming a master of the index means building a system that can withstand your own emotional rollercoaster. But how do you know if your system actually works? You have to test it. Our detailed guide on how to backtest trading strategies provides an essential framework for running your ideas against historical data. This is how you move from guessing to building a truly data-driven trading plan.
Learning from Major Market Events
To really see the power of the market Fear & Greed Index, you have to look back at how it behaved during the market’s most unhinged moments. Examining its readings during epic crashes and euphoric rallies offers a masterclass in market psychology. These events reveal a clear, predictable pattern: collective emotion consistently pushes markets to irrational extremes, and the index captures it all as it happens.
By studying these historical flashpoints, we can go from theory to tangible proof. The index doesn't just measure sentiment; it paints a vivid picture of the exact moments that define market cycles. Think of it as a historical roadmap, showing when fear was a green light to buy and when greed was a blaring red siren.
The 2008 Financial Crisis: A Crucible of Fear
The 2008 global financial crisis was one for the history books—a period of pure, unadulterated panic. As major banks collapsed and the world economy teetered on the brink, you could practically feel the fear in the air. The Fear & Greed Index mirrored this terror perfectly, plunging to historic lows.
In the darkest days of the crisis, right as the S&P 500 was carving out its bottom, the index fell deep into Extreme Fear. This wasn’t just a number; it was a quantifiable measure of the mass capitulation that seizes investors during a crash. For anyone watching the index, it was a flashing sign that pessimism had hit an unsustainable peak—often the exact precursor to a major market reversal.
The 2020 Pandemic Crash: A Rapid Plunge
The COVID-19 pandemic kicked off one of the fastest bear markets ever recorded in early 2020. Uncertainty was off the charts, and the global economic shutdown sent shockwaves through the financial system. Once again, the Fear & Greed Index nailed the mood with stunning accuracy.
As markets went into a freefall, the index plummeted, signaling Extreme Fear. The historical data tells a powerful story here. The index has a solid track record of flagging key market turning points, which we saw during major global events.
For instance, the index was crucial in identifying the panic during the 2008 crisis when it dipped below 10. In early 2020, as the pandemic hit, it bottomed out at 8, reflecting a fresh wave of terror as global markets crashed. Conversely, it also flags periods of extreme greed, like the 2017 tech-led boom when FAANG stocks pushed the index above 80. You can dig deeper into these historical sentiment shifts on Axiory.
This image shows the index's real-time reading, giving you a quick snapshot of current market sentiment.
Just by looking at the dial, you get an immediate, intuitive sense of where the market stands emotionally—somewhere between terror and euphoria.
Bull Markets and Peaks of Greed
The index is just as good at calling out unsustainable optimism. During the run-ups before major corrections—like parts of the post-pandemic rally or the speculative craze of late 2021—the index often shot up into Extreme Greed.
When the index value consistently stays above 75, it's a strong indicator of market froth and investor complacency. This doesn't mean a crash is imminent, but it does mean risk is elevated because everyone has bought into the same positive story.
These periods of euphoria are classic "fear of missing out" (FOMO) territory. History shows that when the index hits these greedy peaks, it can be a perfect time for disciplined investors to review their holdings, manage risk, and sidestep the speculative mania. The pattern is undeniable: major market tops almost always go hand-in-hand with extreme levels of greed.
Don't Get Burned: Common Pitfalls and Misconceptions
The market Fear & Greed Index is a fantastic tool for gauging the market's mood, but thinking of it as an infallible crystal ball is a surefire way to get into trouble. No single indicator is perfect. Its real power comes from knowing its limits.
One of the biggest mistakes traders make is treating the index as a precision timing tool. It's not. The market can stay irrational far longer than your account balance can stay solvent. A bull run can simmer in "Extreme Greed" for months before it runs out of steam, just as a market can wallow in "Extreme Fear" for weeks before it finally bottoms out.
Thinking an "Extreme Fear" reading is an automatic green light to buy is a classic trap. While it hints that assets might be on sale, it doesn't guarantee prices won't drop further. This is what traders call "catching a falling knife"—jumping in too early before the sellers are truly finished.
The Lag and the Linger Effect
The index is a snapshot of what just happened, making it a reactive or lagging indicator. It tells you the emotional temperature right now, but it can't tell you how long the fever or the chills will last. This "linger effect" is something you have to respect.
Think about these common scenarios where the index can lead you astray if you look at it in a vacuum:
- Prolonged Greed: During a roaring bull market, the index can hang out in "Greed" or "Extreme Greed" for a long, long time. If you sell just because the reading is high, you could miss out on a huge chunk of the upside.
- Persistent Fear: After a major crash or shocking news, fear can stick around like a bad smell, even after the worst is over. The index might stay low as the market slowly and painfully starts to grind its way back up.
Relying solely on the Fear & Greed Index is like driving a car using only the rearview mirror. It tells you exactly where you've been, which is useful, but it doesn't show you the road ahead. Always combine its signals with forward-looking analysis.
Resisting the Knee-Jerk Reaction
The whole point of the index is to help you fight your own emotional biases, not create new ones. Seeing a 90 ("Extreme Greed") might make you want to smash the sell button on your entire portfolio. A score of 10 ("Extreme Fear") might tempt you to go all-in without a second thought. Don't do it.
Instead, use the index as a trigger for action—not the action itself. A high reading should prompt a portfolio review, not a panic sell. A low reading should kick off your research for great buying opportunities, not a blind shopping spree.
Let the index be the starting gun for your decision-making process, never the finish line. When you use it as a guide instead of a gospel, you'll sidestep the pitfalls and make smarter, more level-headed trades.
Common Questions About the Fear & Greed Index
Even after getting the hang of the Fear & Greed Index, a few questions always pop up. Let's run through the most common ones to clear up any confusion and make sure you're using this tool effectively.
Nailing these details will help you weave the index into your trading strategy with confidence, turning it from a cool-but-confusing indicator into a real asset.
How Often Is the Index Updated?
People often wonder how fresh the data is. The official CNN Fear & Greed Index gets updated just once a day, right after the U.S. stock market closes for business.
This daily refresh gives you a clean, end-of-day read on market sentiment. It basically sets the emotional stage for the next trading session, offering a valuable snapshot to think about before the opening bell rings.
Can I Use This for Crypto or Forex?
That's a great question. The original index was built specifically for the U.S. stock market, using components like S&P 500 momentum and NYSE trading volume. So, no, you can't apply it directly to other markets.
However, the idea of measuring sentiment was too good to keep locked in one place. People have created separate Fear & Greed Indexes for other assets, especially crypto. These alternative indexes are built from the ground up with market-specific data, like crypto volatility and social media chatter, to capture the mood of those traders.
So, while the classic index is for stocks only, specialized versions absolutely exist for other arenas.
Does "Extreme Greed" Mean I Should Sell Everything Right Now?
Hold on—this is a super important point. An "Extreme Greed" reading is a warning sign, not a fire alarm telling you to dump all your positions. It’s a signal that the market might be getting frothy and investors are a little too comfortable, which seriously raises the risk of a sudden pullback.
Think of it as a yellow traffic light, not a red one. It’s telling you to slow down and be careful, not to slam on the brakes.
Instead of hitting the panic-sell button, an Extreme Greed reading should prompt you to be a smarter, more defensive trader. Here’s what to do:
- Review your portfolio: Are any of your winners looking a bit overstretched? It might be time to take some profits off the table.
- Tighten your stop-losses: Protect the gains you've made. If the market does turn, you want your safety net in place.
- Hit pause on new buys: This is probably not the best time to be opening new long positions. Wait for a better entry when the euphoria dies down.
It’s all about disciplined risk management, not a knee-jerk reaction.
Ready to stop guessing and start measuring market sentiment? Fear Greed Tracker provides real-time scores for over 50,000 assets, helping you make data-driven decisions. Get your edge today.