
At the heart of every market move, you’ll find two raw, powerful emotions: fear and greed. These two forces are the invisible hands that guide investors, pushing them to either pile into stocks with unbridled optimism or dump them in a frantic panic. Getting a handle on this emotional tug-of-war is the first step to making smarter, less reactive trading decisions.
The Emotional Pendulum of the Stock Market
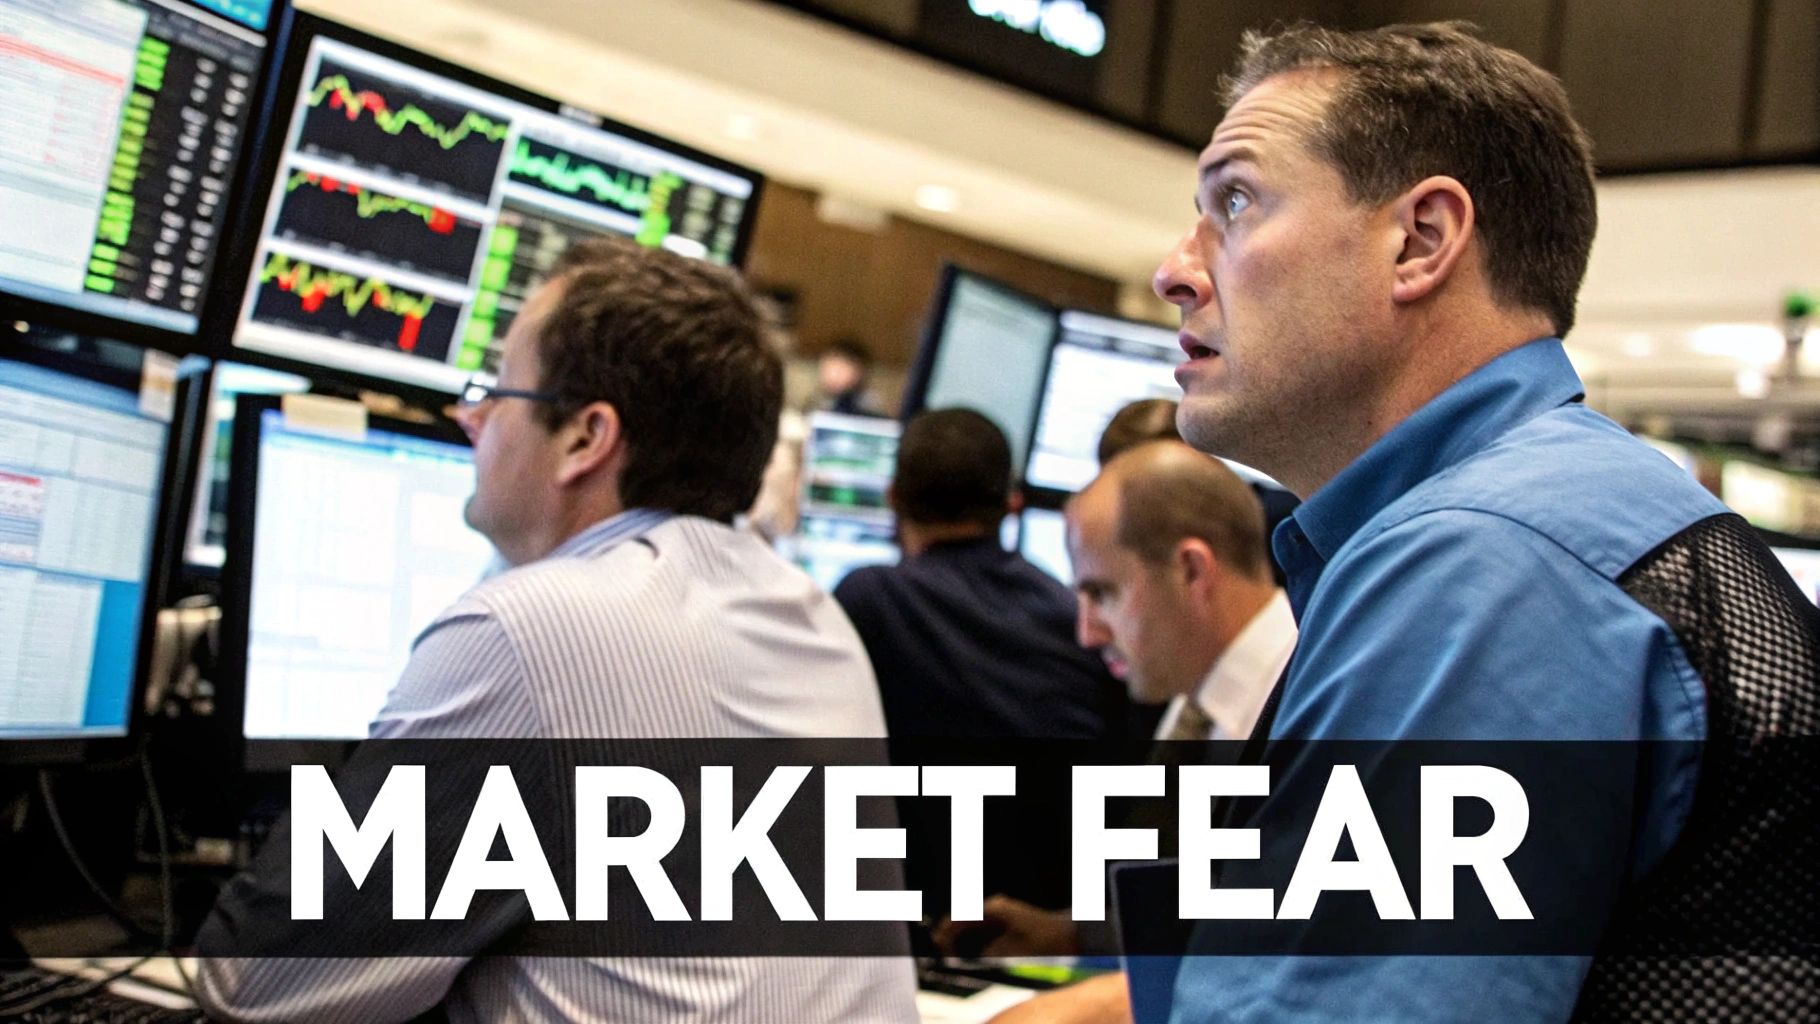
Picture the stock market as a massive pendulum, always swinging from one extreme to the other. On one end, you've got greed—that intoxicating rush of optimism where everyone feels like a genius and prices can only go up. On the other, you have fear—a chilling wave of pessimism that sends everyone scrambling for the exits, desperate to cut their losses.
These emotional tides don't just affect a few traders; they define the entire market's behavior. This collective mindset creates predictable cycles, swinging from overvalued peaks to undervalued troughs, and that’s where the real opportunity lies for those who know how to read the room.
Why Market Psychology Matters
Understanding fear and greed is every bit as important as digging through a company’s financial statements or analyzing a price chart. A stock could have flawless fundamentals, but if the market is caught in the grip of fear, its price will almost certainly get dragged down with everything else. In the same vein, when a greed-fueled rally takes off, even stocks of shaky companies can get swept up and soar to irrational heights.
No one said it better than legendary investor Warren Buffett:
"Be fearful when others are greedy, and greedy when others are fearful."
This isn't just a catchy quote; it's the core philosophy behind contrarian investing. It’s all about spotting the moments when the market's emotions have created a major disconnect between a stock's price and its actual, underlying value.
Recognizing the Emotional Extremes
The key is to learn how to identify which emotion is running the show. Each state has its own distinct personality, and savvy traders learn the tells.
When Greed Dominates: This is when you see FOMO (Fear Of Missing Out) everywhere. Investors chase hot stocks, conveniently ignore red flags, and load up on risk, all for the shot at a quick gain. This behavior is what inflates speculative bubbles, pushing asset prices far beyond what they’re truly worth.
When Fear Dominates: When fear takes the wheel, panic selling is the name of the game. Investors start dumping assets without thinking, often selling them for less than their intrinsic value just to stop the bleeding. This environment is marked by wild price swings and a rush to "safe" assets like cash or government bonds.
If you can master the art of gauging market sentiment, you can step outside the emotional whirlwind. Instead of getting carried along with the herd, you can make calculated moves—buying when assets are on sale and selling when they’re overpriced. This guide will show you exactly how to do that.
How the Fear and Greed Index Actually Works
To make smart decisions, you need reliable data. The Fear & Greed Index is like a weather forecast for market psychology, distilling tons of complex data into a single, easy-to-read number. It was built to quantify which emotion—fear or greed—is really driving the market on any given day.
Think of it as a sophisticated machine that takes in seven different ingredients, each one measuring a unique slice of investor behavior. It blends them together, gives them equal weight, and spits out a final score from 0 (Extreme Fear) to 100 (Extreme Greed). This score is a powerful snapshot of the market's collective mood.
Breaking Down the Seven Key Indicators
To really get what the index is telling you, it helps to know what’s under the hood. Each of the seven indicators is like a clue, pointing toward the dominant sentiment.
Here’s a look at each component and what it’s actually measuring:
- Stock Price Momentum: This pits the S&P 500 against its 125-day moving average. When the index is flying high above its average, it’s a classic sign of greed and strong positive momentum.
- Stock Price Strength: This tracks the number of stocks hitting 52-week highs versus those hitting 52-week lows on the New York Stock Exchange. More highs than lows suggest traders are feeling bullish and greedy.
- Stock Price Breadth: Here, we look at the trading volume of stocks that are going up versus those going down. When rising stocks have way more volume behind them, it shows strong buying conviction—a clear tell for greed.
- Put and Call Options: This compares the trading volume of bearish put options to bullish call options. A high put/call ratio means investors are hedging their bets and buying protection against a drop. That’s fear, plain and simple.
- Junk Bond Demand: This measures the gap (or spread) between yields on safe, investment-grade bonds and riskier "junk" bonds. When investors get greedy, they’re willing to take on more risk for lower returns, which narrows this spread.
- Market Volatility (VIX): Often called the "fear gauge," the VIX measures the market's expectation of volatility. A rising VIX means uncertainty is creeping in, and investors are getting scared.
- Safe Haven Demand: This indicator compares the returns of stocks versus Treasury bonds. In times of fear, investors run to the safety of bonds, causing them to outperform stocks.
This infographic shows how these different indicators come together to paint a complete picture of the market's mood.
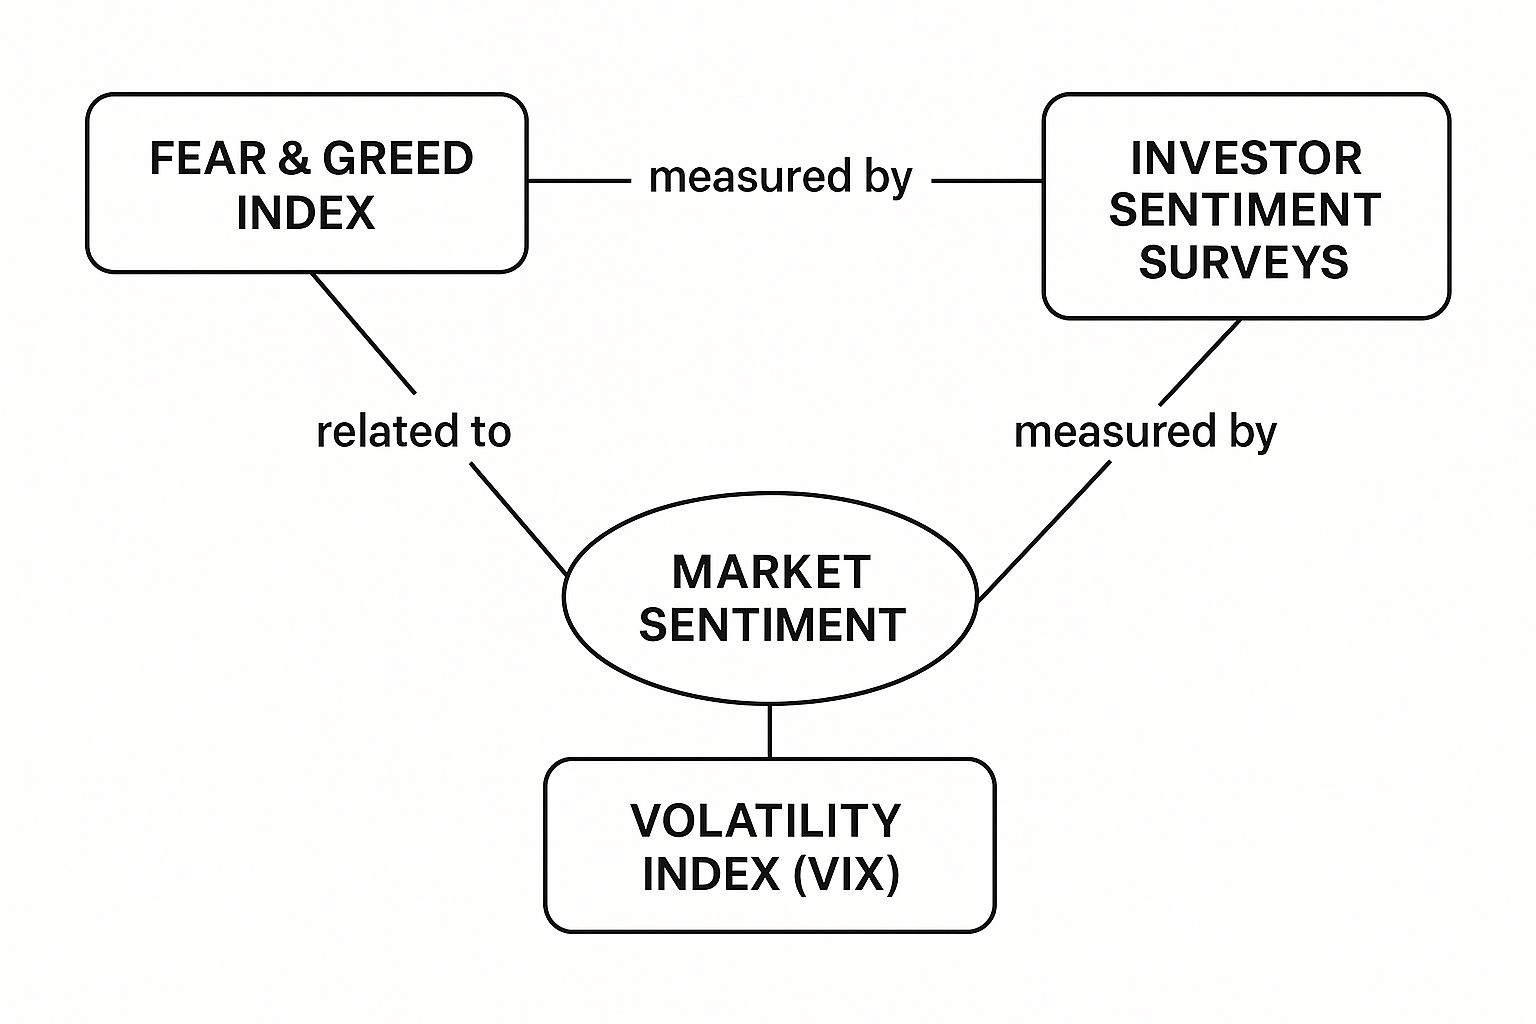
By weaving together data from sources like the VIX and options markets, the index gives you a far more reliable signal than you’d get from any single metric on its own.
A Statistically Robust Market Barometer
One of the most trusted tools for this is the CNN Fear & Greed Index, which has been tracking investor emotions since 2011. Historical data shows that from 2011 to 2025, the average index value was 49.07—almost perfectly neutral.
Fear was the dominant emotion 41% of the time, while greed prevailed for about 42% of the period. This really highlights the constant emotional tug-of-war happening in the market.
By putting a number on these emotional swings, the index offers an objective counterpoint to the gut feelings of FOMO or panic that can derail even the most disciplined trading plans. It’s a tool designed to keep you grounded in data, not drama.
Understanding the mechanics of how fear and greed are measured is the first step. For a deeper dive into the index itself, you can also check out our guide on the Fear & Greed Index in the stock market.
When you master these components, you get a much clearer view of what's truly driving prices, helping you separate genuine market shifts from emotional noise.
Reading Market Sentiment Like a Seasoned Pro
A score from the Fear & Greed Index is just a number. But once you learn to read the story it’s telling, it becomes a powerful tool. This single figure gives you an instant snapshot of the market's collective mood, revealing whether investors are buying with confidence or selling in a panic. Learning to translate this number into actionable intelligence is what separates the pros from the crowd.
At its core, the index is simple. It runs on a scale from 0 to 100. A score closer to 0 signals that fear is running rampant, while a score near 100 means greed is in the driver's seat. The real skill is understanding the specific behaviors tied to each score.
What the Index Levels Mean
Each scoring range on the index paints a picture of a distinct emotional climate. Think of them like a weather forecast for the market—some days are calm and sunny, while others are stormy and unpredictable. Knowing what to expect in each environment is crucial.
The table below breaks down the different levels, explaining what’s typically happening in the market at each stage.
Interpreting the Fear & Greed Index Score
| Index Score | Sentiment Level | Market Characteristics |
|---|---|---|
| 0-24 | Extreme Fear | Widespread panic and indiscriminate selling. Assets often trade below their intrinsic value. This is where market bottoms can form. |
| 25-49 | Fear | A general mood of pessimism and caution. Investors are buying protection and moving toward safer assets. |
| 50 | Neutral | The market is balanced. There's no strong emotional pull in either direction, and sentiment is relatively calm. |
| 51-75 | Greed | Optimism is high, and buying interest is strong. Investors are comfortable taking on more risk for bigger potential rewards. |
| 76-100 | Extreme Greed | Widespread euphoria and FOMO (Fear Of Missing Out). Speculative buying is common, and risk is often ignored. This is where market tops can form. |
When the index shows Extreme Greed, the market often feels like a party that will never end. Investors tend to chase hot stocks and ignore warning signs, pushing prices to levels that just aren't sustainable. It's a dangerous time to get swept up in the hype.
On the flip side, a reading of Extreme Fear paints a much darker picture. It feels like the sky is falling. Investors are dumping even high-quality stocks just to get out. But this is precisely the environment where smart, patient investors find incredible bargains, as prices get completely disconnected from their real value.
A low Fear & Greed Index reading isn’t a signal to panic—it’s a signal to pay attention. It suggests that fear has become so widespread that selling pressure may soon exhaust itself, creating an ideal environment for contrarian investors.
Learning to interpret these scores helps you move beyond simply following the herd. It gives you a framework for spotting when the market’s emotional swings are creating unique risks or unbelievable opportunities.
For a deeper dive, our complete guide to stock market sentiment analysis offers even more insights. By recognizing the signs of stock market fear and greed, you can start making smart moves when everyone else is paralyzed by emotion.
When Fear and Greed Shaped Market History
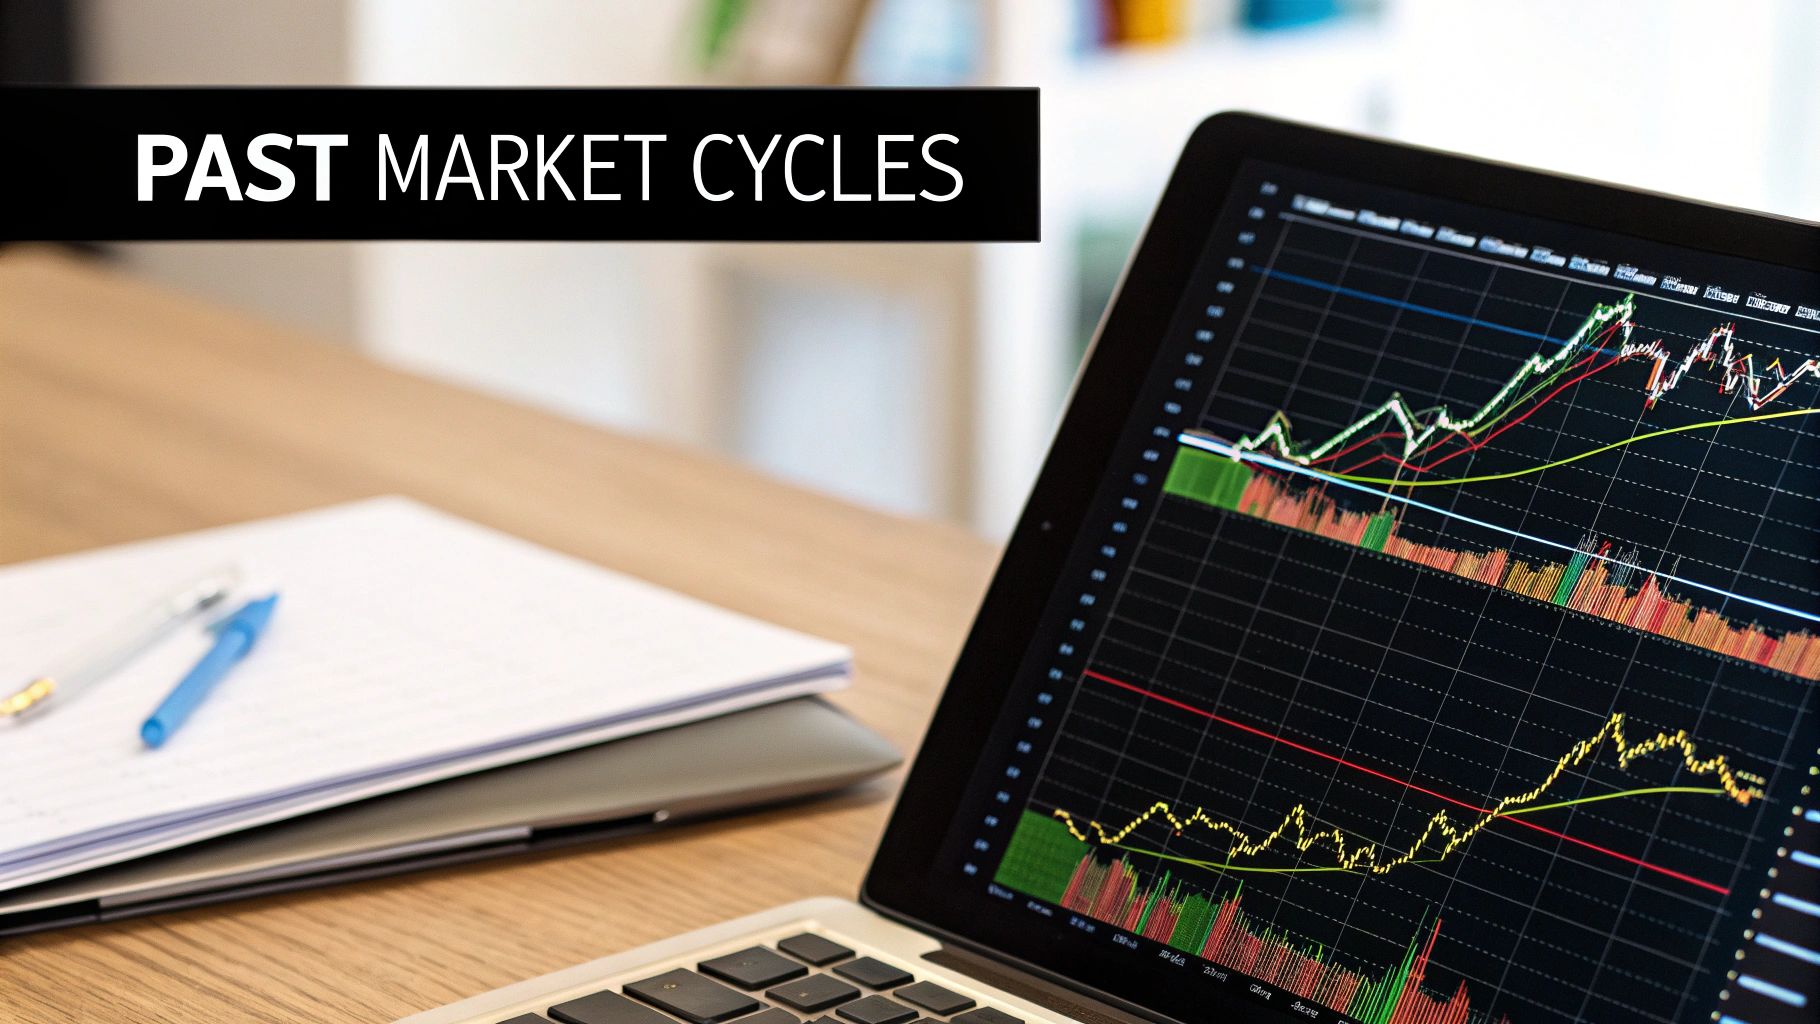
To really get a feel for the raw power of market fear and greed, all you have to do is glance at the history books. These emotional rollercoasters aren't new—they're a pattern that's been repeating itself for as long as markets have existed. The biggest market events, from the giddy highs of a bubble to the gut-wrenching lows of a crash, are perfect case studies.
When you look at these moments, you can see just how far collective emotion can push prices away from any semblance of logic. By revisiting these historic swings, you'll start to see the Fear & Greed Index not just as a data point, but as a genuine map of the market's emotional terrain.
The Dot-Com Bubble: An Era of Extreme Greed
The late 1990s were a masterclass in Extreme Greed. The explosion of the internet sparked a massive speculative fire, and investors couldn't throw their money fast enough at any company with a ".com" in its name. Old-school metrics like revenue or profit? They were tossed right out the window.
A powerful wave of euphoria and FOMO (Fear Of Missing Out) swept across the market. The prevailing belief was that technology had ushered in a "new economy" where the old rules simply didn't apply anymore. This irrational exuberance sent the Nasdaq skyrocketing to unbelievable heights.
Investor psychology was the direct fuel for the market extremes of this era. Periods of Extreme Greed, like the tech bubble in 1999, blew stock prices up far beyond their actual worth. When the bubble finally popped, the Nasdaq crashed by a staggering 78% from its peak in March 2000, vaporizing trillions in market value over the next two years.
The dot-com crash was a painful but incredibly valuable lesson. It was a stark reminder that when the Fear & Greed Index stays pegged in Extreme Greed for too long, a major market reckoning might just be around the corner.
The 2008 Financial Crisis: A Case of Extreme Fear
Not even a decade later, the emotional pendulum swung violently to the other side. The 2008 Financial Crisis, kicked off by the collapse of the subprime mortgage market, threw the entire world into a state of Extreme Fear.
Panic ripped through the markets as iconic financial institutions started to wobble and fail. Investors, absolutely terrified of losing everything, started selling indiscriminately. It didn't matter if an asset was high-quality or toxic—everything was dumped in a desperate flight to the perceived safety of cash.
During this freefall, the Fear & Greed Index would have been stuck at its lowest possible levels, reflecting a deep, overwhelming pessimism.
But in that chaos, a rare opportunity was born for anyone who could see beyond the panic. It was the perfect time to follow Warren Buffett's famous advice: be "greedy when others are fearful." Investors who had the nerve to buy when the market was at its lowest point were rewarded with some of the best returns in a generation as things eventually recovered.
These events aren't just dry history lessons; they're real-world demonstrations of how sentiment indicators actually work. You can dive deeper by exploring A Trader's Guide to the Fear and Greed Index.
By studying these cycles, you can learn to spot the emotional tides and get yourself ready to act with logic when everyone else is running on pure impulse.
Actionable Strategies for Trading Market Sentiment
Knowing the market's mood is one thing. Turning that knowledge into a concrete trading plan is what separates the pros from the crowd. The Fear & Greed Index isn't some magic crystal ball that tells you what’s next. Instead, think of it as a powerful discipline tool. It keeps you grounded when your own emotions—and everyone else's—are screaming at you to do the exact wrong thing.
By adopting a contrarian mindset, you can learn to use the market’s predictable emotional roller coaster to your advantage. It’s all about having a playbook ready for when fear runs wild and another for when greed gets out of hand.
What to Do When the Market Is Fearful
When the index plummets into Extreme Fear, usually below a score of 25, you can almost feel the panic in the air. Investors are dumping stocks without a second thought, and every headline spells doom. Your first instinct might be to run for the hills with everyone else, but this is often the point of maximum opportunity.
This is your cue to start thinking like a bargain hunter. The main goal here is to pick up high-quality assets while they're on sale.
- Systematically Scale into Positions: Don't try to catch the falling knife by timing the absolute bottom. Instead, start by buying small stakes in solid companies you've already researched. If the price drops further, you can keep buying at even better prices—a strategy known as dollar-cost averaging.
- Hunt for Oversold Bargains: Widespread fear often drags down perfectly good stocks along with the bad ones. This is the perfect time to screen for fundamentally strong companies that have been unfairly beaten up in the panic.
- Maintain a Long-Term Perspective: Remember, market panics don't last forever, but quality businesses almost always recover. Keep your eyes on the long-term value, not the short-term noise.
What to Do When the Market Is Greedy
On the flip side, when the index rockets into Extreme Greed (a score above 75), euphoria takes over. Everybody feels like a genius, and the fear of missing out (FOMO) is intense. This is precisely the time to play defense, not get more aggressive.
Your focus should pivot from chasing bigger gains to protecting the profits you’ve already made. This is where sharp risk management becomes your best friend.
A classic mistake investors make is confusing a bull market with their own brilliance. When the index flashes Extreme Greed, it’s a signal to get more disciplined and trim your sails, not to chase the hype.
Here are a few defensive moves to consider:
- Trim Winning Positions: Systematically sell off a portion of your best-performing stocks to lock in those gains. You don’t have to sell everything, but taking some profits off the table is a smart way to reduce your risk.
- Tighten Your Stop-Losses: A stop-loss is an order that automatically sells a stock if it falls to a certain price. Tightening these orders helps protect your portfolio from a sudden market reversal.
- Build a Cash Reserve: Raising your cash levels gives you two huge advantages. First, it safeguards your capital from a potential downturn. Second, it gives you the "dry powder" you'll need to go shopping when fear inevitably makes its return.
This dynamic approach is a cornerstone of smart portfolio management. For instance, some strategies automatically adjust their market exposure based on sentiment. By tracking metrics like the percentage of stocks trading above a long-term moving average, a system can build up its cash position during high-fear periods and be fully invested when greed is fueling a bull run. You can see how these kinds of portfolio strategies work by exploring a real-world example of a Fear and Greed strategy.
Common Questions About Trading with Fear and Greed
Even after you get a good handle on stock market fear and greed, you're bound to run into practical questions. It’s one thing to understand a concept; it’s another to apply it when your money is on the line. Let's walk through some of the most common questions traders have so you can start using sentiment analysis with more confidence.
This isn't about finding some magic formula. It’s about building a smarter, more disciplined way to approach your trading.
Can I Use the Fear & Greed Index for Day Trading?
While the index gives you a fresh snapshot of sentiment every day, it’s really built for swing trading or spotting longer-term market shifts. Its seven components are designed to measure broad market trends, not the frantic, minute-by-minute action that day traders live and breathe.
Think of it like a daily weather forecast. It’s great for telling you whether to expect a sunny day or a thunderstorm, which helps you decide if it’s a good day to be outside at all. But you wouldn't use that same forecast to predict exactly when and where a single raindrop will land in the next 60 seconds.
Use the index to get a feel for the market’s overall climate before you dive into your short-term moves.
Is the Fear and Greed Index Ever Wrong?
Absolutely. No single indicator is a silver bullet, and the Fear & Greed Index is no exception. The market can get stuck in "Extreme Greed" or "Extreme Fear" for way longer than anyone expects. This can be incredibly frustrating, even for experienced contrarian investors waiting for the reversal.
Remember, the index is a barometer, not a crystal ball. It measures what the crowd is feeling right now; it doesn't predict the future.
It's critical to treat the index as just one tool in your toolbox. Always pair its insights with your own technical and fundamental analysis to build a complete picture of what's really going on.
How Should a Beginner Use This Index?
If you're new to trading, this index is one of your best friends for building discipline and managing risk. It’s a powerful, objective voice that helps you push back against the two most dangerous emotions in trading: FOMO and panic.
- During "Extreme Greed": See this as a flashing yellow light. It’s a gut check, reminding you not to chase speculative hype. Use it to double-check that your positions are backed by solid reasoning, not just market euphoria.
- During "Extreme Fear": This is your cue to think like an investor, not a panicker. Instead of joining the herd and selling everything, it’s a signal to start looking for high-quality assets that have been unfairly beaten down with the rest of the market.
Does the Index Work for International Markets?
The popular CNN Fear & Greed Index is specifically built for the U.S. stock market, with its inputs heavily tied to the S&P 500. While the principles of fear and greed are universal—they drive markets everywhere—the specific indicators used in the CNN index won't translate directly to markets in Europe or Asia.
To apply this strategy abroad, you'd need to find a similar sentiment index constructed with indicators relevant to that specific market.
Ready to transform market sentiment into your strategic advantage? With Fear Greed Tracker, you get real-time scores for over 50,000 stocks and cryptocurrencies, empowering you to see opportunity where others see panic. Track live sentiment, get instant insights, and set custom alerts to make data-driven decisions. Sign up today at https://feargreedtracker.com.