
Momentum trading is all about buying and selling assets based on the recent strength of their price trends. The core idea couldn't be simpler: things that are going up will probably keep going up, and things that are going down will keep going down. At its heart, it’s a strategy built on one timeless piece of market wisdom: the trend is your friend.
The Core Philosophy: Riding The Wave

Think of a surfer scanning the ocean. They aren't trying to magically predict where a big wave will appear out of nowhere. Instead, they’re watching for a wave that’s already formed, one that’s gathering power and starting to build. Once they spot it, they paddle like crazy to catch that wave and ride it for as long as it has energy.
That’s exactly how a momentum trader operates in the financial markets.
A momentum trader isn’t digging through financial statements to find an asset’s "true" value or hunting for a bargain. Their entire world revolves around price action and the sheer force of a trend. They use technical indicators to pinpoint stocks, cryptos, or anything else that’s already making a big move—up or down.
The whole game is based on the belief that a strong trend, whether it’s fueled by major news or just powerful investor psychology, will keep going for a while. This creates a window of opportunity to jump in, ride the move, and get out before the momentum dies down and the trend reverses.
The Momentum Trader vs. The Value Investor
To really get what momentum trading is, it helps to put it side-by-side with a classic strategy like value investing. Value investors are like detectives, meticulously searching for hidden gems—undervalued companies they believe the market has unfairly overlooked. Momentum traders? They’re more like storm chasers, heading straight for the market's biggest and most powerful currents.
This boils down to two completely different ways of looking at the market:
- Value investors bet that an asset's price will eventually snap back to its “correct” fundamental value.
- Momentum traders bet that once a strong trend is in motion, it’s more likely to continue than to reverse.
The momentum trader's mantra is to “buy high and sell higher.” This flies in the face of the old “buy low, sell high” adage, focusing instead on jumping aboard assets that have already proven they have the market’s wind in their sails.
This one difference changes everything—from what assets they track to how long they’ll hold a position.
To make this crystal clear, let's break down the key differences between these two opposing philosophies.
Momentum Trading vs Value Investing At a Glance
| Attribute | Momentum Trading | Value Investing |
|---|---|---|
| Primary Goal | To profit from continuing price trends | To profit from undervalued assets |
| Time Horizon | Short to medium-term (days to months) | Long-term (years) |
| Key Focus | Price action, volume, and volatility | Company financials and intrinsic worth |
| Mindset | "The trend is your friend." | "Buy a great company at a fair price." |
Seeing them laid out like this really highlights just how fundamentally different the two approaches are. One chases strength, the other hunts for bargains.
And don't mistake this for some newfangled strategy born out of modern, high-speed trading. The data shows that momentum has been a powerful market force for a very, very long time. In fact, research covering over 200 years of data, from 1801 to 2012, found that momentum-based returns have been a consistent feature across stocks, commodities, and currencies since at least the Victorian era.
If you want to dive into the academic proof, you can explore the research on momentum's long-term persistence and see the numbers for yourself.
The Mechanics Of A Momentum Trade
Think of a momentum trade like piloting a jet. You need to understand the entire flight plan—from takeoff to landing—to navigate the market's currents successfully. It's not about gut feelings; each phase relies on clear signals, disciplined rules, and perfect timing to capture gains and, just as importantly, keep them.
The journey begins with the Takeoff, which is usually sparked by a major catalyst. This is the event that shoves a stock into the spotlight, grabbing the market's attention and getting the price moving.
- An earnings report that blows past analyst estimates by 10% or more.
- A big regulatory announcement that completely changes the game for an industry.
- A groundbreaking new product that gets investors buzzing.
These events are like a sudden, powerful updraft. For instance, imagine Company A reports a surprise 25% jump in profits. It's not uncommon to see its stock price rocket 30% in just a few hours.
Catalyst Examples
A quick look at common catalysts shows just how powerful they can be.
| Catalyst Type | Example Impact |
|---|---|
| Surprise Earnings | 30% intraday spike |
| Product Launch | 20% increase in three sessions |
This isn't an exact science, but it gives you a feel for what to look for. Use these as a starting point to spot potential takeoff signals for the assets you're watching.
Once a catalyst hits, you need to confirm the Ascent. A big price jump is one thing, but you need to know if there’s real power behind it. This is where you check your gauges—your volume and trend indicators—to make sure the momentum is genuine.
Trend Confirmation Signals
- Look for a moving average crossover on the daily chart, like the 20-day moving average crossing above the 50-day.
- Check if the Relative Strength Index (RSI) is holding strong above 60 without any major nosedives.
- Make sure the On-Balance Volume (OBV) is climbing right along with the price.
With the trend confirmed, it's time to plan your Entry. There’s no single right way to do this. Some traders wait for a small pullback to a support level, while others jump in as soon as the price breaks through a recent high.
The whole process is a seamless flow, from identifying the trend to getting in and, eventually, getting out.
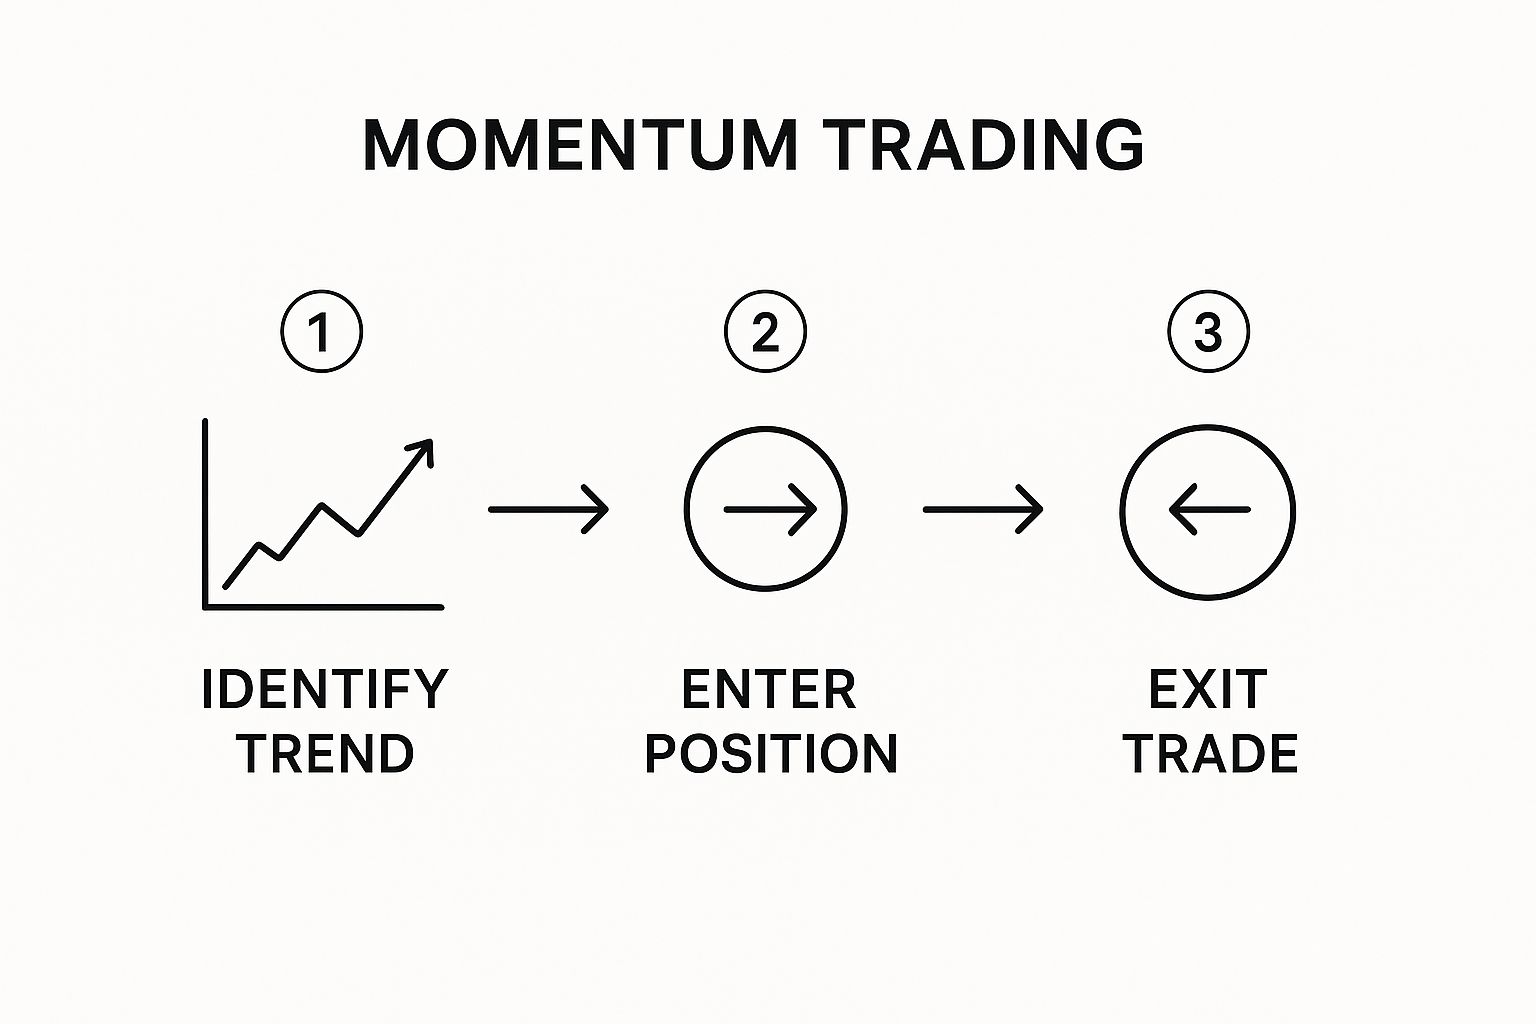
This visual really drives home how each phase connects to the next. Skip a step, and you're either taking on too much risk or leaving money on the table.
Now you’re in the Cruise Phase. Your job here is to hold on as long as the upward momentum continues. This is a great time to use sentiment tools like our Fear & Greed Tracker to get a read on the market's mood. Is the crowd still bullish, or is fear starting to creep in?
Managing Your Position
- Use a trailing stop-loss to protect your profits as the price climbs.
- Consider taking some profits off the table when the price hits a known resistance level.
- Keep an eye on what the broader market and sector are doing.
All good things come to an end, and so does momentum. As the trend starts to lose steam, you need to prepare for the Landing by having your exit rules ready.
Planning the Exit
Your exit strategy will depend on your personal style and risk tolerance. Some people use fixed profit targets, while others rely on technical signals.
- Fixed targets are straightforward and get you out with a predictable profit.
- Trailing stops let you ride the trend as long as possible while still locking in gains.
- Indicator-based exits, like an overbought RSI or bearish divergence, signal that the trend is exhausted.
Key Takeaway: A disciplined exit is every bit as important as a perfect entry. It’s how you lock in your profits before the market sentiment shifts and the trend reverses.
Ultimately, a successful momentum trade is a complete flight plan, not just a series of isolated actions. By combining technical signals with real-time sentiment data, you turn what could be a gamble into a disciplined process.
And that's where tools like the Fear & Greed Tracker come in. They help you spot crowd extremes and confirm that the momentum you're seeing is the real deal.
So use them alongside your charts. Stay adaptive. And watch out for false breakouts—those tempting moves that look like the real thing but quickly reverse, wiping out anyone who didn't have a solid exit plan. Always check your stock's momentum against a broader index like the S&P 500. A strong-looking stock in a weak market can be a trap.
Your Toolkit For Identifying Market Momentum
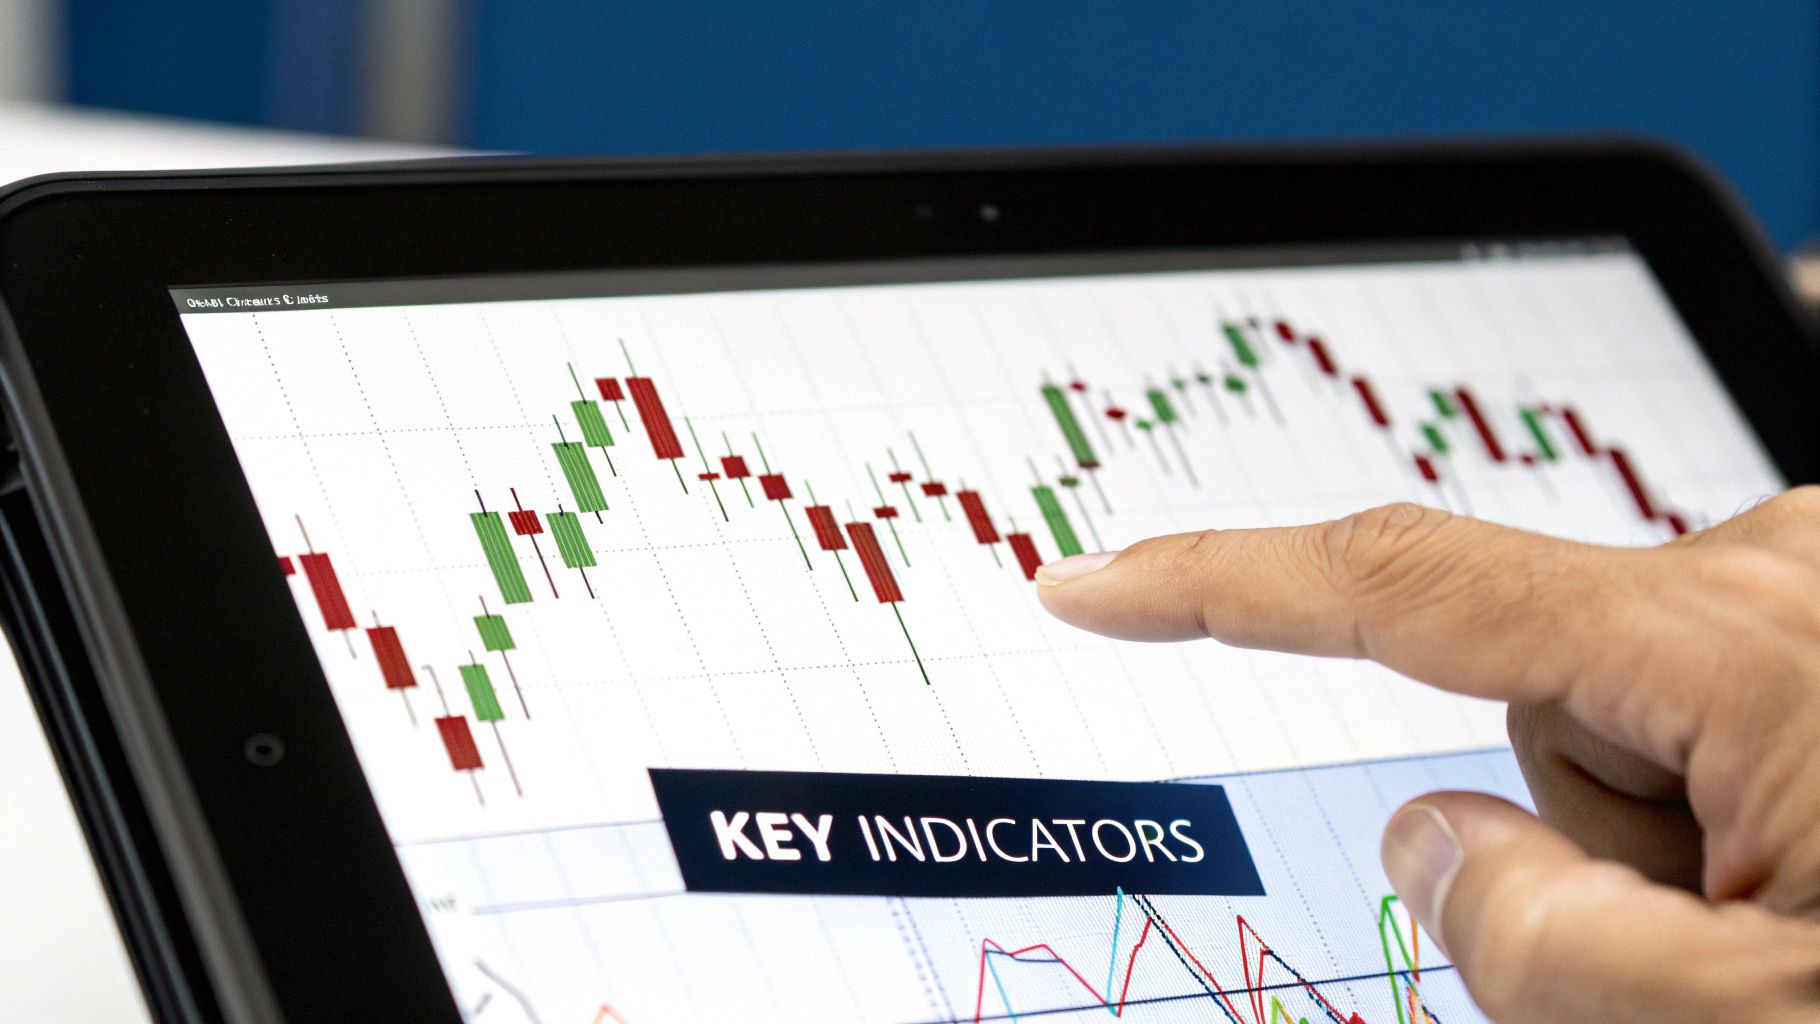
To catch a market wave and ride it successfully, you need the right tools to measure its speed, direction, and strength. A momentum trader's toolkit isn't filled with mystical formulas; it's about a few reliable indicators that give you a clear picture of what the price is actually doing. These tools help you trade on data, not just hunches.
Think of these indicators like the dashboard in a high-performance car. Each gauge gives you a critical piece of information. When you read them together, they tell you when to hit the gas, when to cruise, and when it’s time to pump the brakes.
Let’s pop the hood on the essential gauges you need to master.
Moving Averages: The River's Current
The simplest yet most powerful tool in your kit is the moving average (MA). An MA smooths out the chaotic day-to-day price swings to reveal the underlying trend. It's like looking at a river's main current instead of getting distracted by every little ripple on the surface.
You'll mainly work with two types:
- Simple Moving Average (SMA): This is just the average price over a set period, like 50 days.
- Exponential Moving Average (EMA): This one gives more weight to recent prices, so it reacts faster to new information.
Momentum traders often lean on EMAs because they're more responsive. A classic strategy is to watch for a shorter-term EMA (like the 20-day) to cross above a longer-term one (like the 50-day). This crossover signals that recent positive momentum is building and an uptrend could be starting.
Relative Strength Index: The Pressure Gauge
While moving averages show you the trend's direction, the Relative Strength Index (RSI) tells you about its stamina. Think of the RSI as a pressure gauge for market momentum, measuring how quickly and how much an asset's price has changed. It runs on a simple scale from 0 to 100.
Traditionally, an RSI reading above 70 is seen as "overbought," meaning the asset might be due for a cooldown. A reading below 30 is considered "oversold," suggesting a downtrend is losing steam.
But momentum traders read the RSI a bit differently:
- In a strong uptrend, the RSI can stay above 70 for a long time. The first dip back below 70 is often the real warning sign that momentum is fading.
- In a strong downtrend, the RSI can linger below 30. A move back above this level could be the first hint that bearish momentum is weakening.
The RSI helps you figure out if a trend still has fuel in the tank or if it's just running on fumes.
Volume: Confirming The Conviction
Price action tells a story, but volume tells you how many people actually believe it. Volume is the number of shares or contracts traded, and it's your ultimate confirmation tool. A price move on high volume carries a lot more weight than one on low volume.
A price surge on massive volume shows strong conviction from buyers and validates the upward momentum. A breakout on weak volume, however, is a red flag—it may be a trap with little real buying power behind it.
Imagine a crowd cheering. A breakout on high volume is like a stadium roaring its approval—the excitement is real. A breakout on low volume is like a handful of people clapping politely; the enthusiasm probably won't last.
This isn't just theory; it’s a globally robust phenomenon. Research shows momentum strategies are profitable across different markets and asset classes, not just in the U.S. One pure momentum portfolio, despite a huge drawdown in 2009, has remained a strong long-term performer, proving just how persistent this market force is.
These tools, when used together, create a powerful system for spotting and confirming trades. They help you see not just what the market is doing, but also the conviction behind the move. To deepen your knowledge, you can also explore our guide on what market sentiment is and how to measure it effectively.
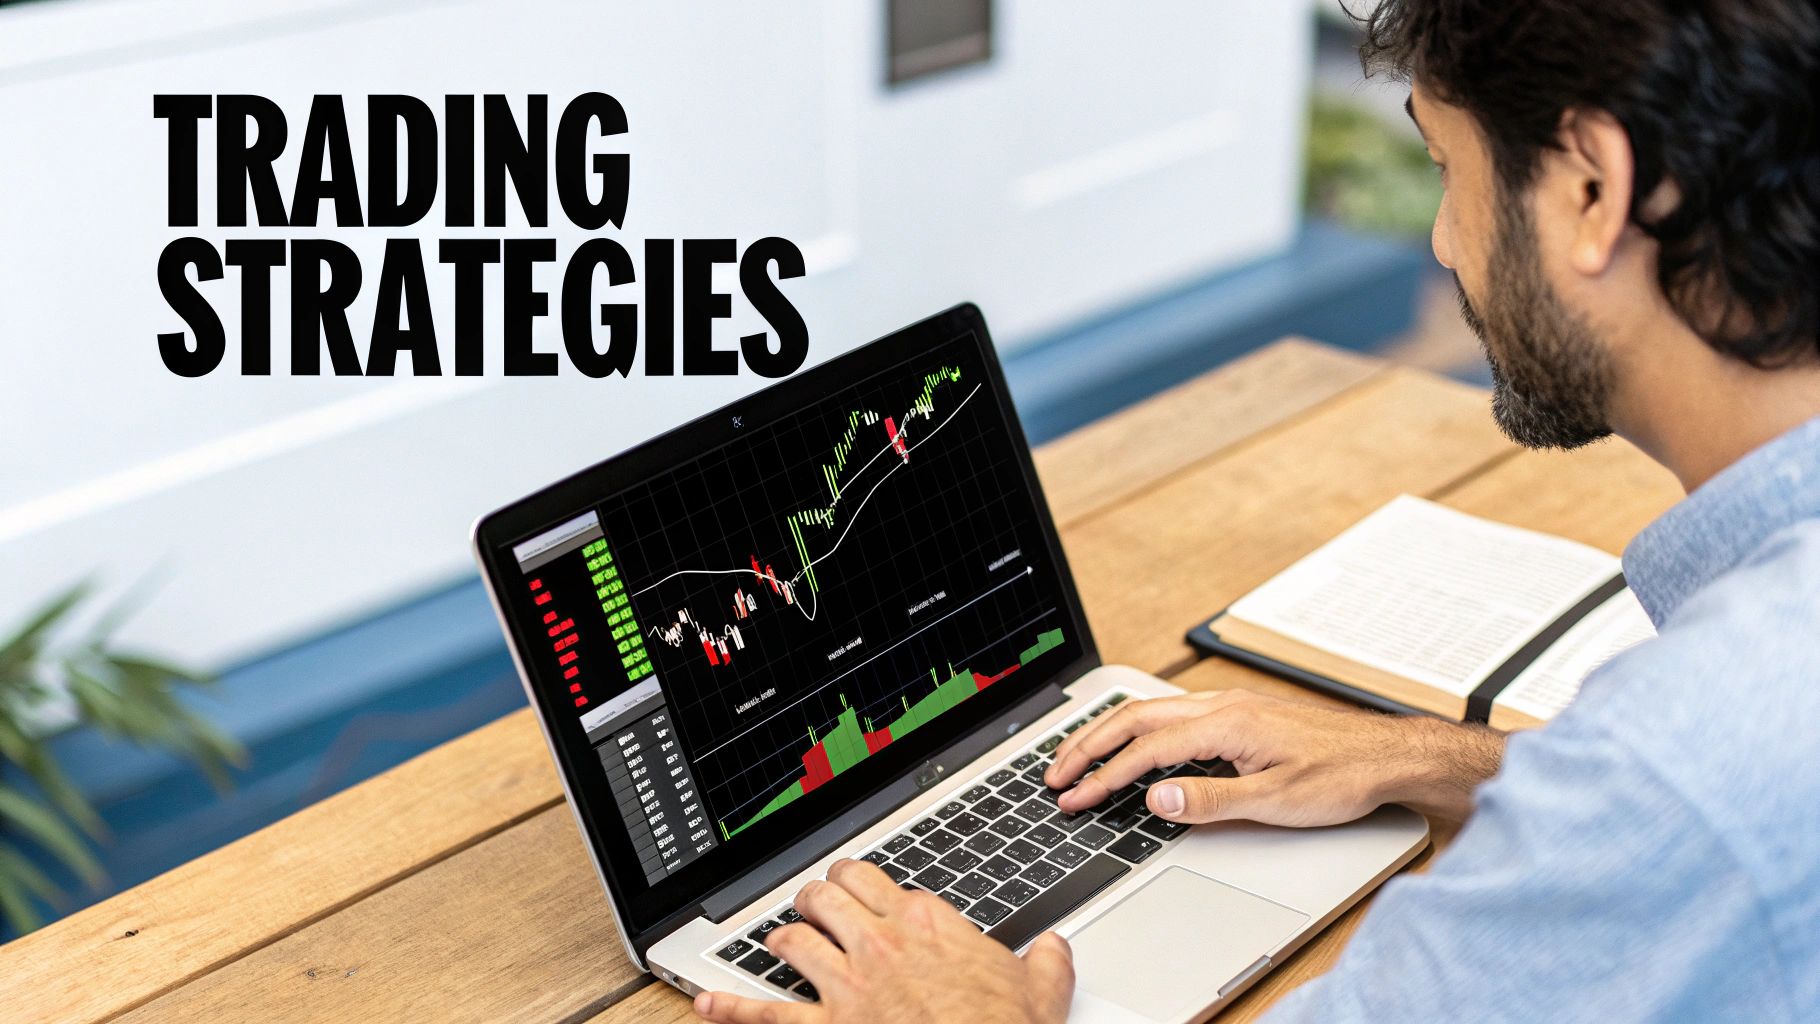
Proven Momentum Trading Strategies In Action
Alright, so you get the theory behind momentum trading. But knowing the tools is one thing; actually using them to make money is another. A solid strategy is your blueprint for every trade. It tells you what to look for, when to pull the trigger, and when to get out. It’s what separates disciplined trading from just gambling on market noise.
Let’s break down two of the most popular and time-tested momentum strategies out there. Think of these less as rigid rules and more as flexible game plans you can adapt to different stocks, cryptos, or whatever you're trading.
The Breakout Trading Strategy
Picture a stock that’s been stuck in a rut for weeks. It keeps hitting a ceiling (resistance) and bouncing off a floor (support), coiling up like a spring. A breakout strategy is all about spotting that pent-up energy and getting in right as it explodes through one of those levels.
A breakout is often the starting pistol for a powerful new trend. When a price punches through a long-standing resistance level, it’s a clear sign that the buyers have finally taken control. The path of least resistance is now higher. The same logic applies, just in reverse, when it crashes below support.
But you can’t just jump on every little price move.
- Confirmation is Key: A real breakout needs fuel, and that fuel is volume. A price that creeps over a resistance line on low volume is often a "false breakout"—a classic trap that sucks in eager traders before reversing hard.
- Patience Pays Off: Don't get trigger-happy the second the price ticks past the line. Many pros wait for the candle to close above resistance (or below support) on a higher timeframe, like a daily or 4-hour chart. This simple step filters out a ton of fake-outs.
A quick example: A tech stock has been trading between $95 and $100 for a solid month. Then, one morning, good news hits the sector, and the stock rips to $101. The crucial part? Trading volume is 300% higher than its daily average. That's a textbook breakout signal telling you a new uptrend is likely underway.
The Trend Following Strategy
While breakout traders hunt for the start of a new move, trend following is about hopping on a trend that’s already in motion and riding it for all it’s worth. This is the classic "the trend is your friend" philosophy. You’re not trying to be a hero and call the exact bottom or top. Instead, the goal is to capture the big, juicy middle part of the move.
This strategy leans heavily on technical indicators to keep you on the right side of the market. Moving averages are the absolute workhorse here.
A super common approach is to use two moving averages—a short-term one (like a 20-day EMA) and a longer-term one (like a 50-day EMA).
- Bullish Signal: When the faster, short-term MA crosses above the slower, long-term MA, it confirms that recent momentum is strong and the uptrend is healthy. Trend followers will often stay in the trade as long as the price remains above these MAs.
- Bearish Signal: And the opposite is true. When the short-term MA dives below the long-term one, it’s a warning that the trend is shifting down. This can be a signal to sell your long position or even consider a short trade.
The name of the game is to stay in the trade until you see undeniable proof that the trend is losing steam, like the price breaking decisively below a key moving average.
Combining Strategies for Better Results
The best traders rarely stick to just one strategy. They’re like skilled mechanics, combining different tools to build a more powerful and reliable trading system. You can easily use a breakout to find your entry point and then shift into a trend-following mode to manage the trade.
A Hybrid Approach in Action:
- Identify: You spot a cryptocurrency that's been consolidating in a tight channel on the daily chart.
- Execute: The price smashes through resistance on a huge spike in volume. That’s your signal. You enter the trade.
- Manage: Now, you switch gears to a trend-following mindset. You might set a trailing stop-loss just below the 20-day EMA, allowing you to ride the wave up while automatically protecting your gains.
- Exit: You hold on tight until the price finally closes below that 20-day EMA. This tells you the short-term momentum has run its course, and it’s time to take your profit.
This blended approach lets you catch the explosive power of a breakout while giving you a clear, unemotional plan for managing the trade. It defines your entry and your exit, taking the guesswork and anxiety out of the equation.
Mastering Risk In High-Speed Markets
Momentum trading is a lot like driving a high-performance race car. The speed is exhilarating, but without a solid set of brakes and a skilled driver, one wrong move can lead to a spectacular crash. In the world of trading, your risk management plan is your braking system, seatbelt, and roll cage all rolled into one.
The biggest danger here is the sudden, sharp trend reversal. A stock that’s been on a tear for weeks can turn on a dime, wiping out all your hard-won gains in just a few hours. That's the built-in risk of buying assets that are already flying high—you're always riding a wave that could be about to crest.
Without a solid plan, you’re just a passenger waiting for the inevitable wipeout. This is why disciplined risk management isn't just a good idea; it's the only thing that separates professional momentum traders from gamblers.
Your First Line Of Defense: Stop-Loss Orders
Your most important safety feature is the stop-loss order. Think of it as an automatic eject button. It’s an order you place with your broker to automatically sell your position if the price drops to a specific level. It takes the emotion out of the equation and gets you out of a losing trade before the damage gets out of hand.
Of course, knowing where to place that stop-loss is a skill in itself. You have to give the trade enough room to move without exposing yourself to a catastrophic loss. For a deep dive, check out our practical guide on how to set stop-losses effectively.
Position Sizing: The Key To Survival
Just as important as when you get out is how much you stand to lose in the first place. This is where position sizing comes in. It’s all about deciding how much of your capital to risk on any single trade. A tried-and-true guideline is the 1% rule: never risk more than 1% of your total trading capital on one idea.
So, if you have a $20,000 account, your maximum risk on any trade is $200. This simple rule is a game-changer. It ensures that a string of five or six losses won't knock you out of the game, giving you the staying power to catch the next big winner. No single trade should ever be a knockout blow.
A trader's goal isn't to be right every time, but to ensure that when they are right, they win big, and when they are wrong, they lose small. Smart position sizing makes this possible.
This brings us to the heart of any professional trading plan: the risk-to-reward ratio. Before you even think about hitting the "buy" button, you need to know your potential profit target and your maximum acceptable loss. A healthy ratio, like 1:3, means you're aiming to make three times what you're willing to risk. It’s a framework that forces you to make disciplined, calculated decisions.
Gauging Sentiment To Avoid The Crash
Finally, one of the biggest risks is getting caught in an overcrowded trade. When everyone is euphoric and piling into the same hot stock, that’s often a flashing red light. It’s a sign the trend is getting dangerously mature and is likely due for a nasty pullback. Learning to read market sentiment helps you spot when a trend is shifting from healthy to hysterical.
While momentum trading can deliver incredible returns, it also comes with significant risks. History shows that even though the strategy has worked for over 140 years, momentum portfolios also hit rough patches. In the modern era, these portfolios have seen bear market declines averaging 13.6% to 14.8% roughly every 15 to 16 months.
By combining iron-clad stop-losses, smart position sizing, and a keen eye on market sentiment, you can transform momentum trading from a high-speed gamble into a calculated strategy built for the long haul.
Putting It All Together: A Real-World Example
Theory is great, but seeing a trade play out in the wild is where the real learning happens. Let's walk through a historical momentum trade from start to finish to see how all these pieces—catalysts, indicators, and strategy—actually come together. We'll use the massive uptrend in NVIDIA (NVDA) stock as our real-world lab.
The Catalyst: The Spark That Lit the Fuse
Every great momentum story starts with a bang. For NVIDIA, it was a blockbuster earnings report that didn't just beat analyst expectations—it completely shattered them. The company followed up with incredibly bullish guidance, all thanks to the skyrocketing demand for its AI chips. This news was pure rocket fuel, and it instantly put NVDA on every trader's radar across the globe.
The market’s reaction was immediate and violent. The first sign of momentum was a massive price gap upward on the daily chart, but the real tell was the trading volume. It exploded to more than 300% of its daily average. This wasn't just a minor blip; it was a clear signal that big money was pouring in with serious conviction. The trend was on.
Confirming the Trend and Picking an Entry
The first explosive move is exciting, but a smart momentum trader waits for confirmation. Is this a one-day wonder or the start of something big? Here’s what they would have looked for:
- The price shot well above its 20-day and 50-day Exponential Moving Averages (EMAs) and, more importantly, stayed there.
- The Relative Strength Index (RSI) blasted into overbought territory (above 70). Crucially, it didn't immediately fall back down. Instead, it hugged that overbought line, signaling that the buying pressure was relentless, not just a temporary spike.
- After the initial gap, the stock began to consolidate in a tight "bull flag" pattern. This is a brief, shallow pullback on much lower volume, which is exactly what you want to see. It shows that the early buyers are holding on tight, not taking quick profits.
The perfect entry point presented itself right as the stock broke out of that bull flag. A trader could have jumped in as the price pushed above the high of the flag, setting a stop-loss just below the flag’s bottom edge. This neatly defines your risk before the trade even gets going.
Riding the Wave and Knowing When to Get Off
Once you're in the trade, the game changes from hunting for an entry to simply riding the trend. The goal is to stay on for as long as the momentum lasts. A simple but effective way to manage this is by using the 20-day EMA as your guide. As long as the stock price remains above that line, you stay in the trade and let your profits run.
But no trend lasts forever. The exit signals started appearing when the trend began to show signs of exhaustion. After weeks of climbing, the stock printed a classic bearish divergence: the price scraped its way to a new high, but the RSI couldn't keep up and made a lower high. This disconnect is a huge red flag that the underlying momentum is starting to sputter.
The final nail in the coffin would have been a decisive daily close below the 20-day EMA. That's the signal that the short-term uptrend is officially broken. By exiting here, a trader would have captured the lion's share of that incredible upward move while protecting their gains from the reversal that was sure to follow. This is a textbook example of how a catalyst, solid confirmation, and a clear exit plan create a winning momentum trade.
Frequently Asked Questions About Momentum Trading
Got questions? You're not alone. When traders first dip their toes into momentum, a few common queries always pop up. Let's clear the air and tackle some of the most frequent ones.
Is Momentum Trading The Same As Day Trading?
Not quite, though it’s easy to see why people get them confused. Many day traders absolutely live and breathe momentum, using it to jump in and out of trades within a single day. But momentum trading isn't defined by the clock.
The core idea is simple: ride a strong, established trend. That trend could last for ten minutes, ten days, or even ten weeks. The holding period doesn't matter as much as the principle behind the trade.
Can Beginners Succeed With Momentum Trading?
Yes, but there's a huge catch: you absolutely must master discipline first. The speed of momentum trading is a double-edged sword. It can generate quick profits, but it can also rack up losses just as fast if you don't have a rock-solid risk management plan.
Before you even think about profits, open a demo account. Practice spotting trends, setting stop-loss orders, and getting a feel for the flow without risking a single dollar. Your number one job as a new trader is to protect your capital.
What Are The Best Markets For Momentum Trading?
Momentum shows up anywhere you find two things: clear trends and enough liquidity to get in and out smoothly. This is why high-volume tech stocks are often a go-to, but the strategy is far from limited to just one asset class.
You'll find momentum opportunities across the board:
- Stocks: Look for names with heavy trading volume, especially those reacting to news or earnings.
- Forex: Currency pairs are famous for locking into powerful, long-lasting trends.
- Commodities: Assets like crude oil and gold can make explosive, trend-driven moves.
- Cryptocurrencies: The inherent volatility here is a momentum trader's playground.
The "best" market is ultimately the one you understand and that’s showing strong, directional movement right now. To sharpen your edge, you can get a better read on trader psychology by using sentiment analysis for stocks to read market mood.
Gain a critical advantage by understanding market psychology. With Fear Greed Tracker, you can access real-time sentiment scores for over 50,000 assets, turning market fear and greed into your next big opportunity. Start making data-driven decisions today at Fear Greed Tracker.