
What if you could measure the stock market's mood?
That's exactly what the Fear & Greed Index does. Originally created by CNNMoney (now CNN Business), this clever tool boils down the market's collective emotion into a single number, on a scale from 0 (Extreme Fear) to 100 (Extreme Greed).
Think of it as a snapshot of investor psychology. It tells you whether the people moving the market are feeling panicked and pessimistic or euphoric and wildly optimistic. It’s a simple way to gauge the overall market sentiment at a glance.
What The Fear and Greed Index Reveals About Market Psychology
Imagine the stock market as a huge crowd. When bad news hits, fear can spread like wildfire, triggering a wave of panicked selling that pushes prices far below what they're actually worth.
On the flip side, when everything looks rosy, greed takes over. This can lead to irrational buying sprees that inflate prices to unsustainable, bubble-like highs. The index is designed to track this emotional pendulum swinging back and forth.
It's not a magic crystal ball that perfectly predicts what the market will do next. Instead, think of it as an emotional barometer, giving you a data-driven look at the current mood. This is where one of Warren Buffett’s most famous quotes comes into play:
"Be fearful when others are greedy, and greedy when others are fearful."
In other words, the index is your guide to applying this wisdom. It helps you spot when the market’s emotions are hitting an extreme, allowing you to stay rational instead of getting swept up in the hype or hysteria.
Fear and Greed Index Levels at a Glance
To make this even clearer, let's break down what each level on the index typically signals about the market's state of mind.
| Index Reading | Sentiment Level | What It Suggests |
|---|---|---|
| 0-25 | Extreme Fear | Investors are in panic mode. This could mean assets are oversold and potentially undervalued, presenting buying opportunities. |
| 26-45 | Fear | Caution is the dominant emotion. Investors are worried, but not in a full-blown panic. |
| 46-54 | Neutral | The market is balanced. Emotions aren't strongly pulling prices in either direction. |
| 55-74 | Greed | Optimism is high. Investors are feeling confident and buying more, which can drive prices up. |
| 75-100 | Extreme Greed | Euphoria has taken over. This often signals that the market is overbought and might be due for a correction. |
By keeping these levels in mind, you can better contextualize the daily score and understand the subtle shifts in market psychology.
Putting the Index to Work
The real power of the index is how it translates complex market data into a simple, digestible score. Here’s what it helps you do:
- Spot Potential Market Tops: High readings of "Extreme Greed" often suggest the market is running too hot and may be due for a pullback. It’s a warning sign to be cautious.
- Identify Potential Buying Opportunities: Low readings of "Extreme Fear" can mean assets are on sale due to widespread panic. This is often when savvy investors start looking for bargains.
- Embrace Contrarian Thinking: The index is a fantastic tool for going against the grain. It prompts you to do your own research when everyone else is selling and to tread carefully when others are buying recklessly.
By tracking the Fear and Greed Index for the stock market, you gain a real edge in managing your own investment psychology. You can see the emotional waves forming and decide whether to ride them, stand safely on the shore, or swim against the current.
The Seven Data Points That Power the Index
The Fear & Greed Index isn't just guesswork; it’s a carefully engineered tool built on seven distinct market signals. Think of each one as a sensor, constantly picking up on a specific aspect of investor psychology.
By blending these seven equally-weighted indicators, the index paints a surprisingly clear picture of the market's collective mood. Let's break down exactly what it’s measuring.
Market Momentum and Strength Indicators
First up, the index looks at the market's raw power and direction. It does this by tracking three key stock price metrics.
Stock Price Momentum: This one is simple. It compares the S&P 500 to its 125-day moving average. When the current price is way above that long-term average, it's a clear sign of greed. If it drops far below, fear is taking over.
Stock Price Strength: Here, the index counts the number of stocks hitting 52-week highs versus those sinking to 52-week lows on the New York Stock Exchange. When highs far outnumber lows, it signals broad confidence and a tilt toward greed.
Stock Price Breadth: This indicator follows the money. It analyzes the trading volume of stocks that are climbing versus those that are falling. If rising stocks are seeing way more volume, it tells you there's heavy buying pressure and a greedy mindset at play.
This is how those individual signals come together to show whether the market is feeling fearful, greedy, or somewhere in between.
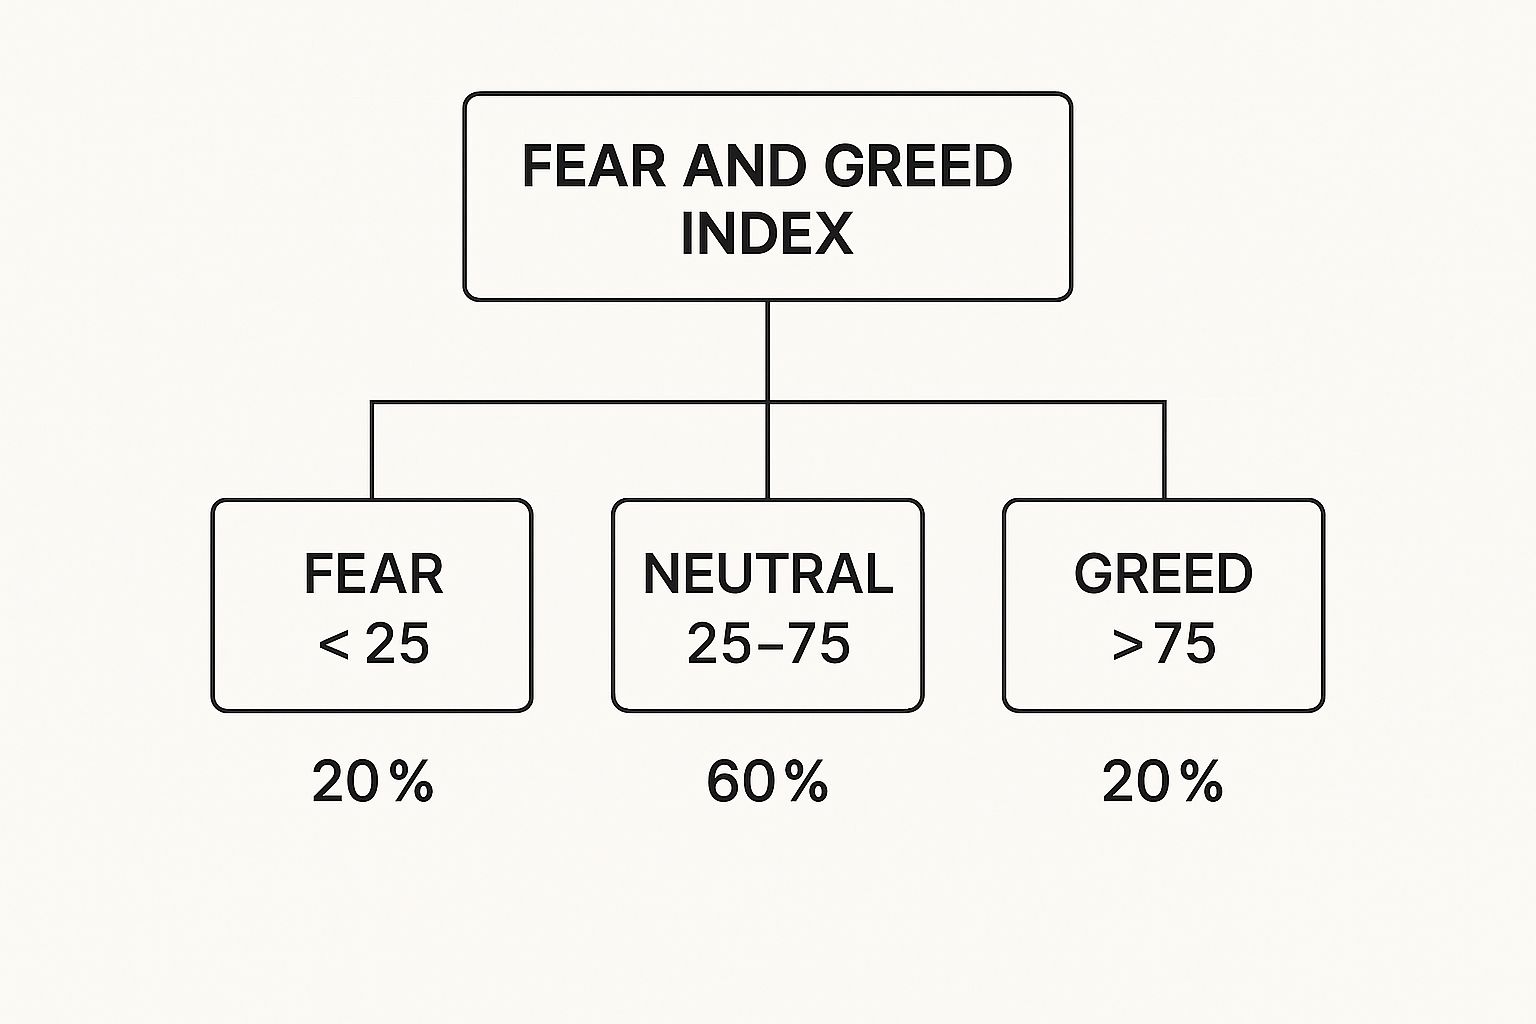
As you can see, while the extremes get all the attention, the market actually spends most of its time in a more balanced state.
Options and Volatility Signals
Next, the index zeroes in on anxiety and risk-taking by looking at the options market and overall volatility.
- Put and Call Options: This is a classic fear gauge. It measures the trading ratio between put options (bets that prices will fall) and call options (bets that prices will rise). When traders are buying up puts, they're hedging their bets, which is a big flashing sign of fear.
A spike in put option volume is like seeing a sudden city-wide rush to buy umbrellas. Even if it's not raining yet, it shows that people are expecting a storm. That’s fear in action.
- Market Volatility (VIX): You've probably heard of the VIX. It's often called the "fear index" for a reason. Managed by the Cboe, it measures expected market swings over the next 30 days. A rising VIX means uncertainty and fear are growing, while a low VIX points to a calm, confident market leaning toward greed.
Risk Appetite Indicators
Finally, the index checks to see how much risk investors are actually willing to stomach. It does this by watching where their money is flowing.
Safe Haven Demand: This indicator pits stocks against Treasury bonds over the last 20 trading days. When investors dump stocks and run to the safety of bonds, causing bonds to outperform, it’s a dead giveaway that fear is in the driver's seat.
Junk Bond Demand: This metric looks at the gap (or "spread") between yields on safe, investment-grade bonds and riskier "junk" bonds. When that gap shrinks, it means investors are so hungry for higher returns they're willing to take on more risk for less reward. That's a textbook definition of greed.
Reading the Index in Real-World Market Cycles
Knowing the seven parts of the Fear & Greed Index is a great start, but the real magic happens when you see it play out during a full-blown market meltdown or a euphoric rally. This isn't just some academic number; it’s a live reading of human emotion, scaled up to the entire market. Looking back at history, you can see how the index has consistently nailed the emotional peaks and valleys of investor sentiment.
This is what makes it such a powerful contrarian tool. When everyone else is either panicking or popping champagne, the index gives you a data-driven reality check, cutting through the noise.
Extreme Fear During Market Bottoms
Periods of Extreme Fear almost always line up with moments of maximum pessimism. And historically? Those have been some of the best buying opportunities for anyone with a long-term view. It's like the entire market goes on a fire sale, driven by pure panic.
- The 2008 Financial Crisis: The global financial system was on the verge of collapse, and you could feel the fear in the air. The index showed it perfectly.
- The COVID-19 Crash: In early 2020, as the world went into lockdown, the markets dove, and the index hit rock-bottom lows.
History shows the index has a knack for flagging these major turning points. During the 2008 crisis, it dropped to around 12, capturing the sheer panic among investors. But that was nothing compared to March 2020, when it hit an all-time low of 2 as the pandemic took hold. You can learn more about how the index tracked these historic market swings on Axiory.com.
In both cases, the index was screaming "Extreme Fear." That was a massive clue that sentiment had probably cratered. For investors who kept their cool, these moments were generational chances to buy quality assets at a massive discount.
Extreme Greed Near Market Tops
On the flip side, Extreme Greed is your warning flare. It tells you the market is getting overheated and that rational thinking might have left the building. When your taxi driver is giving you stock tips and everyone feels like a genius, it’s probably time to be cautious, not greedy.
When the index score climbs above 75, it’s a good sign that euphoria has taken over. This is the time to be reviewing your portfolio, not chasing the hype.
We saw this play out during the dot-com bubble in the late 90s and other moments of wild optimism. Take the 2017 rally, for example, when the big tech stocks (FAANG) seemed unstoppable. The index shot up past 80, signaling that extreme greed was in the driver's seat right before the market hit a wall and corrected.
By studying these real-world examples, you learn to see the index for what it is: a sentiment gauge, not a crystal ball. It helps you ask the right questions. Is this fear overblown? Is this greed getting out of hand? Answering those questions is the first step toward making smarter, more emotionally grounded investment moves.
How to Use the Index in Your Investment Strategy
Knowing what the Fear & Greed Index is doesn't mean much until you actually put it to work. But let’s be clear: integrating this index into your strategy isn’t about blindly following a number. Think of it as a reality check—a gut check against your own biases and the market's often irrational mood swings.
It’s your secret weapon against making classic emotional blunders, like dumping stocks in a panic or jumping on a bandwagon right before it goes off a cliff. The index gives you a data-driven anchor, keeping you grounded when your instincts might be telling you to do the exact wrong thing.
Acting on Extreme Fear
When the index drops into "Extreme Fear," that’s your signal. Widespread panic has likely pushed asset prices far below their real worth. It’s not an automatic "buy" trigger, but it’s a flashing neon sign telling you it's time to start digging for opportunities.
- Hunt for Bargains: Extreme fear can make great companies cheap. Use this period to find solid, well-run businesses that got unfairly punished in the sell-off.
- Do Your Homework: A low index score is just the starting gun. You still need to do your own fundamental or technical analysis to confirm that a company is a genuine deal and not a falling knife.
It's like walking into a store during a massive clearance sale. Not everything is a gem, but it's the perfect time to find top-quality goods for a fraction of the price.
Navigating Extreme Greed
On the flip side, when the index is screaming "Extreme Greed," it means euphoria has taken over. This is when the fear of missing out (FOMO) is at a fever pitch, often inflating prices and creating dangerous bubbles.
An "Extreme Greed" reading is your cue to get defensive, not aggressive. It's a warning that the market's optimism might be out of touch with reality.
This is the moment to get brutally honest about your portfolio.
- Think About Taking Profits: If you've had a great run on a stock, an "Extreme Greed" market might be the ideal time to sell a portion and lock in those gains.
- Tighten Your Stop-Losses: Protect your profits from a sudden market reversal by setting tighter stop-loss orders on your current holdings.
- Press Pause on New Buys: When everyone is piling in, it’s often smart to sit on your hands. Wait for the hype to die down before committing new capital.
To get the most out of the index, it helps to see how different types of investors might react to its signals.
Investor Actions Based on Index Readings
Not every investor will—or should—react the same way. A contrarian's "buy" signal might be a risk-averse investor's "wait and see" moment. Here’s a quick breakdown of how different profiles might use the index.
| Index Level | Contrarian Investor Action | Trend-Following Investor Action | Risk-Averse Investor Action |
|---|---|---|---|
| Extreme Fear (0-25) | Actively seeks buying opportunities in oversold assets. | Waits for confirmation of a trend reversal before buying. | Stays on the sidelines, waiting for stability. |
| Fear (25-45) | Begins to scale into positions, accumulating shares. | Monitors for early signs of an uptrend. | Cautiously considers high-quality assets. |
| Neutral (45-55) | Holds existing positions, observes market for direction. | Follows the established trend, whether up or down. | Prefers to wait for a clearer signal. |
| Greed (55-75) | Becomes cautious, may start trimming overvalued positions. | Continues to ride the upward trend, enjoying momentum. | Reviews portfolio for risk, may trim some holdings. |
| Extreme Greed (75-100) | Actively takes profits, looks for shorting opportunities. | Sets tighter stop-losses to protect gains from a reversal. | Significantly reduces exposure, moves to cash. |
This table shows there's no single "right" way to use the index. The best approach depends entirely on your personal risk tolerance and investment philosophy.
Ultimately, the index is a guide, not a gospel. It adds a crucial layer of psychological insight to your toolkit, helping you stay in control of your emotions instead of letting them control you. For a deeper dive, our guide on using the stock Fear and Greed Index to your advantage offers even more hands-on strategies.
Adapting the Index for the Crypto Market
The crypto market moves to a different beat. It’s a 24/7 global arena where emotions like the Fear of Missing Out (FOMO) and Fear, Uncertainty, and Doubt (FUD) can trigger massive price swings in minutes, not days.
Because of this unique, high-octane environment, the traditional stock market index just won't cut it. The signals it tracks are worlds away from what drives crypto.
This led to the creation of the Crypto Fear and Greed Index, a version specifically calibrated for the wild world of digital assets. While the stock index relies on metrics like junk bond demand, the crypto version tunes into signals that are far more relevant to its own ecosystem. This tailored approach is essential for accurately capturing the mood of a market that never sleeps.
What Powers the Crypto Index
So, what does the crypto index look at? Instead of things like stock price breadth or put and call options, it tunes into the digital chatter and market dynamics unique to cryptocurrencies. Its components are designed to measure the extreme emotional cycles that define crypto trading.
The Crypto Fear and Greed Index combines six key indicators to produce a daily score from 0 to 100, much like its stock market cousin. These signals include volatility, market volume, social media buzz, market dominance, and search trends.
You can find more details on the methodology from Alternative.me, the original source for the data. For now, let’s look at a couple of key inputs:
- Social Media Sentiment: This component analyzes the volume and tone of crypto-related conversations on platforms like X (formerly Twitter). It’s basically gauging whether the public mood is overwhelmingly bullish or bearish.
- Bitcoin Dominance: This measures Bitcoin's market cap relative to the total crypto market. A rising dominance often signals fear, as investors flee smaller, riskier altcoins for the perceived safety of Bitcoin.
How Crypto Traders Use This Tool
For traders, understanding the what is the fear and greed index for crypto is a game-changer. An "Extreme Fear" reading might suggest the market has oversold due to a wave of FUD, potentially highlighting a prime entry point for assets like Bitcoin and Ethereum.
Conversely, a score tilting toward "Extreme Greed" is a major red flag. It often indicates that FOMO has reached an unsustainable peak, and the market could be headed for a sharp correction as early investors start taking profits.
But a word of caution: the crypto market's insane volatility means this index should never be your only tool. It’s a powerful emotional gauge, but it has to be combined with solid technical and fundamental analysis to be truly effective.
You can explore our detailed breakdown of the crypto market's Fear & Greed Index to see exactly how it can fit into your strategy.
Knowing the Index's Limits and Common Pitfalls
The Fear & Greed Index is a fantastic tool for getting a read on market sentiment, but it’s not a crystal ball. Thinking it can perfectly predict the future is one of the fastest ways to make a bad trade. Its real power comes from using it to supplement your own strategy, not as a standalone command to buy or sell.
One of the most common mistakes is treating the index like a precise market timing tool. It just isn't. Markets can stay stuck in "Extreme Greed" or "Extreme Fear" for weeks, sometimes even months—way longer than most people expect. An extreme reading is a signal to start paying close attention, not a guarantee that a reversal is about to happen.
On top of that, the index is a lagging indicator. It's built from data like recent price moves and trading volumes, so it reflects emotions that are already baked into the market. Think of it as describing today's climate, not forecasting tomorrow's weather.
Don't Put All Your Eggs in One Basket
Relying only on the index is a recipe for disaster. For instance, just because the score hits 15 (Extreme Fear) doesn't mean you should mortgage your house and go all-in. There might be a very good reason for that fear—like a major economic crisis—that could easily push prices even lower.
The index is a compass, not a map. It tells you which way sentiment is pointing, but it won't show you the rocks, cliffs, or rivers up ahead. You still have to do your own homework.
Smart investors use the index to gut-check their own biases. When it flashes extreme greed, they stop and ask, "Am I just getting swept up in the hype?" When it signals extreme fear, they ask, "Is this a real opportunity, or am I just trying to catch a falling knife?"
The index is often most useful when it’s confirming trends in its more moderate range. While everyone loves to talk about the extremes, many traders use the readings between 25 and 75 to validate that an existing trend still has legs. You can learn more about how the index is used across its full spectrum over at Axiory.com.
Your Top Questions Answered
Even after you get the hang of the Fear and Greed Index, some questions always seem to pop up. Let's tackle the most common ones head-on so you can use this tool with confidence and sidestep the usual mistakes.
How Often Is the Index Updated?
It really depends on which market you’re watching. Each index is designed to match the pulse of its specific market.
- The stock market's Fear and Greed Index gets a refresh once a day, right after the U.S. markets close.
- The Crypto Fear and Greed Index updates far more often. It has to—crypto never sleeps, and this index keeps up with its 24/7 volatility.
Can the Index Predict a Market Crash?
Absolutely not. Think of the index less like a crystal ball and more like a smoke detector. It can tell you when conditions are getting risky, but it can’t predict if or when a fire will actually break out.
When the needle hits "Extreme Greed," it's a huge red flag that the market might be getting frothy and is due for a cooldown. But it’s not a guarantee. It's simply a signal to be cautious and double-check your positions, not a command to panic-sell everything.
Is a Low Score Always a Buy Signal?
Not necessarily. While an "Extreme Fear" reading often points to times when great assets are on sale, remember that prices can always go lower. A market-wide panic can drag on longer than anyone expects.
A low score isn't an automatic "buy" button. It's a trigger to start doing your homework. It tells you it's time to hunt for bargains, not that every single asset is one.
Which Index Is Right for Me?
This one’s simple: always use the index that matches the market you’re in. The original index was built for U.S. stocks. The crypto version uses a completely different set of data points that make sense for that world.
Using the stock index for crypto would be like using a weather forecast for Miami to plan a ski trip in Colorado. Make sure your tool fits the environment.
Ready to stop guessing and start measuring market sentiment? Fear Greed Tracker provides real-time scores for over 50,000 assets, helping you make smarter, data-driven decisions. Get your edge today at feargreedtracker.com.