
Stock market sentiment analysis is all about tapping into the collective mood of investors to get a read on where the market might be headed. It goes beyond the cold, hard numbers on a chart and tries to decode the very human emotions—like fear and greed—that so often drive stock prices. Think of it as figuring out the why behind a market move, not just the what.
What Is Stock Market Sentiment Analysis?
Ever walk into a stadium and just feel the crowd's energy before you even see the score? That buzz of excitement, the nervous silence, or the groan of disappointment? That's exactly what stock market sentiment analysis does, but for the financial markets. It’s the art of gauging the collective attitude of everyone involved, from a teenager trading on their phone to a massive hedge fund.
Instead of burying itself in company balance sheets (that's fundamental analysis) or getting lost in historical price charts (technical analysis), sentiment analysis hones in on the human factor. It’s built on a simple but powerful idea: investor emotions can, and often do, push stock prices away from their "true" value, especially in the short run.
The Three Pillars of Analysis
To be a well-rounded investor, you need a full toolkit. Sentiment analysis is a crucial tool in that kit, but it doesn't work in isolation. It’s like the third leg of a stool, providing stability alongside the more traditional fundamental and technical approaches. When all three are telling you the same story, your confidence in a decision grows exponentially.
Let's quickly break down how these three pillars support a holistic market view.
| Analysis Type | Core Focus | Data Sources | Key Question Answered |
|---|---|---|---|
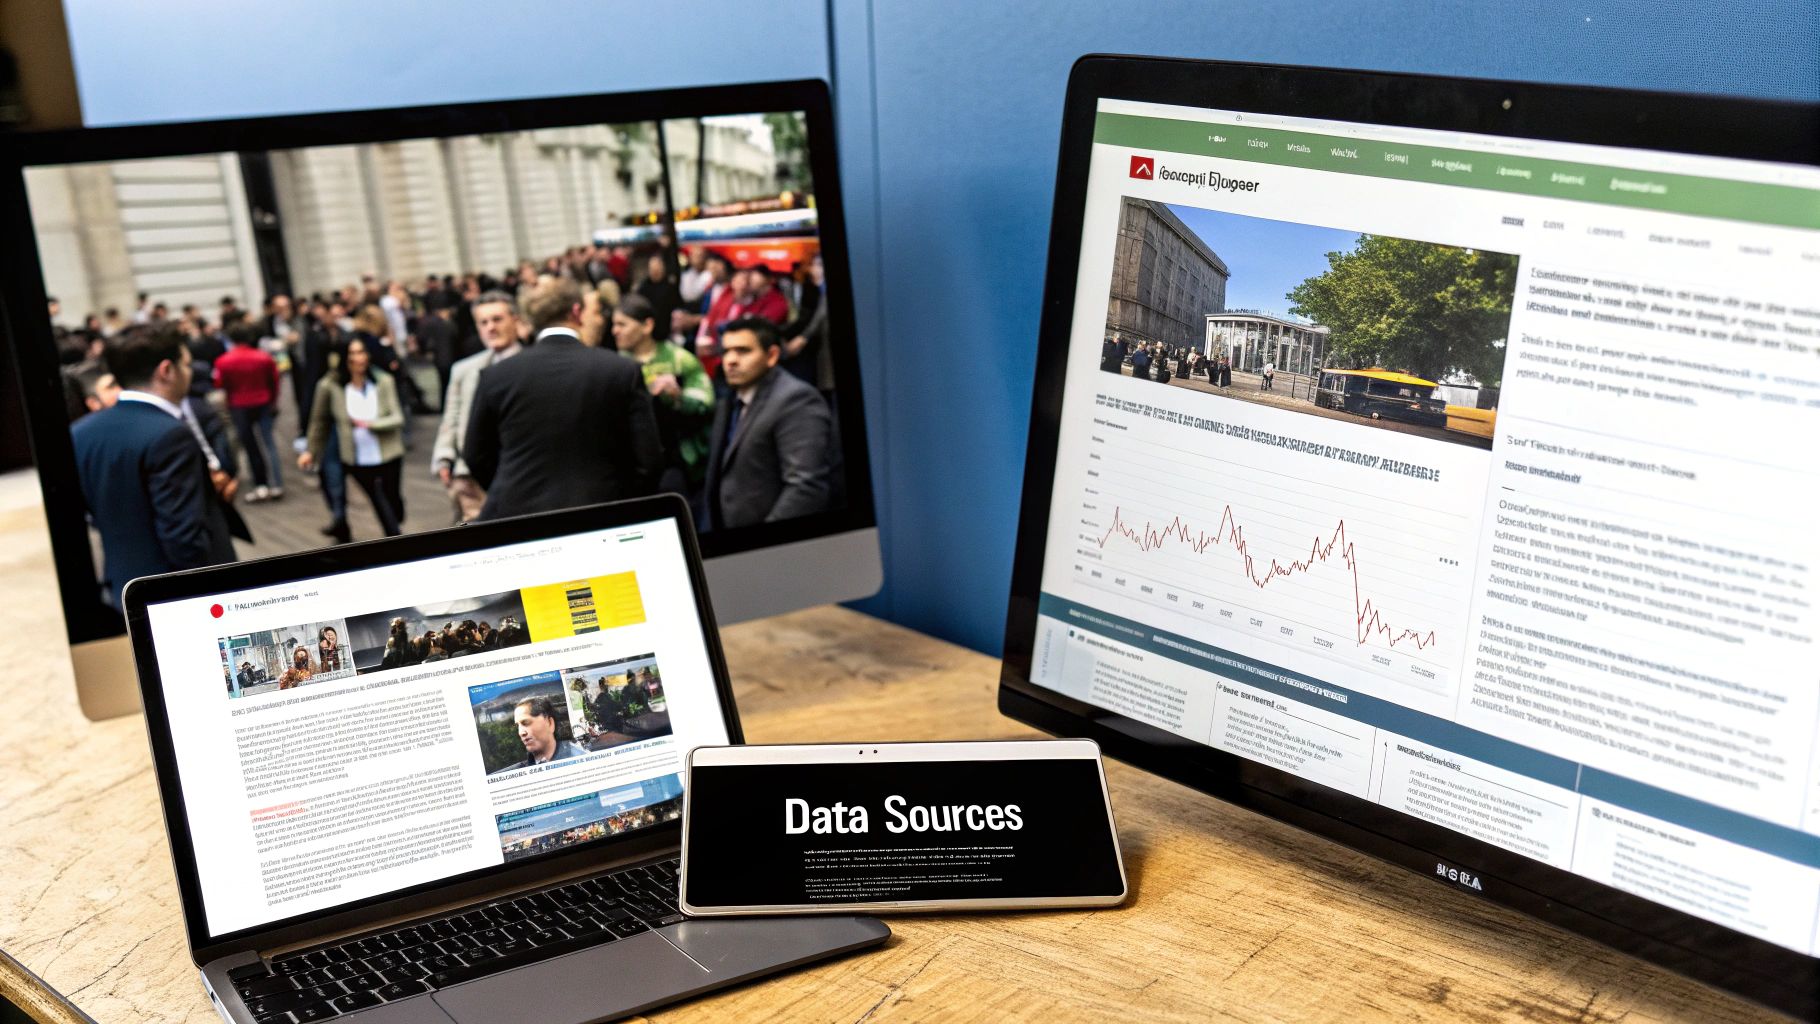
| Sentiment | Market Psychology | Social media, news, investor surveys, options data | What is the overall mood of the market? |
| Fundamental | Business Health | Financial statements, earnings reports, economic data | Is this company financially sound and undervalued? |
| Technical | Price Action | Stock charts, volume, historical price patterns | Where have prices been, and where might they go next? |
Each pillar answers a different, vital question. By combining them, you get a much richer, more complete picture of what's really happening in the market.
This diagram shows how modern sentiment analysis works in practice, turning a sea of online chatter into a clear, measurable score.
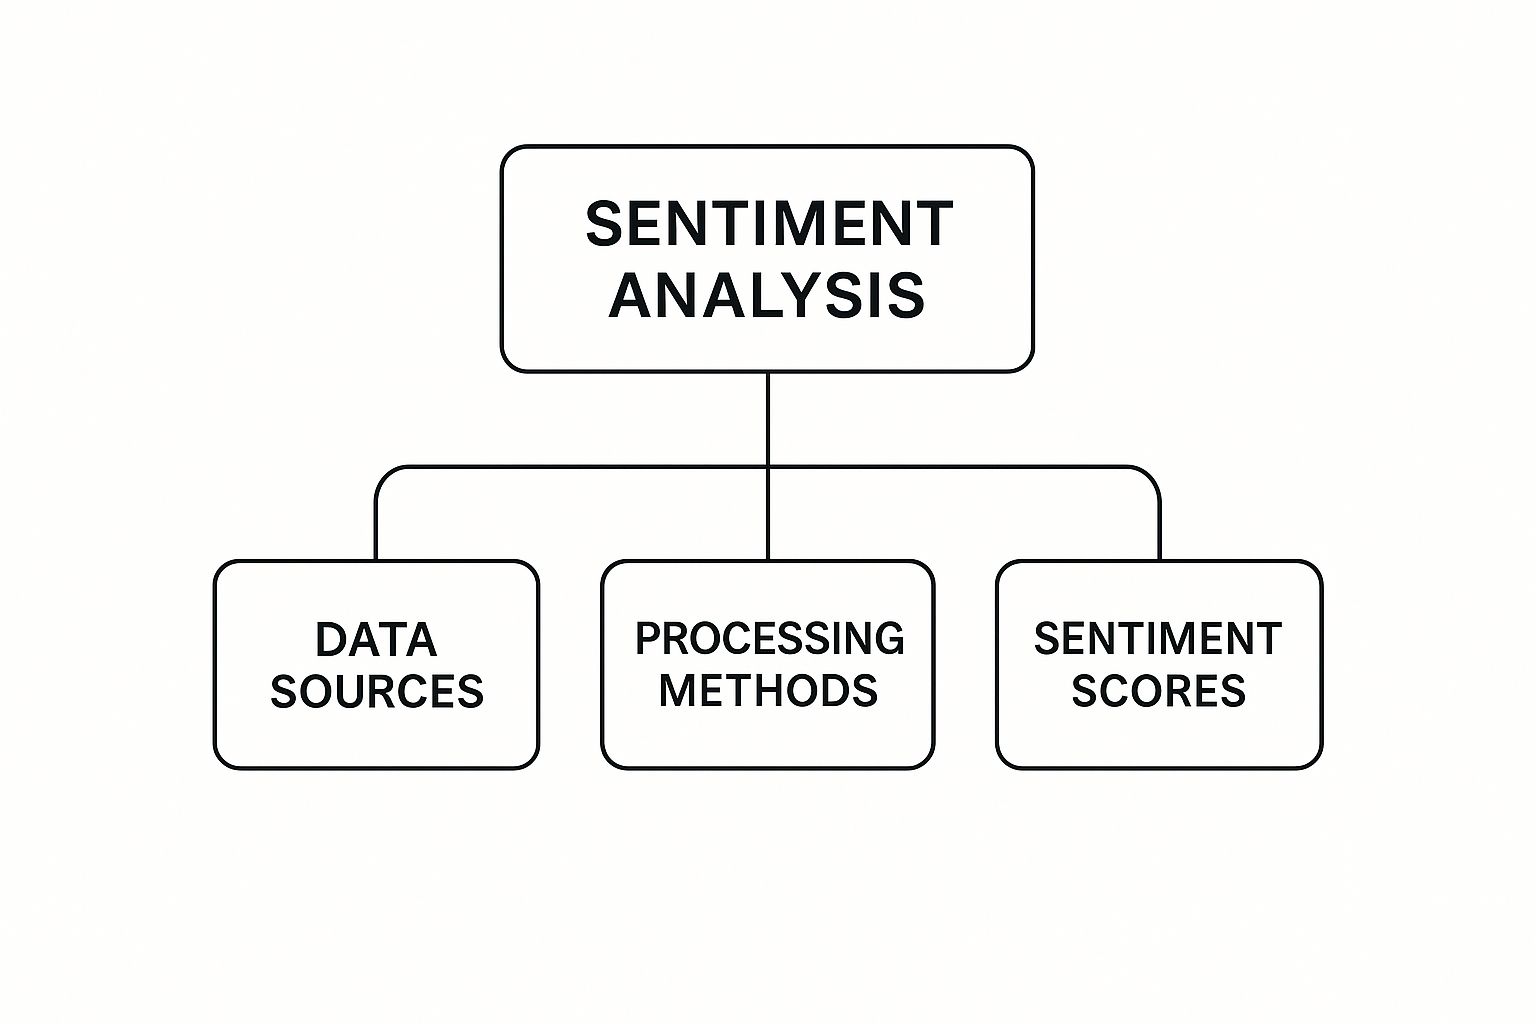
As you can see, it's a process of taking raw, unstructured data from sources like news articles and social media and refining it until you have a concrete metric you can actually use.
Why Sentiment Matters More Than Ever
We live in a world where news—and opinions—travel at the speed of a click. A single viral tweet or a breaking headline can ignite a firestorm of fear or a wave of irrational buying, causing massive market swings in a matter of minutes. This makes having a finger on the market's pulse more essential than ever before.
By quantifying the emotional temperature of the market, you can identify periods of extreme fear, which often present buying opportunities, or extreme greed, which may signal a market top. This approach is central to contrarian investing strategies.
For instance, when sentiment is overwhelmingly negative, it's a good bet that most of the panicky sellers have already bailed out. That leaves more room for prices to climb. On the flip side, when everyone is euphoric and convinced the market can only go up, it might mean there are very few buyers left to keep pushing prices higher.
To see a great example of this in action, you can check out the real-time Fear & Greed Index for the stock market. It rolls several key indicators into one simple score. Ultimately, understanding sentiment gives you a real edge. It lets you see what the "crowd" is doing and gives you a chance to think independently—and maybe even act before they do.
Decoding the Key Indicators of Market Sentiment
Trying to gauge the market’s mood can feel like reading minds. But what if you had a thermometer for its emotions? That's what key indicators do. They aren’t just vague feelings; they provide hard data on what investors are actually doing with their money.
Think of it like an orchestra. One instrument might signal rising fear, while another plays a tune of greed or even complacency. As an investor, your job is to listen to how they all play together. Let’s dive into some of the most trusted indicators traders use to measure the market’s pulse.
The VIX: The Market's "Fear Gauge"
If there's one sentiment indicator everyone knows, it's the CBOE Volatility Index, or VIX. It’s famously called the "fear gauge" because it tracks the market’s expectation of big price swings over the next 30 days. It does this by looking at option prices on the S&P 500.
When the VIX starts climbing, it means investors are paying up for options to protect their portfolios—a classic sign of growing fear. When it’s low, it suggests confidence and a calm environment.
- A high VIX (often above 30) signals intense fear. For contrarian investors, this can be a flashing buy signal, since maximum fear often happens right at a market bottom.
- A low VIX (below 20) points to investor confidence. While that feels good, extremely low levels can breed complacency, which often comes before a market correction.
The VIX doesn't predict which way the market will go. Instead, think of it like a storm warning—it tells you rough seas are ahead so you can check your sails.
The Put/Call Ratio: Gauging Bullish vs. Bearish Bets
The Put/Call Ratio is another powerful tool that comes straight from the options market. It’s simple: it compares the number of bearish bets (put options) to bullish bets (call options). A put gives the owner the right to sell, while a call gives the right to buy.
A high ratio means more people are betting on (or hedging against) a market drop. A low ratio signals that bulls are in control.
Here’s the quick-and-dirty guide to reading it:
- Calculate it: Divide the total number of puts traded by the total number of calls.
- Read the number: A ratio above 1.0 is generally bearish. A ratio well below 0.7 is considered bullish.
- Look for extremes: This is where the magic happens. A ridiculously high ratio can mean pessimism has peaked, setting the stage for a surprise rally. An extremely low ratio might mean everyone is a little too optimistic—a classic warning sign of a market top.
Understanding these ratios is a core skill for any serious trader. For a deeper look, check out a trader's guide to the Fear and Greed Index, which uses similar data points.
Investor Surveys: A Direct Pulse on Sentiment
While options data gives you an indirect read, investor surveys get straight to the point by just asking investors how they feel.
The American Association of Individual Investors (AAII) runs a famous weekly survey that's a classic contrarian tool. It tracks the percentage of individual investors who are bullish, bearish, or neutral for the next six months. For example, a recent survey showed bullish sentiment hit 43.8%, staying above its historical average of 37.5%. This kind of data gives you a direct look into the retail crowd's mindset. You can explore the latest AAII survey results and historical trends to see it for yourself.
How AI and Big Data Are Changing the Game

It wasn’t long ago that market sentiment analysis was more of an art than a science. Veteran traders relied on a "feel" for the market's mood, piecing together clues from the trading floor, news tickers, and their own gut instincts.
Today, that game has completely changed. Technology has turned this intuitive art into a rigorous, data-driven discipline. What’s the catalyst? The mind-boggling amount of digital information we all create every single day.
Every minute, millions of people broadcast their opinions, fears, and hopes about specific stocks or the broader economy. This happens on social media, in news articles, and across countless financial forums. This constant chatter creates a massive, real-time stream of public opinion—a goldmine of raw sentiment that was completely inaccessible just a generation ago.
The real challenge, of course, is tuning into the right signal amidst all that digital noise.
The Rise of AI in Sentiment Analysis
This is where Artificial Intelligence (AI) steps in, particularly a field called Natural Language Processing (NLP). Think of NLP as a super-powered translator. But instead of converting German to Spanish, it translates messy, emotional human language into structured, measurable data.
Imagine trying to personally read every tweet, news headline, and Reddit post about Apple in a single day. It's humanly impossible. But AI algorithms can do it in seconds. Here's how they work:
- They scan millions of data points, pulling text from sources all across the web.
- They understand context and nuance. Early AI struggled with sarcasm or complex financial jargon, but modern NLP is much better at figuring out what people really mean.
- They assign sentiment scores. At the end of the process, the algorithm labels each piece of text with a score—positive, negative, or neutral—for a specific stock or the entire market.
This gives us a dynamic, live pulse of investor psychology. It’s no longer just about gut feelings; it’s about measuring the market’s collective emotional state with mathematical precision.
The Power of Big Data in Prediction
The more data these AI models chew on, the smarter they get. This isn't just a theory; it's a proven fact. Research has shown that plugging social media sentiment into stock prediction models can make them significantly more accurate.
For instance, one study that analyzed Twitter data for 20 U.S. stocks started with a 60% accuracy rate. But when researchers expanded the dataset to include more tweets, the accuracy shot up to 85%. In general, models that include public sentiment often see an accuracy boost of around 20% compared to those that stick to traditional metrics alone. You can learn more about how data volume impacts sentiment forecasting to dig into these findings.
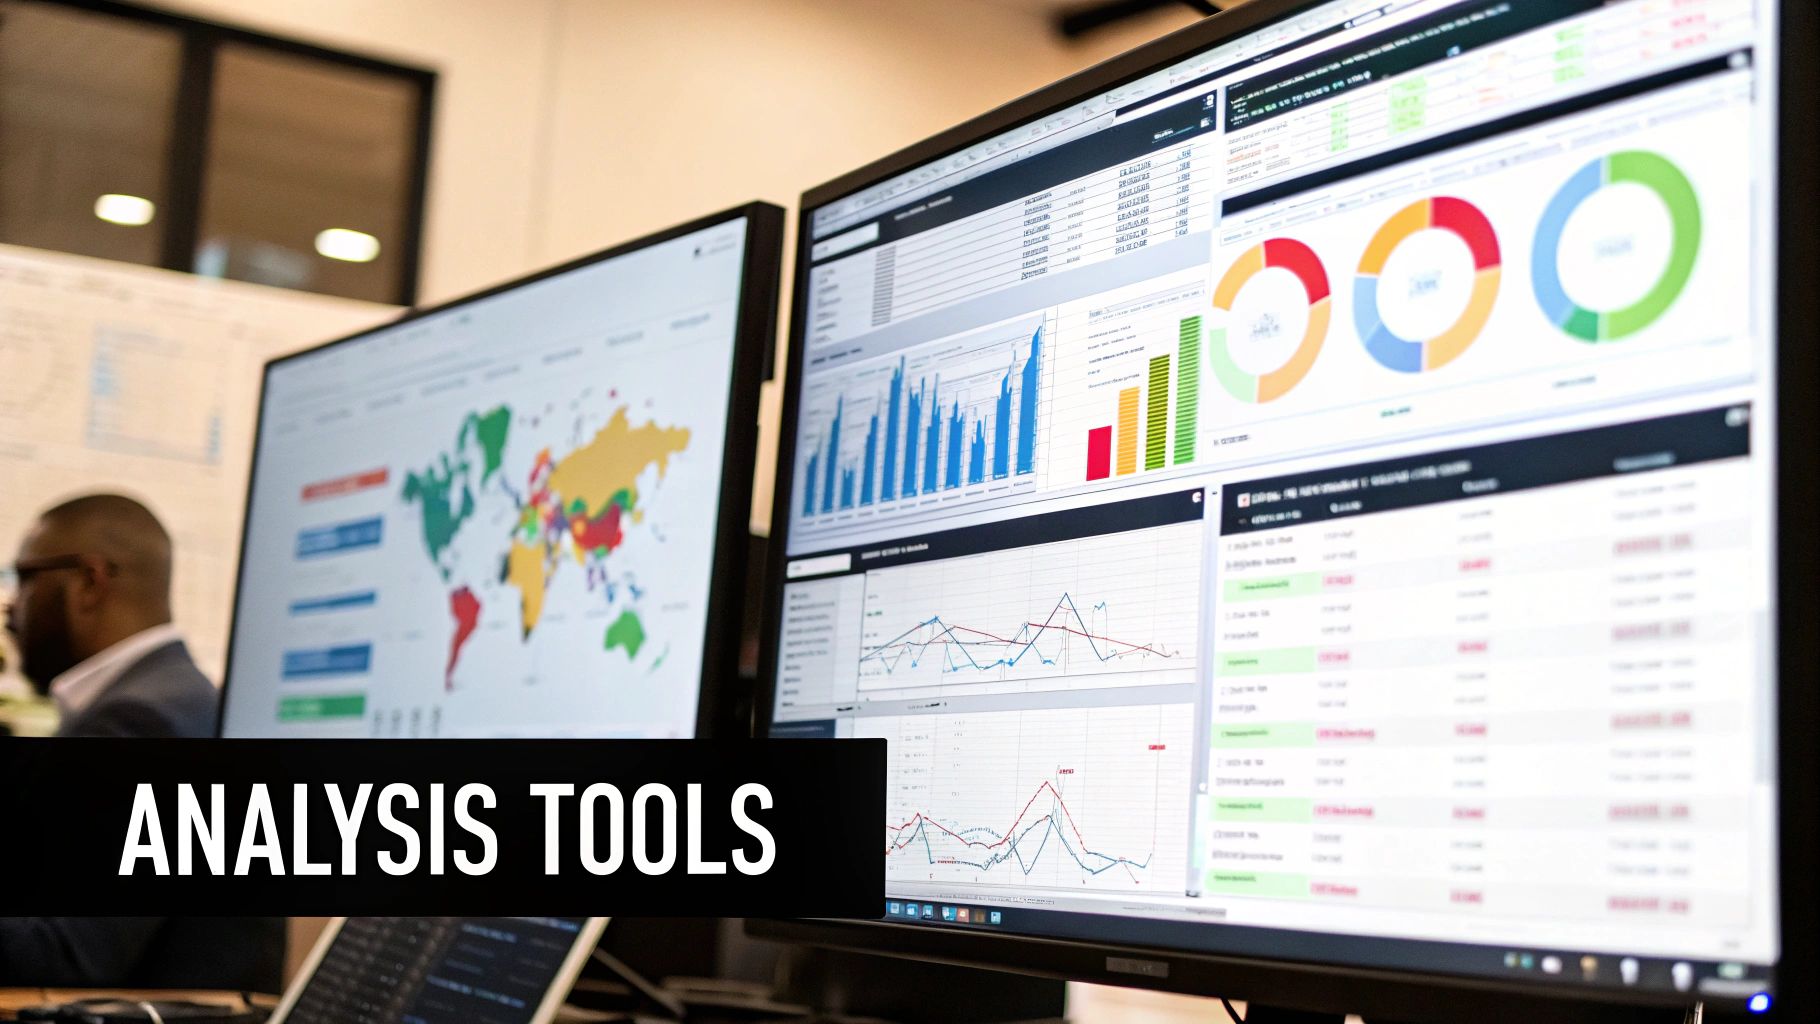
The chart above paints a clear picture of this workflow, showing how unstructured chatter is refined into actionable insights. It all starts with raw data from different sources and ends with a clear prediction about where the market might be heading.
Key Takeaway: The relationship is undeniable—more data creates smarter models and more reliable sentiment signals. Big Data isn't just about size; it's about the depth of insight that volume unlocks.
This data-heavy approach makes stock market sentiment analysis faster, broader, and more objective than ever before. It puts powerful tools, once reserved for massive institutional firms, into the hands of individual traders. By processing the world's financial conversations in real-time, AI and Big Data have made understanding market psychology a crucial part of any modern trading strategy.
A Look Inside Modern Sentiment Models
While AI and Big Data provide the raw power, the real brain behind modern sentiment analysis is a sophisticated machine learning model. This is the engine that turns a chaotic sea of online chatter into a clear, actionable signal.
Think of these models as highly trained detectives. They aren't just guessing; they undergo a rigorous training process where they're fed millions of news articles, social media posts, and forum comments that have already been hand-labeled by humans as positive, negative, or neutral.
By digging through this massive dataset, the model learns to connect specific words, phrases, and even sentence structures with a particular sentiment. For example, it learns that "soaring profits" and "record highs" are bullish, while "plunging value" and "investor panic" are bearish. Over time, it builds an incredibly complex map of financial language, allowing it to "read" the market's mood with remarkable accuracy.
Training a Model to Predict Stock Movements
So what kind of models are doing this work? You might be surprised to learn they aren’t some futuristic black box. They are often grounded in established statistical methods like Logistic Regression and Support Vector Machines (SVM). At their core, these are powerful classification algorithms that excel at one thing: sorting data into different buckets—in this case, bullish or bearish.
And they’re surprisingly effective. Academic research into stock market sentiment analysis regularly puts these models to the test. One study focusing on classifying tweet sentiment for stocks like Tesla (TSLA) found that Logistic Regression models could achieve a sentiment classification accuracy of about 82%. That level of precision shows these methods are both reliable and statistically sound. You can explore the full research about these predictive models to see how they stack up.
At its core, training a sentiment model is about pattern recognition. It’s teaching a machine to spot the digital fingerprints of fear and greed, allowing it to finally quantify what was once purely qualitative.
This process transforms abstract investor feelings into a concrete data point—one that can be back-tested and woven into a cohesive trading strategy.
The Critical Role of the Lookback Window
Once a model can accurately label sentiment, the next challenge is connecting that mood to actual stock price movements. This is where a crucial concept called the “Lookback Window” comes into play.
Simply put, the Lookback Window is the specific timeframe the model examines to find a link between public sentiment and market action. Is the chatter from the last 24 hours what really matters, or does the mood over the past two weeks have more predictive punch? The Lookback Window defines this period.
- A short Lookback Window (e.g., 2-3 days) is great for capturing the impact of immediate, breaking news on short-term price swings.
- A longer Lookback Window (e.g., 10-14 days) helps identify broader, more sustained shifts in market psychology that might signal a new trend is forming.
By testing different windows, data scientists can pinpoint the optimal timeframe for a specific stock or the market as a whole. This statistical discipline is what separates professional sentiment analysis from simple guesswork. It’s a methodical approach that turns raw emotional data into a truly powerful analytical tool.
Putting Sentiment Into Practice
Theory is great, but making money is better. So, how do you actually use all this stock market sentiment analysis to inform your trades? The real trick is realizing that sentiment data isn't a magic bullet—its meaning is entirely in the eye of the beholder, or in this case, the trader.
A contrarian investor, for example, uses sentiment to actively swim against the current. This entire strategy is built on the simple idea that the herd is usually wrong at the extremes. When everyone is popping champagne and screaming "buy," the contrarian sees an over-extended market that's run out of fresh buyers. But when fear and panic have everyone selling their shares for pennies on the dollar, the contrarian smells blood in the water—a potential bargain where the worst of the selling might already be done.
Momentum traders, on the other hand, see it completely differently. For them, rising positive sentiment is like a tailwind, confirming that an uptrend has the strength to keep going. A wave of bullishness isn't a red flag; it's a green light to ride the trend higher.
A Practical Tool: The Fear & Greed Index
Let's get out of the abstract and look at a real-world tool that bundles multiple sentiment indicators into a single, easy-to-read number: the CNN Fear & Greed Index. Think of it as a daily "emotional meter" for the stock market, giving you a quick snapshot of what everyone else is thinking.
This index isn't just a whim. It’s built from seven distinct indicators, each one measuring a different piece of the market's psychological puzzle.
- Stock Price Momentum: Is the S&P 500 outrunning its 125-day moving average? A big lead hints at greed, while lagging behind suggests fear.
- Stock Price Strength: This tracks the number of stocks hitting 52-week highs versus those hitting 52-week lows. More highs point to greed.
- Stock Price Breadth: Analyzes the trading volume in stocks that are going up versus those going down. When advancing stocks dominate the volume, the market is feeling greedy.
- Put and Call Options: This is all about the Put/Call ratio. A low ratio (more bullish calls being bought) signals greed, while a high ratio (more bearish puts) signals fear.
- Market Volatility: Looks at the VIX compared to its 50-day moving average. Lower volatility suggests complacency and greed.
- Safe Haven Demand: Compares the performance of stocks versus Treasury bonds over the last 20 trading days. When stocks are crushing bonds, investors have a high appetite for risk (greed).
- Junk Bond Demand: This measures the spread between yields on safe, investment-grade bonds and risky junk bonds. A tiny spread means investors are willing to take on more risk for a little extra return—a classic sign of greed.
Interpreting the Index for Trading Decisions
Each of these seven pieces gets blended together to produce a final score on a simple dial, from 0 (Extreme Fear) to 100 (Extreme Greed). This one number gives you a powerful, at-a-glance summary of the market's emotional state.
Key Takeaway: The Fear & Greed Index is most powerful when used as a contrarian indicator at its extremes. It's the perfect tool for applying Warren Buffett's famous advice: be "fearful when others are greedy and greedy when others are fearful."
Here’s a simple way to think about the readings:
- Extreme Fear (0-25): This is often a sign of capitulation, where investors have panic-sold. For a contrarian, this is a prime hunting ground for potential bargains.
- Fear (26-49): The market is cautious, but not in a full-blown panic. This could just be a healthy pause or the beginning of a deeper pullback.
- Neutral (50): Things are balanced. The market isn't showing a strong emotional pull in either direction.
- Greed (51-74): Optimism is growing, and investors are feeling confident enough to bid prices higher.
- Extreme Greed (75-100): This is a huge red flag for contrarians. It suggests the market is running on fumes and euphoria, not fundamentals, and might be due for a sharp correction.
By keeping an eye on these shifts, you can add crucial context to your trading decisions. This is how you take sentiment from a fuzzy concept and make it a concrete part of your daily analysis. To see these ideas in action, check out our guide on how to use market sentiment analysis for trading.
Of course. Here is the rewritten section, crafted to sound like it was written by an experienced human expert, following all the provided guidelines.
Common Pitfalls and How to Avoid Them
Sentiment analysis is a powerful tool, but it’s more like a scalpel than a sledgehammer. Wield it without care, and you can end up making some expensive mistakes. The biggest rookie error? Treating sentiment data like a crystal ball that spits out guaranteed stock picks. It can't, and it won't.
Think of it this way: sentiment analysis adds a crucial third dimension to your trading. You still absolutely need to understand a company's financial health (fundamentals) and its price chart (technicals). Ignoring those is like trying to drive with your eyes closed. Sentiment just tells you what the other drivers on the road are feeling.
Mistaking Noise for a Signal
One of the biggest traps in today's market is confusing a short-term flurry of social media chatter with a real, sustainable trend. A sudden burst of excitement or fear online might just be that—noise. Or worse, it could be the work of coordinated bots trying to manipulate the narrative.
Here are a few common tripwires to watch out for:
- Tunnel Vision on One Indicator: No single metric tells the whole story. A high VIX might scream fear, but it could just be nervous energy ahead of a scheduled Fed announcement. The Put/Call Ratio might look bearish, but maybe a few huge institutions are just hedging massive positions.
- Ignoring the "Why": Context is everything. Is sentiment in the gutter because of a disastrous earnings report, or is it just collateral damage from a market-wide sell-off? The story behind the numbers is often more important than the numbers themselves.
- Forgetting the Bots: Automated accounts can amplify a story in a heartbeat, creating a totally false impression of widespread agreement. Always be skeptical of trends that seem to pop up out of thin air, especially on social media.
The real goal of sentiment analysis isn't to find flawless buy or sell signals. It's to help you manage risk by understanding the psychological battlefield you're on. When greed is off the charts, risk is high. When fear takes over, opportunity might be knocking, but that doesn't mean the risk has vanished.
Best Practices for Using Sentiment Data
To sidestep these traps, you need a disciplined game plan. This isn't about chasing perfect predictions. It's about adding a smart layer of insight to the way you already invest.
Here’s a simple checklist to keep you grounded:
- Always Cross-Reference: Put your sentiment readings side-by-side with other data. If a stock shows extreme fear but its fundamentals are crumbling, that’s a falling knife, not a bargain. The best opportunities pop up when sentiment and fundamentals tell you two different stories.
- Know Your Source: Not all sentiment is created equal. A thoughtful analysis from a verified financial news outlet carries a lot more weight than anonymous shouting on a Reddit forum.
- Use It for Risk Management: Treat extreme sentiment as a trigger to review your game plan. Is everyone euphoric? Maybe it's time to tighten your stop-losses or skim some profits. Is the market terrified? That could be your cue to start building a shopping list, not to join the panic-selling.
By sticking to these guidelines, you can start using sentiment to decode the human story behind the ticker tape. And in a market driven by people, that’s a genuine edge.
Of course. Here is the rewritten section, designed to sound like it was written by an experienced human expert, following all the specified style and formatting requirements.
Answering Your Top Questions
Even once you get the hang of sentiment analysis, some common questions always seem to pop up. Let's run through a few of the big ones to clear things up and help you put these ideas into practice.
Can Sentiment Analysis Really Predict Stock Prices?
Not in the way a crystal ball would, and it’s critical to get this straight. Sentiment analysis won’t tell you a stock is going to hit $50.32 tomorrow morning. Think of it more like a weather forecast for the market—it’s brilliant at telling you the probability and direction of what’s coming next.
For instance, when you see extreme fear across the board, it’s not a guarantee of a specific price bottom. What it does tell you, with a high degree of confidence, is that the sellers are probably exhausted. This massively increases the odds of a trend reversal or at least a temporary bounce. It helps you anticipate the market's next move, not predict the exact address.
What Are the Best Free Tools for This?
You don’t need to drop a ton of money on fancy subscriptions to start tracking market sentiment. There are some fantastic free tools out there that give you a surprisingly powerful read on the market’s mood.
Here are a few I always recommend:
- CNN Fear & Greed Index: This is the perfect starting point. It rolls seven different indicators into one simple dial, giving you a quick, daily snapshot of how the broad market is feeling.
- AAII Investor Sentiment Survey: Released every week, this survey just asks individual investors a simple question: are you bullish, bearish, or neutral? It’s a classic tool for spotting when the retail crowd is getting a little too one-sided.
- Social Media: It might sound chaotic, but searching stock tickers (like $TSLA or $AAPL) on X (formerly Twitter) or checking out forums like Reddit’s r/wallstreetbets gives you a raw, real-time pulse of investor chatter.
These will give you more than enough to start weaving sentiment into your daily analysis.
What’s the Difference Between News and Social Media Sentiment?
They're both useful, but they tell you very different things. Think of news sentiment as the "official" story. It’s pulled from structured sources like financial news sites and company press releases. The tone is more formal, the analysis is deeper, and it tends to reflect the institutional or long-term view. It's less "noisy" but often a step behind the action.
Social media sentiment, on the other hand, is the Wild West. It's messy, emotional, and moves at the speed of thought. You're capturing the immediate, gut reactions from millions of individual investors. While it’s definitely prone to hype and manipulation, there’s no better way to see what the “herd” is thinking in real-time.
A smart trader uses both. News gives you the fundamental story and context, while social media gives you the instant emotional temperature.
Is Extreme Greed Always a Sell Signal?
Not at all. How you interpret extreme greed comes down to one thing: your trading style.
If you’re a contrarian investor, then yes, extreme greed is almost always a warning sign. It’s your cue to get cautious, maybe trim some winning positions, or even look for shorts. The contrarian view is that if everyone is bullish, who is left to buy and push prices higher?
But if you’re a momentum trader, widespread greed can be exactly what you want to see. It’s confirmation that a strong uptrend has a lot of support and could keep running. For them, a wave of greed isn't a red flag; it's fuel for the fire. The key is knowing which camp you're in and acting accordingly.
Ready to stop guessing the market's mood and start measuring it? Fear Greed Tracker provides real-time sentiment scores for over 50,000 stocks and cryptos, turning confusing market emotions into a clear, actionable edge.