
The Fear and Greed Index for the stock market is a fascinating tool that tries to measure something that's usually invisible: investor emotions. It essentially acts as a mood ring for the entire market, boiling down the collective feeling of all traders into a simple score from 0 (Extreme Fear) to 100 (Extreme Greed).
This score tells you, at a glance, whether fear or greed is the main driver in the market right now.
What Is the Market's Emotional Pulse?
Think of the Fear & Greed Index as a way to check the market's emotional pulse. It doesn't care about company earnings reports or price-to-earnings ratios. Instead, it’s all about the psychological state of investors. Are they hitting the panic button and selling everything they own? Or are they euphoric, buying up stocks like there’s no tomorrow?
The index takes all that complex, messy human behavior and distills it into one straightforward number. It’s built on the simple but powerful idea that two emotions—fear and greed—are what truly move markets, often pushing stock prices far from their logical value.
Understanding the Emotional Swings
It’s easy to get swept up in the daily market noise. The index helps you step back and see the bigger emotional picture by quantifying these swings.
Here’s a quick breakdown of the emotional scale:
Extreme Fear (a score of 0-25): This is when you can practically smell the panic in the air. Investors are pessimistic and selling off assets, sometimes irrationally. For a savvy investor, this can signal that the market is oversold, creating potential bargains for those brave enough to buy when everyone else is scared.
Extreme Greed (a score of 75-100): This is the party phase. Investors are getting a little too optimistic, and that euphoria can inflate market bubbles. When greed is running this high, it’s a sign to be cautious. The market could be overbought and due for a reality check.
To help you visualize how these emotions play out, here’s a quick comparison of investor behavior at both ends of the spectrum.
Investor Mindset At a Glance
This table breaks down the typical investor behaviors and market signals associated with the two emotional poles measured by the index.
| Characteristic | Extreme Fear (Index 0-25) | Extreme Greed (Index 75-100) |
|---|---|---|
| Market Outlook | Overwhelmingly pessimistic; "the sky is falling." | Wildly optimistic; "this time it's different." |
| Investor Action | Panic selling, liquidating assets, moving to cash. | FOMO buying, chasing hype, taking on more risk. |
| Price Behavior | Prices drop sharply, often below intrinsic value. | Prices climb rapidly, creating potential bubbles. |
| Media Tone | Headlines are negative, focusing on doom and gloom. | Headlines are euphoric, celebrating new market highs. |
| Key Signal | The market may be oversold and undervalued. | The market may be overbought and due for a correction. |
By tracking these shifts, you get a unique edge. The index isn't a crystal ball—it won’t predict the future. But it does give you an invaluable snapshot of the current emotional climate. For a deeper dive into using this in your trading, our guide on the fear and greed index stock market offers more practical tips.
The whole concept boils down to contrarian investing. It’s the embodiment of Warren Buffett’s famous advice: be "fearful when others are greedy and greedy when others are fearful."
Ultimately, the goal is to look past the numbers on the screen and understand the human behavior driving them. When you can spot when the collective mood has swung too far one way, you can start seeing opportunities that others, blinded by their own panic or euphoria, are completely missing.
Deconstructing the Seven Index Components
The Fear & Greed Index isn't just some random number pulled out of thin air. It’s a carefully crafted score built from seven distinct market indicators. Each one acts like a different sensor, picking up on a specific emotional signal from investors.
Think of it like a doctor checking multiple vital signs—pulse, blood pressure, temperature—to get a complete picture of a patient's health. The index does the same for the fear and greed index stock market, combining these seven "vitals" into a single, easy-to-read diagnosis of where sentiment stands.
Each of these seven components gets an equal say in the final score. Once you understand what each one is actually measuring, you can move beyond just glancing at the final number and start to see the real story it tells about market psychology.
This diagram shows how different data points, like market momentum and volatility, all feed into the final index score.
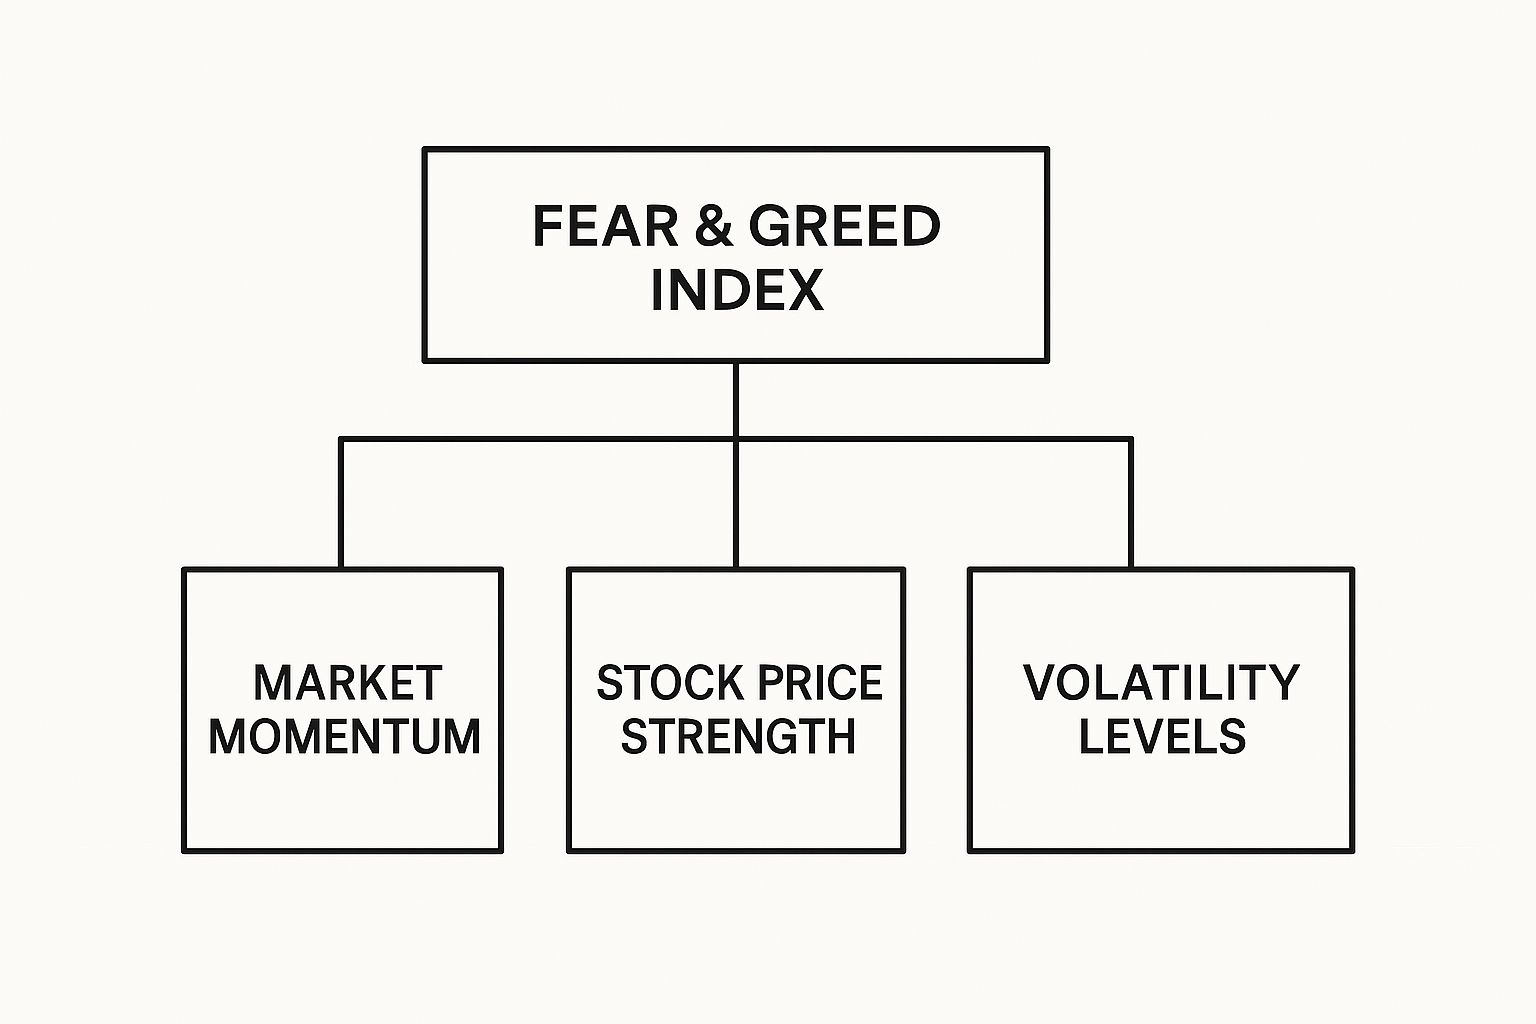
It’s a great visual for understanding that the index isn't based on a single feeling but is a composite view of the market's underlying strength and behavior.
1. Market Momentum
This indicator pits the S&P 500 against its 125-day moving average. You can think of this as the market's speedometer. When the current price is way above its recent average, it's like a car accelerating hard—a potential sign of Greed. When it drops far below, the market is hitting the brakes, signaling Fear.
2. Stock Price Strength
This one is all about confidence. It counts the number of stocks on the New York Stock Exchange (NYSE) hitting 52-week highs versus those hitting 52-week lows. A flood of new highs suggests widespread optimism (Greed), while a surge in new lows points to deep-seated pessimism (Fear).
3. Stock Price Breadth
Measured by the trading volume of advancing stocks versus declining stocks on the NYSE, this is the market's internal headcount. Are more stocks joining the party or heading for the door? Strong, rising volume in advancing stocks shows broad participation and Greed. On the flip side, heavy volume in declining stocks suggests investors are rushing for the exits in Fear.
In essence, market breadth tells you if a rally is a full-blown parade with everyone marching along or just a few star players carrying the team. Widespread participation signals stronger, greed-fueled conviction.
4. Put and Call Options
This indicator gets right to the heart of speculative bets by looking at the ratio of traded put options (bets that prices will fall) to call options (bets that prices will rise). A high ratio of puts to calls means traders are paying a premium for downside protection—a clear sign of Fear. A low ratio signals bullishness and Greed.
5. Market Volatility
Here, we turn to the CBOE Volatility Index (VIX), often called the market's "fear gauge." The VIX measures expected volatility over the next 30 days. A low VIX reading suggests a calm, complacent market (Greed). But when the VIX spikes, it means uncertainty and anxiety are soaring, signaling a sharp rise in market Fear.
6. Safe Haven Demand
This is the ultimate "fight or flight" indicator. It compares the performance of stocks versus Treasury bonds over the last 20 trading days. When investors get scared, they flee the perceived risk of stocks and flock to the safety of government bonds. When they're feeling greedy, they dump bonds to chase bigger returns in the stock market.
7. Junk Bond Demand
Finally, this component measures the spread between yields on investment-grade bonds and junk bonds. Think of it as the market’s appetite for risk. A tiny spread means investors are so confident (Greed) they’re willing to accept very little extra reward for holding risky junk bonds. A widening spread shows investors are demanding more compensation for taking on risk—a classic symptom of Fear taking hold.
How the Index Performed in Market History
Any trading tool is only as good as its performance during total chaos. It’s easy to talk about the fear and greed index stock market in theory, but its real power comes alive when you look back at how it behaved during major market meltdowns. That's where you see its true value as a contrarian indicator.
These are the moments of pure panic or wild euphoria when most investors lose their cool and make their worst decisions. The index, however, often points in the complete opposite direction, flagging incredible opportunities for anyone who’s paying attention.
A Signal Amidst the 2008 Financial Crisis
Remember the 2008 global financial crisis? The entire financial system was on the verge of collapse. As huge institutions went under and stocks went into a freefall, you could practically feel the panic in the air. While the official CNN index wasn’t around back then, looking at the data retroactively shows exactly what you’d expect.
As the markets imploded, the index would have crashed into the single digits, reflecting a brand of terror not seen in generations. This "Extreme Fear" reading was a screaming signal that people were dumping assets indiscriminately. For a contrarian, it was a blinking sign that quality companies were on a historic fire sale.
The COVID-19 Crash of 2020
Fast forward to the sudden, brutal market crash in March 2020. As the pandemic sent the world into lockdown, the stock market nosedived, giving the index a live, real-world test. It performed just as designed.
On March 12, 2020, as the S&P 500 had one of its worst days ever, the index hit rock bottom with a reading of just 2. That’s a level of "Extreme Fear" you rarely see—a sign of complete and total investor capitulation.
That abysmal reading wasn't a signal to run for the hills. It was a signal to consider buying. Anyone who stepped in during that period of extreme fear was rewarded handsomely as the market staged a ferocious rally over the next year.
Looking back, the index consistently flags these pivotal moments. During the 2008 crisis, readings sank below 10, and the COVID-19 crash saw it dip to 8—both clear signs of acute investor panic. On the flip side, major bull runs are often marked by spikes above 80. If you want to dig deeper into these historical patterns, Axiory.com offers a great breakdown of how the index reacts to global events.
When you study these historical moments, the index’s job becomes crystal clear. It’s not a crystal ball, but it gives you an invaluable snapshot of the market’s emotional state, often pointing you toward opportunity when every headline is screaming disaster.
Turning Index Readings into Actionable Insights
Knowing the market's emotional score is interesting, but turning that number into a concrete plan is what truly matters. This is where theory meets the real world, translating what the fear and greed index stock market is telling you into a framework for your next move.
The core idea is simple, and it comes straight from Warren Buffett: be "greedy when others are fearful."
It's a contrarian approach at its heart. You’re essentially using widespread panic or euphoria as a giant, flashing sign to do the opposite of what the crowd is doing. It’s not about perfectly timing the market’s bottom or top—that's a fool's errand. Instead, it's about spotting those moments when intense emotion is probably causing stocks to be completely mispriced. This flips market sentiment from distracting noise into a genuine strategic edge.
When Fear Creates Opportunity
When the index plunges into the "Extreme Fear" zone—typically a score between 0 and 25—it's a clear sign of widespread pessimism and panic selling. People are dumping stocks, often without even looking at the underlying value of the companies they’re selling. For a disciplined investor, this isn’t a red alert to join the stampede. It's a green light to start hunting for bargains.
Think of it like a luxury store holding a chaotic, unplanned clearance sale. Because everyone is rushing for the exits, you can suddenly find high-quality items (strong companies with solid financials) at a massive discount. Your job isn't to buy everything in sight, but to use the fear as a trigger to research great companies that have been unfairly beaten down by the market's sour mood.
A low index reading signals that the risk of overpaying for an asset is significantly lower. While prices could always dip further, Extreme Fear often comes right before major market bottoms, presenting what can be once-in-a-generation buying opportunities.
And it happens more often than you'd think. Looking at historical data for the popular CNN Fear & Greed Index from 2011 to mid-2025, days with a score below 10 (deep fear) made up 15% of all trading days. In contrast, days of extreme greed (above 90) accounted for only 10%. You can dig into these historical trends yourself over at Finhacker.cz to see just how consistently fear has paved the way for opportunity.
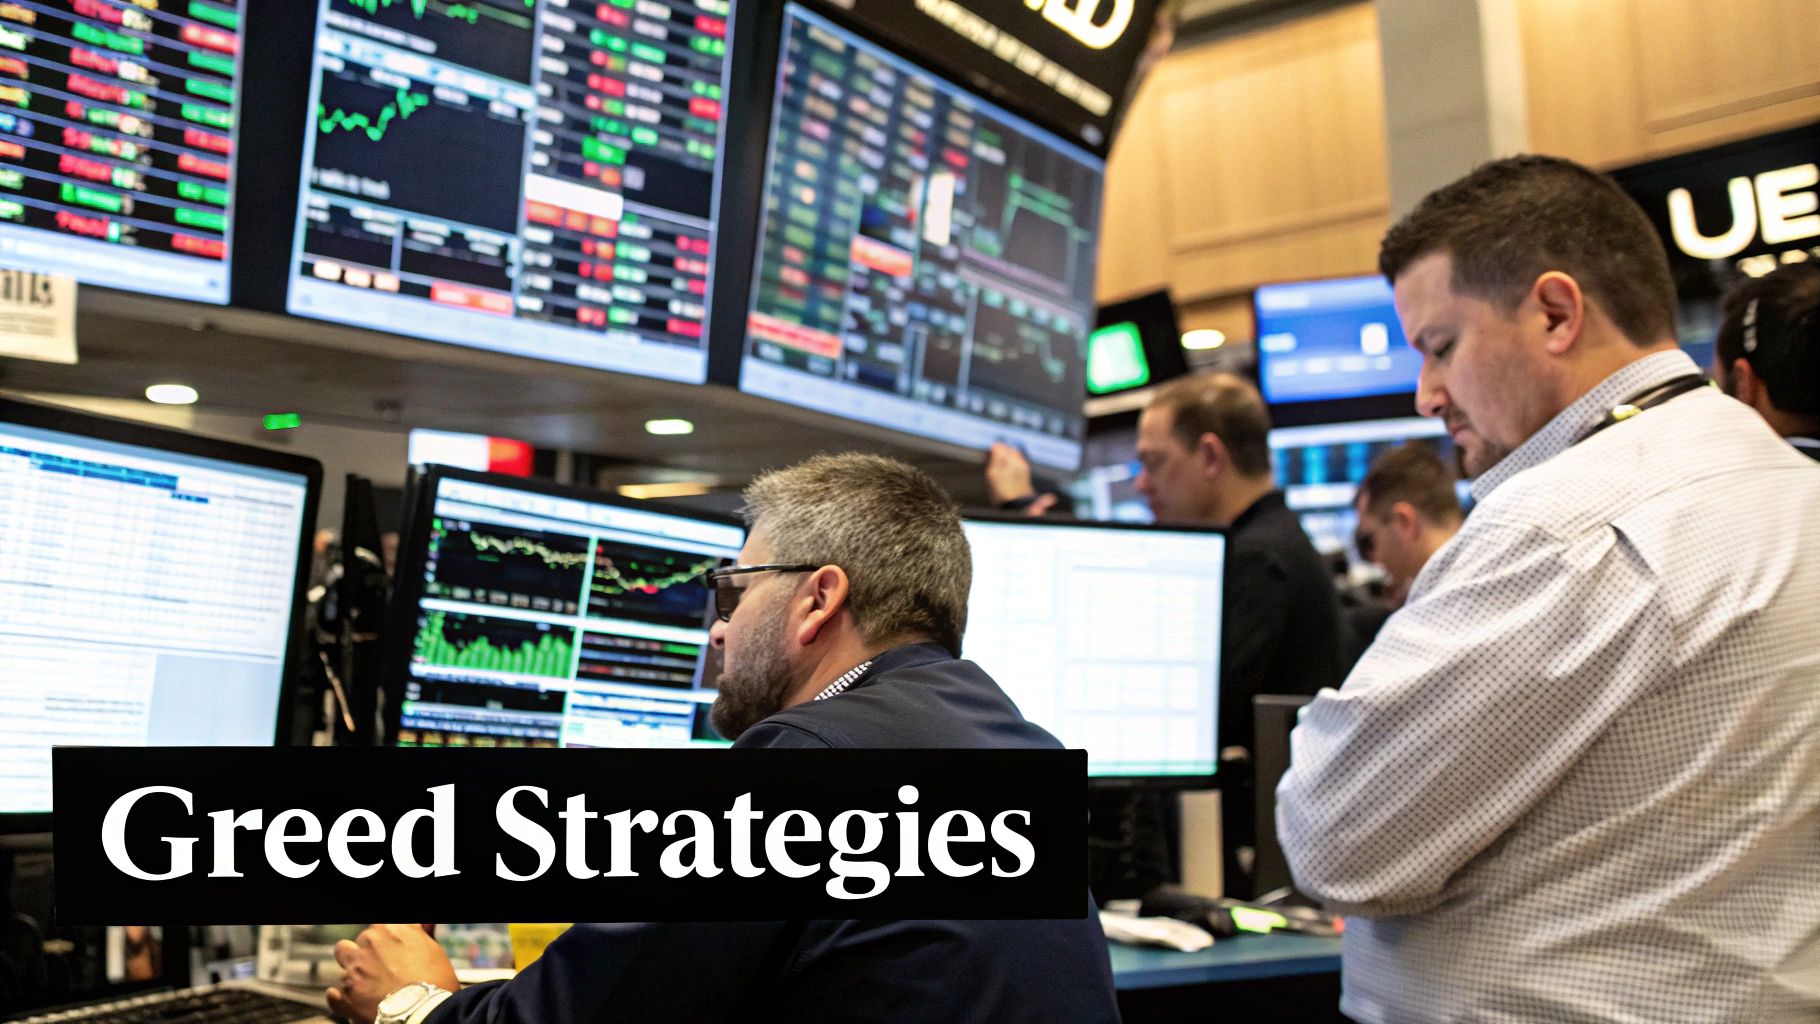
When Greed Signals Caution
On the flip side, a reading in the "Extreme Greed" zone (75-100) tells you that euphoria has taken the wheel. This is the "fear of missing out" (FOMO) in full effect, pushing asset prices to levels that may be completely disconnected from reality. When the index gets this hot, it's a signal to become more cautious, not more aggressive.
This doesn't mean you should immediately sell everything you own. It's more of a nudge to review your portfolio and tighten up your risk management.
- Re-evaluate Your Holdings: Are your positions still backed by solid fundamentals, or have they just been swept up in the hype?
- Trim Overextended Positions: It might be a good time to take some profits off the table, especially on stocks that have ballooned and now make up a huge chunk of your portfolio.
- Avoid Chasing Hype: This is probably the worst time to jump into a hot stock just because everyone's talking about it. The risk of buying right at the peak is incredibly high.
Ultimately, using the index is all about gaining perspective. For a more detailed playbook on these strategies, check out our guide on using the stock Fear & Greed Index to your advantage. It lays out a practical framework for when to buy, sell, or simply sit tight.
Understanding the Index's Limits and Pitfalls
While the fear and greed index offers a fantastic lens into the market's collective mind, it’s critical to remember what it isn't. This is not a magic bullet. Anyone who tells you they can predict the market with a single tool is selling something, and relying solely on this index for your trading decisions is a recipe for disaster.
Think of it less as a crystal ball and more as a sophisticated rear-view mirror. It’s brilliant at showing you the emotional climate right now, based on things that have already happened. It reflects current sentiment perfectly but doesn’t forecast future prices. That's a crucial distinction—it's a lagging indicator, not a leading one.
Using it alone is like driving a car while only looking in the mirrors. You can see exactly where you've been, but you have no idea what's coming up ahead.
It's a Thermometer, Not a Weather Forecast
One of the biggest traps traders fall into is treating the index as a simple "buy at 10, sell at 90" system. If only it were that easy. The market is far too messy and unpredictable for such a rigid formula.
A reading of "Extreme Fear" can stick around for weeks or even months during a nasty downturn. Jumping in too early just because the meter hits 10 can still lead to significant losses before the market finally finds a bottom. Remember, the market can always get more fearful.
Likewise, a state of "Extreme Greed" can persist much longer than seems rational, especially in a roaring bull market. If you sell out completely just because the index hits 80, you could be leaving a ton of money on the table.
The index tells you the market's temperature, but it doesn't tell you if a heatwave or a cold snap is about to hit. It identifies conditions, but it doesn't predict their duration or a definitive turning point.
Relying on it for precise timing is a losing game. Its real power is in providing context for your broader strategy, not dictating your every move.
A Broad View for a Specific World
Another key thing to remember is that the index measures the mood of the entire market, usually pegged to the S&P 500. While a tidal wave of fear or greed can certainly rock all boats, it might have very little to do with the specific outlook for an individual company you own.
A fantastic, well-run company with a great product can absolutely thrive even when the broader market is panicking. This is exactly why combining the index with other forms of analysis is non-negotiable for any serious investor.
- Fundamental Analysis: You always have to look at the health of the actual business. What are its earnings? How much debt is it carrying? What's its competitive edge? A low index reading is only a compelling buy signal if the underlying company is a solid one.
- Technical Analysis: Use other indicators like the Relative Strength Index (RSI) or moving averages to see if they confirm what the Fear & Greed Index is suggesting. When multiple signals point in the same direction, you can build a much stronger case for making a move.
Ultimately, the index is just one instrument in your financial toolkit—a very useful one, but just one. Use it to gauge the emotional tide and spot potential overreactions, but always anchor your final decisions in solid, company-specific research. That balanced approach is your best defense against getting swept up by false signals and making emotional mistakes.
Frequently Asked Questions About the Index
You've seen how the index works, where it came from, and how to think about it strategically. But a few practical questions always come up when traders start digging in. Let's clear those up so you can use the index with more confidence.
How Often Is the Index Updated?
The CNN Fear & Greed Index is updated once per day, every day the U.S. stock market is open. You can find the final, official reading shortly after the closing bell rings.
This daily rhythm gives you a fresh snapshot of where sentiment stands. It's not a historical summary from last week or last month—it’s an immediate pulse check on the market's emotional state, ready for you to review before the next trading session kicks off.
Does the Index Work for Individual Stocks?
No, not directly. The index is a macro tool, built to measure the collective mood of the entire market. It gets its data from broad market indicators, like activity in the S&P 500. Think of it as giving you a bird's-eye view of the whole forest, not a close-up look at one particular tree.
Of course, a powerful market-wide storm can drag down even the best stocks or lift the worst ones. But you should never use the index as your sole reason to buy or sell a specific company. It provides context, not a verdict on a single stock. Always pair its insights with solid, fundamental research on the company you're actually looking at.
The index tells you about the weather, but you still need to inspect the individual boat you plan to sail. A market-wide storm can affect everyone, but a sturdy vessel is better prepared to handle it.
Can I Use This Index for Cryptocurrency Markets?
The original CNN index is strictly for the stock market; it's completely irrelevant for digital assets. The idea was so powerful, though, that the crypto world quickly built its own versions.
You'll find various "Crypto Fear & Greed Indexes" that track sentiment for assets like Bitcoin and Ethereum. These alternative tools are built differently, using metrics that actually matter in the crypto space:
- Social media trends and hashtag volumes
- Bitcoin's dominance over the altcoin market
- Crypto-specific volatility patterns
- Google search trends for key crypto terms
While they both measure emotion, the components are custom-built for two very different worlds.
What Is a Good First Step for Using the Index?
Just watch. Seriously. The absolute best way to start is to become a passive observer before you ever risk a single dollar.
Make it a daily habit. Check the score after the market closes each day. Jot it down, then scan the day's financial headlines. Ask yourself simple questions: Does today's "Extreme Fear" reading line up with the sea of red and negative news? Does that "Greed" score make sense after a huge rally?
Over time, this simple act of watching and connecting the dots will give you an intuitive feel for how the index breathes with the market. If you want to explore more active approaches, a trader's guide to the Fear & Greed index can offer some advanced ideas. But this initial observation period is priceless—it builds the confidence and nuanced understanding you'll need before ever making it part of your live trading strategy.
At Fear Greed Tracker, we provide the tools to do just that. Our platform offers real-time scores, detailed analysis, and customizable alerts to help you transform market sentiment into a strategic advantage. Track over 50,000 assets and make data-driven decisions by visiting us at https://feargreedtracker.com.