
Price action trading is the art and science of making trading decisions based on the movement of price over time, rather than relying solely on lagging technical indicators. It's about reading the story the market is telling through its charts, a raw, unfiltered narrative of supply and demand, greed, and fear. By learning to interpret the key formations price creates, traders can anticipate potential market shifts with greater clarity and precision, reacting to what the market is doing, not what an indicator says it did.
This guide moves beyond generic advice to provide a deep, actionable dive into some of the most powerful price action trading patterns. We will dissect the most reliable and frequently occurring formations, from foundational concepts like Support and Resistance to complex reversal structures like the Head and Shoulders. For each pattern, you will learn not just what it looks like, but the underlying market psychology driving its creation.
You will gain a clear understanding of:
- How to accurately identify each pattern on a chart.
- The specific entry, stop-loss, and take-profit criteria for trading them.
- Real-world context on what makes a setup high-probability versus one to avoid.
Mastering these patterns is a crucial step toward developing a more intuitive and responsive trading approach. This comprehensive roundup is designed to equip you with the practical knowledge needed to decode the market's language and navigate its volatility with confidence, turning chart analysis into a core component of your strategic toolkit.
1. Support and Resistance Levels
Before diving into specific candlestick formations, the most foundational of all price action trading patterns are support and resistance levels. These are not patterns in the traditional sense, but rather the essential framework upon which most other patterns derive their significance. Support is a price level where a downtrend can be expected to pause due to a concentration of demand or buying interest. Conversely, resistance is a price level where an uptrend is likely to pause temporarily, due to a concentration of supply or selling interest.

These levels are psychological battlegrounds on a chart, marking areas where the market has made a significant decision in the past. When price approaches a prior high (resistance) or a prior low (support), traders anticipate a similar reaction. This self-fulfilling prophecy, driven by collective market memory, is what gives these levels their power. Understanding how to identify these zones is a non-negotiable skill for any price action trader.
How to Identify and Trade Support and Resistance
Identifying these levels involves looking for historical price points where the market has reversed direction multiple times. The more "touches" a level has, the more significant it is considered. For instance, Bitcoin famously struggled with the $20,000 resistance level for years after its 2017 peak. Each time the price approached this area, sellers stepped in, reinforcing it as a major barrier until it was decisively broken in late 2020. Similarly, major stock indices like the S&P 500 often find support at significant psychological round numbers like 4,000.
Actionable Trading Tips
To effectively use support and resistance in your strategy, consider these practical steps:
- Zone, Not a Line: Treat these levels as zones or areas, not as exact price lines. Price can often pierce a level slightly before reversing.
- Confluence is Key: The most powerful levels are those that align with other technical factors, such as Fibonacci retracement levels, moving averages, or trendlines.
- Role Reversal: A crucial concept is that once a resistance level is broken, it often becomes a new support level. The same is true for a broken support level, which can turn into resistance.
- Volume Confirmation: A breakout from a key level accompanied by high trading volume is a much stronger signal than one with low volume. It indicates strong conviction behind the move.
By mastering the art of drawing and interpreting these levels, you create a map for navigating market dynamics. These concepts are fundamental to understanding both bear and bull market cycles, as breakouts or breakdowns of major support and resistance often signal a shift in the primary trend.
2. Head and Shoulders Pattern
Among the most reliable and well-known reversal formations, the Head and Shoulders pattern is a classic chart pattern that signals a potential trend change from bullish to bearish. Popularized by technical analysis pioneers like Richard Schabacker, this pattern visually represents a weakening uptrend where buying momentum is fading. It is characterized by three distinct peaks built upon a common support line, known as the "neckline".
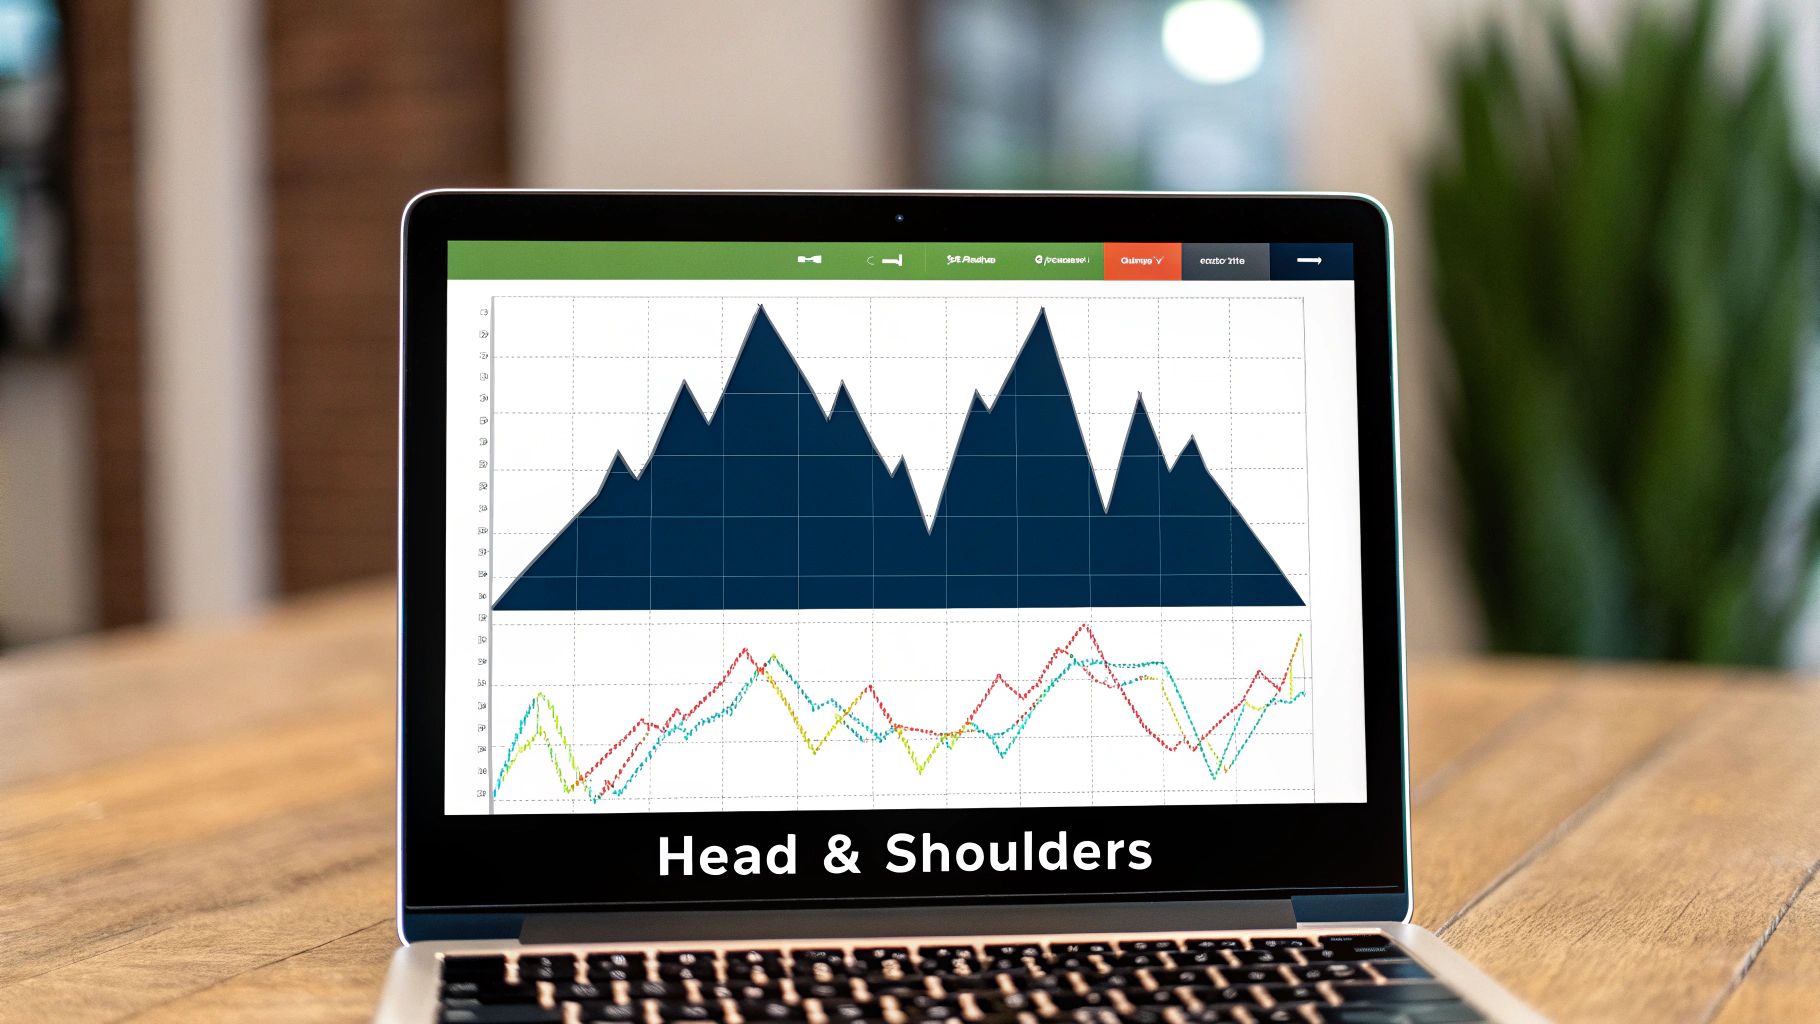
The pattern forms with an initial peak (the left shoulder), followed by a higher peak (the head), and then a lower peak (the right shoulder) that is roughly symmetrical to the first. This structure shows that while bulls pushed the price to a new high (the head), they lacked the strength to do so again on the subsequent attempt (the right shoulder). The pattern is confirmed when the price breaks below the neckline, signaling that bears have taken control and a downtrend is likely to follow. Its inverse counterpart, the Inverse Head and Shoulders, signals a potential bottom and a shift from bearish to bullish.
How to Identify and Trade the Head and Shoulders
Identifying this pattern requires patience, as it unfolds over a significant period. A classic example is the NASDAQ's topping pattern in early 2000, which formed a massive head and shoulders before the dot-com crash. More recently, Tesla (TSLA) stock formed a similar bearish pattern in early 2021 before a significant correction. The key is the neckline, which connects the lows between the three peaks. A decisive close below this line is the primary signal to consider a short position or exit a long one.
Actionable Trading Tips
To effectively use the Head and Shoulders pattern in your strategy, consider these practical steps:
- Wait for Confirmation: The most common mistake is acting too early. Do not trade the pattern until the price closes decisively below the neckline. Anticipating the break can lead to false signals.
- Volume is a Tell: Ideally, volume should decrease on the formation of the right shoulder compared to the left shoulder and head. A significant spike in volume on the neckline break provides strong confirmation of the reversal.
- Use the Pullback: After the initial breakdown, the price will often retest the broken neckline from below. This pullback to the new resistance area can offer a secondary, lower-risk entry point for a short position.
- Measure the Target: A common method for projecting a price target is to measure the distance from the top of the head to the neckline and subtract that distance from the breakout point. This provides a logical area to take profits.
By learning to spot this powerful formation, you can identify potential major trend reversals with greater confidence. It's one of the quintessential price action trading patterns that provides a clear story of shifting market sentiment from bullish exhaustion to bearish dominance.
3. Double Top and Double Bottom
Among the most classic and recognizable price action trading patterns are the double top and double bottom. These are powerful reversal patterns that signal a potential end to an existing trend. A double top, resembling the letter "M," forms after a significant uptrend, while a double bottom, shaped like a "W," appears after a prolonged downtrend. Both patterns indicate that the market has tested a key level twice and failed to break through, suggesting a shift in momentum is underway.
The psychology behind these patterns is a story of exhaustion. In a double top, the first peak marks the high point of the uptrend. After a pullback, buyers attempt to push the price to new highs but run out of steam at or near the previous peak. This failure to continue higher emboldens sellers, often leading to a sharp reversal. The opposite is true for a double bottom, where sellers fail to push the price to a new low on the second attempt, signaling that buying pressure is finally overwhelming selling pressure.
How to Identify and Trade Double Tops and Bottoms
Identifying these patterns requires patience, as they take time to develop. A double top consists of two consecutive peaks at roughly the same price level, separated by a moderate trough. The pattern is confirmed when the price breaks below the trough's support level, often called the "neckline." Conversely, a double bottom has two troughs at a similar price, separated by a peak. The bullish reversal is confirmed when the price breaks decisively above the neckline.
A historical example is the double top formed by the S&P 500 in 2007 before the financial crisis, signaling a major market reversal. More recently, crude oil formed a significant double bottom around the $26 level in early 2016, which marked the end of a brutal bear market and the start of a multi-year recovery. These real-world examples show the predictive power of these formations on a grand scale.
Actionable Trading Tips
To trade these reversal patterns more effectively, consider these crucial tips:
- Volume is a Veto: For a double top, volume on the second peak should ideally be lower than on the first, indicating diminishing buying enthusiasm. For a double bottom, look for higher volume on the breakout above the neckline, confirming bullish conviction.
- Wait for the Neckline Break: The most common mistake is entering a trade before the pattern is confirmed. Always wait for a clear, decisive close beyond the neckline before initiating a position to avoid false signals.
- Measure the Target: A common technique to project a price target is to measure the distance from the peaks (or troughs) to the neckline and then project that same distance from the breakout point.
- Look for Divergence: The pattern is often more reliable when accompanied by a bearish or bullish divergence on a momentum oscillator like the RSI or MACD. For instance, a double top where the second price peak is not confirmed by a new high on the RSI is a stronger sell signal.
By understanding the mechanics and psychology of these patterns, traders can better anticipate major trend changes. For a more detailed breakdown, you can explore this guide to the double bottom pattern, which covers entry, stop-loss, and target strategies in greater depth.
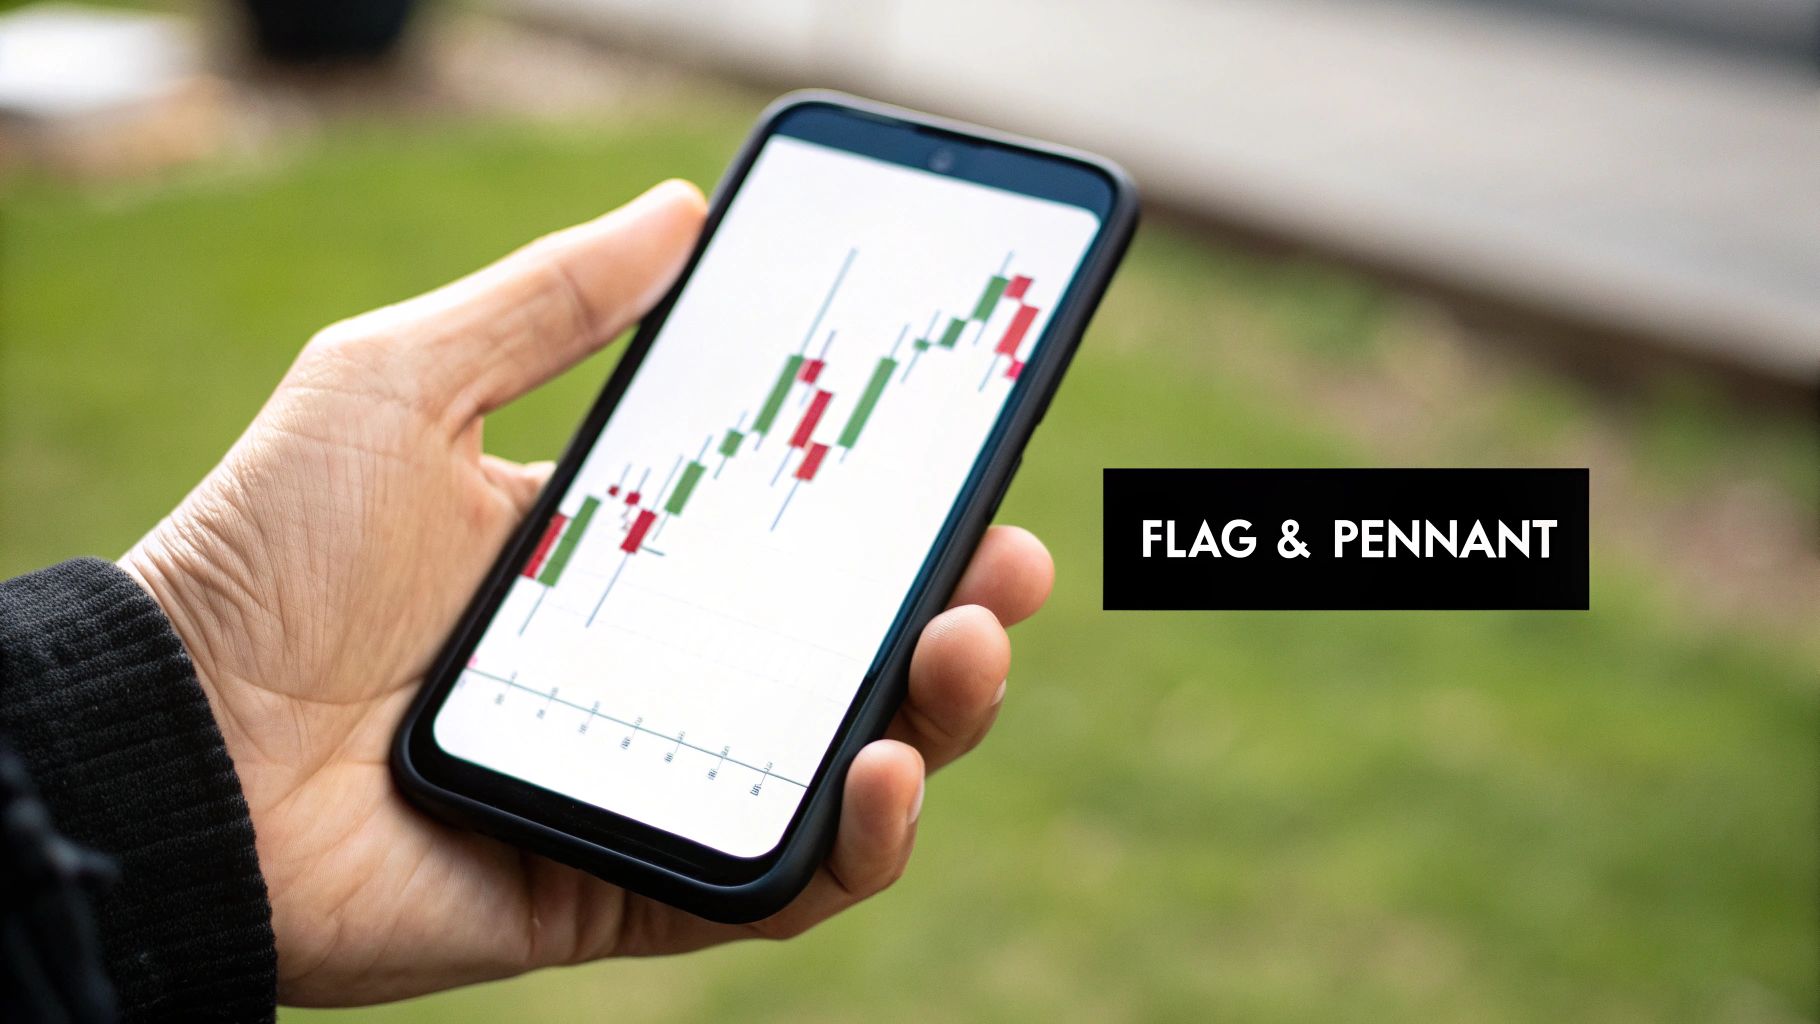
4. Flag and Pennant Patterns
Among the most reliable price action trading patterns for trending markets are the flag and pennant patterns. These are short-term continuation patterns that signify a brief pause or consolidation in a strong, established trend before the original move resumes. A flag appears as a small, rectangular channel that slopes against the prevailing trend, while a pennant forms as a small, symmetrical triangle. Both patterns are characterized by a sharp, nearly vertical price move (the "flagpole") followed by a period of consolidation.
These patterns represent a moment of equilibrium where the market "catches its breath" after a significant move. The initial sharp price action attracts profit-takers, while new traders look to join the trend, creating a temporary balance. This consolidation phase is crucial as it builds up energy for the next leg of the move, making the subsequent breakout a powerful trading signal. Pioneered by technical analysts like Schabacker and later emphasized by modern traders like Mark Minervini, these patterns are a staple for momentum traders.
How to Identify and Trade Flag and Pennant Patterns
Identifying these patterns begins with spotting the flagpole, which is a strong, impulsive move on high volume. The consolidation phase (the flag or pennant) that follows should occur on noticeably lower volume, indicating a temporary lull rather than a reversal. For example, during its massive 2020 rally, Tesla (TSLA) frequently formed bull flag patterns after sharp upward thrusts, providing clear entry points for traders looking to join the uptrend. Similarly, Bitcoin often exhibits pennant formations during its bull runs before breaking out to new highs.
Actionable Trading Tips
To effectively integrate flags and pennants into your trading, consider these specific steps:
- Volume is Crucial: The most reliable patterns show a significant volume decrease (often 50-90%) during the consolidation phase. The breakout from the pattern should be accompanied by a sharp expansion in volume, confirming the trend's continuation.
- Measure for Targets: A common technique for projecting a price target is to measure the height of the flagpole and add it to the breakout point. This provides a logical area to consider taking profits.
- Entry and Risk Management: The standard entry is on the breakout from the flag or pennant's trendline. A protective stop-loss can be placed just below the lowest point of the consolidation pattern to manage risk effectively.
- Context Matters: These patterns are most effective when they appear after a significant preceding move, ideally 20% or more. They are less reliable in choppy, range-bound markets.
By mastering the identification of these classic continuation patterns, traders can find high-probability entry points within strong trends. They serve as a clear visual representation of market psychology, showing a brief pause before the dominant market force reasserts its control.
5. Triangle Patterns (Ascending, Descending, Symmetrical)
Among the most recognizable price action trading patterns, triangle formations signal a period of consolidation or indecision that typically resolves with a powerful breakout. These patterns form as the price range contracts, with trend lines converging to create the distinctive triangular shape. Their value lies in signaling a potential continuation of the prevailing trend after a temporary pause, as market energy builds up within the narrowing price action.
There are three primary types of triangles: ascending, with a flat upper trend line and a rising lower trend line; descending, with a flat lower trend line and a falling upper trend line; and symmetrical, where both trend lines converge toward each other. Each type provides a unique clue about the underlying balance between buyers and sellers, making them essential tools for anticipating significant price moves.
How to Identify and Trade Triangle Patterns
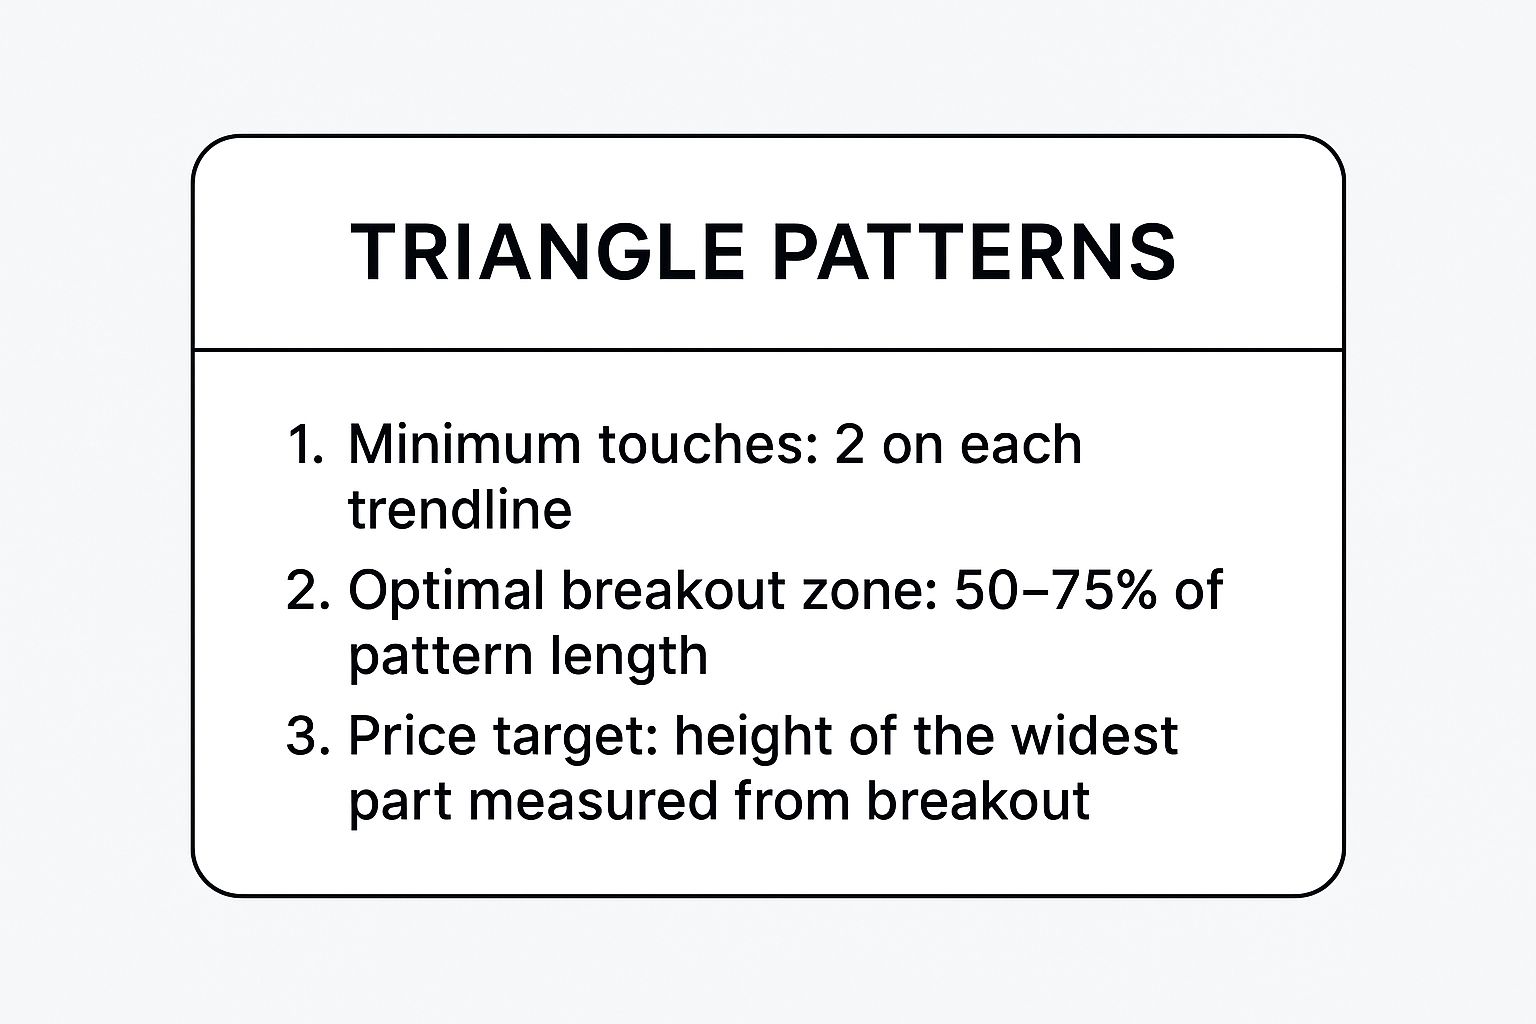
Identifying triangles involves drawing two converging trend lines that connect a series of swinging highs and lows. For a pattern to be valid, each trend line must be touched at least twice. For instance, Amazon's stock famously formed a large ascending triangle throughout much of 2017 before breaking out of its flat resistance, leading to a substantial rally. Similarly, the price of Gold formed a multi-month descending triangle in 2013, which ultimately broke to the downside, preceding a major decline.
The key to trading these formations is patience. Traders typically wait for a decisive price close outside of one of the trend lines, which signals the end of the consolidation phase and the start of a new directional move. This breakout is the primary trading signal.
Actionable Trading Tips
To effectively incorporate triangle patterns into your strategy, consider these practical steps:
- Wait for Confirmation: Never assume the direction of the breakout. Always wait for a clear candle close outside the pattern's boundaries. A breakout with a surge in trading volume provides much stronger confirmation.
- Anticipate Breakout Direction: While not guaranteed, ascending triangles have a bullish bias (historically breaking upward ~75% of the time), and descending triangles have a bearish bias (breaking downward ~72% of the time). Symmetrical triangles are often continuation patterns, tending to break in the direction of the preceding trend.
- Avoid the Apex: Trading becomes unpredictable as price gets closer to the apex (the point where the trend lines converge). The best breakouts often occur between the 50% and 75% point of the triangle's horizontal width.
- Set Price Targets: A common method for projecting a price target is to measure the height of the triangle at its widest part and add that distance to the breakout point (for an upside break) or subtract it (for a downside break).
6. Wedge Patterns (Rising and Falling)
Distinct from triangles, wedge patterns are powerful reversal formations characterized by price action consolidating between two converging trendlines that slope in the same direction. These patterns signal a potential exhaustion of the current trend and are a staple in the toolkit of many technical analysts, including Thomas Bulkowski and Martin Pring. There are two primary types: the rising wedge, which is bearish, and the falling wedge, which is bullish.
A rising wedge forms when price makes higher highs and even higher lows, contained within two ascending trendlines that are converging. This indicates that while the price is still climbing, the upward momentum is slowing down, often leading to a sharp downward breakout. Conversely, a falling wedge consists of lower lows and lower highs within two descending, converging trendlines. This pattern suggests that selling pressure is diminishing, setting the stage for a potential bullish breakout to the upside.
How to Identify and Trade Wedge Patterns
Identifying wedges involves drawing trendlines connecting the swing highs and swing lows. For a rising wedge, both lines will slope upward, while for a falling wedge, both will slope downward. The key is that the lines are converging, showing a tightening of price action and a loss of momentum for the prevailing trend.
For example, Bitcoin has historically formed large rising wedges at the peak of bull runs before major corrections, as the upward buying pressure gradually wanes. On the other hand, the S&P 500 carved out a significant falling wedge during the final stages of the March 2020 COVID-induced crash, signaling seller exhaustion just before a powerful market rebound began. These real-world examples show how wedge patterns can effectively signal major turning points.
Actionable Trading Tips
To incorporate these crucial price action trading patterns into your strategy, follow these guidelines:
- Context is Crucial: Rising wedges are most reliable as reversal patterns when they appear after a prolonged uptrend. Similarly, falling wedges carry more weight when they form after a significant downtrend.
- Look for Divergence: A powerful confirmation signal is momentum divergence. In a rising wedge, look for price making higher highs while an oscillator like the RSI makes lower highs. This bearish divergence reinforces the weakening momentum.
- Volume Confirms the Break: A genuine breakout from a wedge is typically accompanied by a significant expansion in trading volume. A low-volume break is less convincing and more prone to failure.
- Manage Your Risk: A common stop-loss placement is just beyond the opposite trendline of the breakout. For a bearish breakdown from a rising wedge, place a stop above the upper trendline (now resistance).
7. Candlestick Reversal Patterns (Doji, Hammer, Engulfing)
While larger chart patterns develop over many price bars, individual or small groups of candlesticks can offer powerful, immediate clues about market sentiment. Candlestick reversal patterns are specific formations, often consisting of one to three candles, that signal a potential turning point in the prevailing trend. They are a core element of price action trading patterns because they provide some of the earliest warnings of a possible shift in momentum.
These patterns are visual representations of the battle between buyers and sellers within a specific timeframe. A Doji, for instance, with its open and close prices being nearly identical, shows pure indecision. A Hammer at the bottom of a downtrend indicates that sellers pushed the price down, but buyers overwhelmed them and drove it back up. An Engulfing pattern signifies a powerful and decisive reversal where the new sentiment completely overtakes the prior period's momentum.
How to Identify and Trade Candlestick Reversals
The power of these patterns is magnified by their location. A Hammer pattern appearing in the middle of a choppy, directionless market carries little weight. However, a Hammer forming at a major historical support level after a prolonged decline is a high-probability signal that a bottom may be in. For example, during the March 2020 market crash, numerous individual stocks and indices formed powerful bullish reversal patterns like Hammers and Bullish Engulfing bars at their ultimate lows, signaling the start of a historic rebound.
Similarly, a Bearish Engulfing pattern at a strong resistance level after a sustained uptrend warns that sellers have taken control. Traders in major forex pairs like EUR/USD often watch for these patterns at key daily or weekly levels to signal potential trend reversals. Recognizing these formations is a vital skill, and a complete guide on how to read candlestick patterns can provide a deeper understanding.
Actionable Trading Tips
To effectively incorporate candlestick reversals into your trading, consider these key points:
- Context is Everything: The most reliable signals occur at pre-defined support and resistance levels, trendlines, or major moving averages. A pattern without context is just noise.
- Wait for Confirmation: A reversal pattern is a warning, not a guarantee. Wait for the next candle to confirm the move. A bullish reversal should be followed by another green candle closing higher.
- Volume Adds Conviction: High volume during the formation of a reversal pattern increases its significance. It shows that there is strong participation behind the potential sentiment shift.
- Combine with Indicators: Use indicators like the Relative Strength Index (RSI) for added confluence. A Bullish Engulfing pattern combined with a bullish divergence on the RSI is a much stronger signal.
Price Action Patterns Comparison Overview
| Pattern | Implementation Complexity 🔄 | Resource Requirements ⚡ | Expected Outcomes 📊 | Ideal Use Cases 💡 | Key Advantages ⭐ |
|---|---|---|---|---|---|
| Support and Resistance Levels | Low - simple horizontal levels | Low - basic charting tools | Moderate to High - high reliability with volume | All timeframes and markets, entry/exit points | Clear levels, foundation for strategies |
| Head and Shoulders Pattern | Moderate - pattern recognition & patience | Moderate - volume and trend analysis | High - reversal signals with defined targets | Trending markets, reversal identification | Strong reversal signal, clear risk management |
| Double Top and Double Bottom | Moderate - pattern formation over time | Moderate - volume and price monitoring | Moderate to High - reliable reversal pattern | Reversals in various markets/timeframes | Clear entries, well-defined stops |
| Flag and Pennant Patterns | Low to Moderate - short consolidations | Low - volume and price movement tracking | High - quick continuation signals | Strong trending markets, short-term trades | Fast formation, reliable breakout targets |
| Triangle Patterns | Moderate to High - trendline drawing & volume confirmation | Moderate - requires patience & volume tracking | High - reliable breakouts & risk/reward setups | Continuation or reversal, multiple timeframes | Clear breakout levels, versatile patterns |
| Wedge Patterns | Moderate - identify converging trendlines | Moderate - volume and momentum analysis | High - strong reversal signals | Reversals after trends, bull/bear markets | Good risk/reward, clear entry signals |
| Candlestick Reversal Patterns | Low - single or few candles | Low - candlestick charting | Moderate - early reversal signals | Key support/resistance points, all timeframes | Early signals, precise entries |
Integrating Patterns with Market Sentiment for a Winning Edge
You have journeyed through some of the most powerful and time-tested price action trading patterns in the technical analyst's toolkit. From the foundational logic of support and resistance to the predictive power of chart formations like the Head and Shoulders, Double Tops, and continuation patterns such as Flags and Triangles, you now possess a blueprint for interpreting market structure. We've explored how these patterns visually represent the ongoing battle between buyers and sellers, offering clues about potential reversals, continuations, and periods of consolidation.
The key takeaway is that these patterns are not just abstract shapes on a chart; they are the language of the market. A Rising Wedge signals waning bullish momentum, while a Hammer candlestick after a steep decline indicates potential seller exhaustion. By learning to read this language, you move beyond guessing and begin making decisions based on historical precedent and observable market psychology. The ability to identify a clean Double Bottom or a textbook Bull Flag provides a distinct, repeatable framework for entering and managing trades.
From Pattern Recognition to Probabilistic Thinking
However, true mastery extends beyond simple recognition. The most successful traders understand that no single pattern guarantees a specific outcome. Instead, they view each setup as a piece of a larger puzzle, a factor that shifts the probabilities in their favor. The real art lies in layering these technical signals with other contextual clues to build a high-conviction trade thesis.
This is where the transition from a novice to a seasoned trader occurs. It's about asking deeper questions:
- Where is this pattern forming? A bullish engulfing candle at a major long-term support level carries far more weight than one appearing in the middle of a choppy, undefined range.
- What is the prevailing trend? A Bull Flag is a high-probability continuation signal within a strong uptrend but is far less reliable in a downtrending market.
- What is the broader market context? This is perhaps the most critical, yet often overlooked, element.
The Decisive Edge: Synthesizing Patterns with Market Sentiment
This brings us to the ultimate differentiator: integrating your understanding of price action trading patterns with a keen awareness of market sentiment. A technically perfect bearish setup, like a Head and Shoulders pattern, can easily fail if the overall market is gripped by extreme bullish euphoria. Conversely, a potential bullish reversal pattern gains immense credibility if it forms when market sentiment is hitting rock bottom, indicating that maximum fear and pessimism may already be priced in.
Key Insight: Price action shows you what is happening. Market sentiment tells you why it's happening and how sustainable the move might be. By combining the two, you gain a powerful, multi-dimensional view of the market.
Imagine spotting a Falling Wedge, a classic bullish reversal pattern, on your favorite cryptocurrency. On its own, it’s a promising signal. Now, imagine you can simultaneously verify that the asset's sentiment score has just ticked up from 'Extreme Fear' to 'Fear'. This confluence provides powerful validation. It suggests that not only is the price structure showing signs of a bottom, but the underlying emotional driver of the sell-off is also beginning to recede. This synthesis transforms a speculative trade into a calculated, data-driven opportunity, dramatically increasing your confidence and precision. The goal isn't just to see the patterns; it's to understand the emotional climate in which they bloom.
Ultimately, your journey to mastering price action trading patterns is a continuous process of observation, application, and refinement. Use this guide as your foundation, but commit to practice and integrating wider market context. By doing so, you will elevate your analysis from simple pattern-spotting to a sophisticated, strategic approach that can consistently identify high-probability opportunities in any market condition.
Ready to add a powerful layer of sentiment analysis to your technical setups? The Fear Greed Tracker provides real-time sentiment scores for over 50,000 assets, allowing you to validate your price action trading patterns with hard data. Visit the Fear Greed Tracker today to see how combining technicals with sentiment can give you a decisive edge in the market.