
To really get a handle on candlestick patterns, you have to start with the basics: interpreting the four key data points that make up every single candle. Those are the open, high, low, and close prices.
Each candle—with its body, wicks, and color—is telling you a story about the battle between buyers and sellers during a specific timeframe.
The Building Blocks of Candlestick Charts
Before you can start spotting complex formations like a Morning Star or a Bearish Engulfing pattern, you need to master the art of reading just one candlestick. Think of it as a self-contained story of a single trading session. Learning its language is the first real step toward reading the market's mood and a core part of learning technical analysis for beginners.
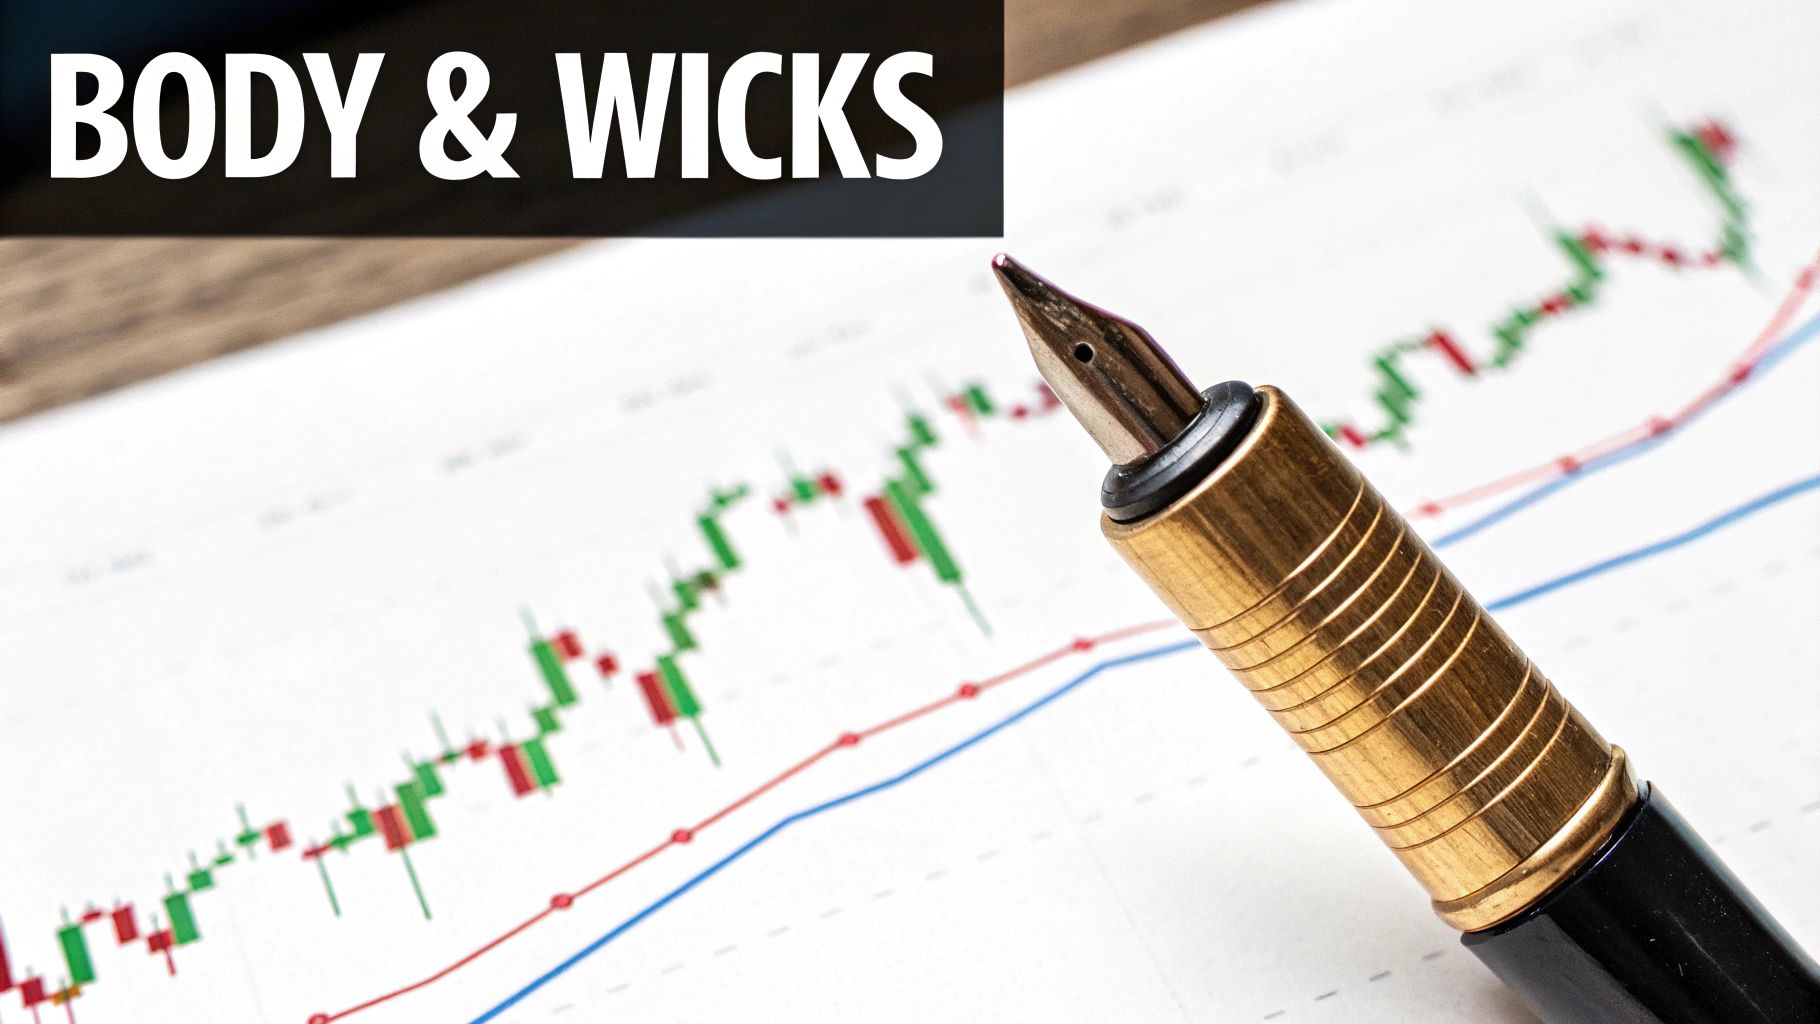
Every candle is a visual snapshot of price action. Its structure is simple but packed with information, built from two main parts: the body and the wicks.
- The Body: This is the thick, rectangular part of the candle. It shows you the range between the opening and closing price for that period. A long body signals strong conviction from either buyers or sellers, while a short body suggests traders are hesitant and unsure.
- The Wicks (Shadows): These are the thin lines sticking out from the top and bottom of the body. They show the highest and lowest prices the asset hit during the session. Long wicks tell you there was a lot of volatility and that price was rejected at those extreme levels.
Interpreting Color and Size
The color of the candle's body is your first and most obvious clue. Traditionally, a green (or white) candle is bullish, which means the closing price ended up higher than the opening price. Buyers won that session.
On the flip side, a red (or black) candle is bearish. The closing price was lower than the open, meaning sellers were in control.
The size of the body adds another layer of context. A long green body shows that buyers were firmly in charge, pushing prices up with confidence. A long red body tells the opposite story—sellers dominated, driving prices down hard. Short bodies, no matter the color, often point to a period of consolidation or a stalemate between the bulls and bears.
Trader's Insight: Pay close attention to where the price closes relative to the wicks. A candle closing near its high screams bullish momentum. If it closes near the low, it tells you sellers finished the session with all the power.
To make this crystal clear, here’s a quick breakdown of what each part of a candle signifies depending on its color.
Quick Guide to Candlestick Components
| Component | What It Means on a Bullish Candle | What It Means on a Bearish Candle |
|---|---|---|
| Body | The range where buyers pushed the price up from open to close. | The range where sellers pushed the price down from open to close. |
| Upper Wick | Shows the session's high; buyers pushed up but met resistance. | Shows the session's high; buyers tried to rally but failed. |
| Lower Wick | Shows the session's low; sellers tried to push down but met support. | Shows the session's low; sellers drove the price down but met buying pressure. |
| Color (Green) | The closing price was higher than the opening price (Bullish). | N/A |
| Color (Red) | N/A | The closing price was lower than the opening price (Bearish). |
This table is your cheat sheet for quickly deciphering the power dynamics within any single trading period.
The Story Told by Wicks
The wicks, or shadows, are where the real drama happens. They reveal the struggle that took place between the session's open and close.
A long upper wick on a candle shows that buyers made a bold attempt to push the price much higher, but sellers came in strong and forced it back down before the session ended. This is a clear sign of selling pressure lurking overhead.
Similarly, a long lower wick tells you that sellers tried to drag the price down, but buyers fought back fiercely and pushed it higher by the close. This reveals powerful, underlying buying pressure. When you see candles with long wicks and small bodies, it's often a signal of market indecision and a warning that a potential turning point could be near.
Finding Opportunity in Bullish Reversal Patterns
Spotting a potential market bottom is a game-changer. For any trader, these moments are gold. Bullish reversal patterns are your clues—the signals that a long downtrend is finally losing steam and buyers are starting to fight back.
Learning to read these patterns isn't about memorizing shapes. It’s about understanding the story playing out on the chart, a narrative of a power shift between sellers and buyers.
These formations are a visual representation of the exact moment sellers start to lose their grip. But the key isn't just seeing the pattern; it's understanding where it shows up. A bullish pattern in the middle of a choppy, sideways market? Mostly noise.
But find a textbook pattern at the tail end of a sustained downtrend? That’s when you need to sit up and pay attention.
The Hammer: A Sign of Buyer Resilience
The Hammer is one of the most classic single-candle signals for a reversal. You'll see it pop up after a price drop, and it’s easy to spot: a small body near the top of the candle with a long lower wick that's at least twice the size of the body.
Here’s the story it tells. During the session, sellers drove the price down hard, creating that long wick. But before the close, buyers came roaring back, pushing the price all the way back up to finish near where it started. That powerful rejection shows that all the selling pressure was absorbed.
Pro Tip: The color of the Hammer's body doesn't matter as much as its shape and location. That said, a green-bodied Hammer is a bit more bullish. It shows buyers didn't just fend off the sellers but actually managed to push the close above the open.
The Bullish Engulfing Pattern: A Decisive Takeover
If the Hammer shows rejection, the Bullish Engulfing pattern screams dominance. This two-candle pattern is a much stronger signal that sentiment has made a major shift.
You can identify it with these two characteristics:
- First Candle: A bearish (red) candle that's just another part of the ongoing downtrend.
- Second Candle: A much larger bullish (green) candle that completely "engulfs" the body of the previous red one. It opens lower than the last close but closes higher than the last open.
This pattern is a complete reversal of power in one session. Sellers thought they were in control, but then a huge wave of buying pressure stepped in, wiping out all their gains from the previous day and then some. It’s a crystal-clear picture of buyers seizing control.
The Morning Star: A Glimmer of Hope
The Morning Star is a three-candle pattern that gives you a bit more confirmation than a single candle. Think of it as a gradual shift from bearish despair to bullish hope. It's a favorite among many traders because it tends to be more reliable.
Here’s how it plays out on the chart:
- Candle One: A long, bearish candle confirming sellers are still large and in charge.
- Candle Two: A small-bodied candle (red, green, or even a Doji) that gaps down. This little candle signals indecision—the sellers' momentum is stalling out.
- Candle Three: A long, bullish candle that closes well into the body of the first candle, ideally more than halfway up. This confirms the buyers are back with a vengeance.
The psychology is easy to follow. The market was falling, paused with uncertainty, and then reversed with conviction. That second candle is the pivot point, showing the battle reached a stalemate before the buyers came out on top.
This isn't just chart folklore, either. A 2020 study looking at bullish reversal patterns like the morning star found they had real predictive power. Using them as trade signals led to consistent profits across major US and Asian markets. You can dig into the statistical significance of candlestick patterns yourself to see the data.
Understanding these patterns is about more than just looking at lines on a screen. It’s about reading market psychology to find entry points where the risk-reward has finally tipped in your favor.
Using Bearish Patterns to Spot Potential Tops
Knowing when a good run is losing steam is every bit as important as catching the bottom. After a powerful uptrend, the mood can flip on a dime. Bearish reversal patterns are your early warning system, flashing a signal that sellers are starting to wrestle control away from the buyers.
Learning to read these patterns is about seeing the story the market is telling. It’s the visual tale of a confident rally starting to stumble, giving you the heads-up you need to protect your gains or maybe even think about a short position.
These aren't just random shapes on a chart; they're the footprint of a power struggle. When they pop up at the peak of an uptrend, after a big price run-up, their message gets a lot louder. That context is what separates a real signal from simple market noise.
The Shooting Star: A Warning Shot from Sellers
The Shooting Star is that classic, single-candle pattern that screams "potential top." It's easy to spot at the peak of an uptrend: a small body hanging out near the bottom of the candle, with a long upper wick that should be at least twice the size of the body.
This pattern tells a pretty dramatic story. In a single session, buyers got excited and shoved the price way up, creating that long wick. But their party didn't last. Sellers crashed it, stepping in with enough force to slam the price all the way back down to close near where it opened.
Trader's Insight: The Shooting Star is a picture of a failed rally. That long upper wick is a brutal rejection from a higher price level. It shows that whatever buying pressure was fueling the trend just ran out of gas.
If the Shooting Star has a red body, it’s considered even more bearish. It means sellers not only fought back but actually won the session by pushing the close below the open, cementing their newfound dominance.
The Bearish Engulfing Pattern: A Decisive Shift in Power
If the Shooting Star is a warning shot, the Bearish Engulfing pattern is an all-out declaration of war. This is a powerful two-candle formation that signals a sudden and dramatic shift in sentiment from bullish to bearish.
You'll know it when you see these two things happen:
- First Candle: A standard bullish (green) candle, business as usual in the uptrend.
- Second Candle: A huge bearish (red) candle that opens higher than the previous close but then plunges to close lower than the previous open, completely swallowing the body of the first candle.
This is the chart’s way of showing you sellers overwhelming buyers in one fell swoop. The bulls thought they were in control, but a tidal wave of selling not only wiped out the previous day’s gains but set a new lower close. It's one of the clearest signs that a top might be in and sellers have seized control.
The Hanging Man: A Sign of Weakening Support
The Hanging Man is another single-candle bearish pattern that shows up at the top of an uptrend. It looks exactly like a bullish Hammer, but its location is everything. You'll see a small body at the top of the range with a long lower wick.
Here’s the story it tells. The session opened, and sellers managed to drag the price down significantly. The buyers fought back, sure, and managed to push the price back up to close near the open. But that long lower wick reveals that a serious amount of selling happened during the session.
This pattern suggests the floor is starting to crack. The very fact that sellers could push the price down that far is a major red flag, even if it recovered by the end of the day. It’s an early hint that the bullish momentum is fading and the trend’s foundation is getting shaky. Traders often wait for the next candle to close lower to confirm the signal.
Reading the Signs of Trend Continuation
Not every pattern is a screaming signal of a dramatic reversal. In fact, some of the most practical—and profitable—patterns are the ones that tell you a trend is just catching its breath.
These are called continuation patterns, and spotting them is your green light to stay in a winning trade with confidence. Instead of a major power shift, they show a brief pause before the original trend kicks back into gear. Learning to see them helps you avoid that classic mistake: bailing on a strong trade too early just because a small pullback spooked you.
Rising and Falling Three Methods
Think of the "Three Methods" patterns as a short story playing out on your chart. They are five-candle patterns that show the dominant market force taking a quick break before reasserting its control.
- The Rising Three Methods (Bullish): This one pops up during an uptrend. It kicks off with a long green candle. Then, you see three small red candles that all trade within the range of that first big one. The whole thing is confirmed by a fifth candle—another long green one that closes above the first candle's high. That's the signal that the uptrend is back on.
- The Falling Three Methods (Bearish): This is the mirror image, happening in a downtrend. It starts with a long red candle. What follows are three small green candles that stay contained within the first candle's range. The confirmation is a fifth, long red candle that closes below the first candle's low. Sellers are still firmly in charge.
The psychology here is pretty clear. Those three small candles are a weak attempt by the other side to take control, but they run out of steam. The final, large candle shows the original trend roaring back to life.
The Power of the Marubozu
The Marubozu is one of the most direct and powerful single-candle patterns you'll see. The name is Japanese for "bald" or "shaved head" because it has no wicks (or shadows). It's just a solid block of color, telling you one side was in complete control from open to close.
A Bullish Marubozu is a solid green candle that opens at its absolute low and closes at its absolute high. It’s a pure sign of extreme buying pressure and often signals that an uptrend has more room to run.
On the flip side, a Bearish Marubozu is a solid red candle opening at its high and closing at its low. This screams overwhelming selling pressure and suggests a downtrend still has plenty of momentum. When you spot a Marubozu pointing in the direction of an established trend, it's a huge sign of conviction.
Trader's Insight: Continuation patterns are most reliable when they show up in a clear, established trend. A Rising Three Methods pattern in a choppy, sideways market doesn't mean much. But one that forms during a strong, sustained uptrend? That's a signal worth paying attention to.
Distinguishing a Pause from a Reversal
So, how do you know if you're looking at a healthy pause or a dangerous reversal?
Volume is a massive clue. During a continuation pattern like the Rising Three Methods, you want to see trading volume dip during those three small consolidation candles. When the final, large trend candle appears, volume should pick back up, confirming the trend is back in business.
The size of the candles also tells a story. In a continuation pattern, the counter-trend candles are small and contained. But in a reversal pattern like an Engulfing, the reversing candle is huge and decisive, completely overwhelming the one before it.
The effectiveness of these patterns skyrockets in trending markets. According to technical analysis expert John J. Murphy, certain patterns can hit an accuracy rate near 70% in markets with strong directional momentum, though they become less reliable in choppy conditions. You can discover insights about candlestick accuracy on Strike.money to see how market conditions play a role.
By learning to read these signs of continuation, you can make smarter moves, like adding to a winning position during a pullback instead of closing it out way too early.
Combining Candlesticks with Other Indicators
A single candlestick pattern can give you a powerful clue about where the market might be headed, but it's rarely the whole story. I've learned the hard way that treating a pattern as a guaranteed outcome is a quick way to get burned.
To really elevate your analysis and make higher-probability trades, you have to confirm these patterns with other technical indicators. This layered approach is what separates traders who get lucky from those who are consistently profitable. It helps you filter out the market noise and sidestep those frustrating false signals.
Think about it: a perfect Bullish Engulfing pattern at the bottom of a downtrend is a great start. But if it’s also paired with a huge spike in trading volume? That signal just got a lot more reliable. The volume tells you that a lot of traders are jumping in, putting real conviction behind that reversal.
This simple flow is how I approach it every time: I check the trend, spot the pattern, and then look for confirmation.
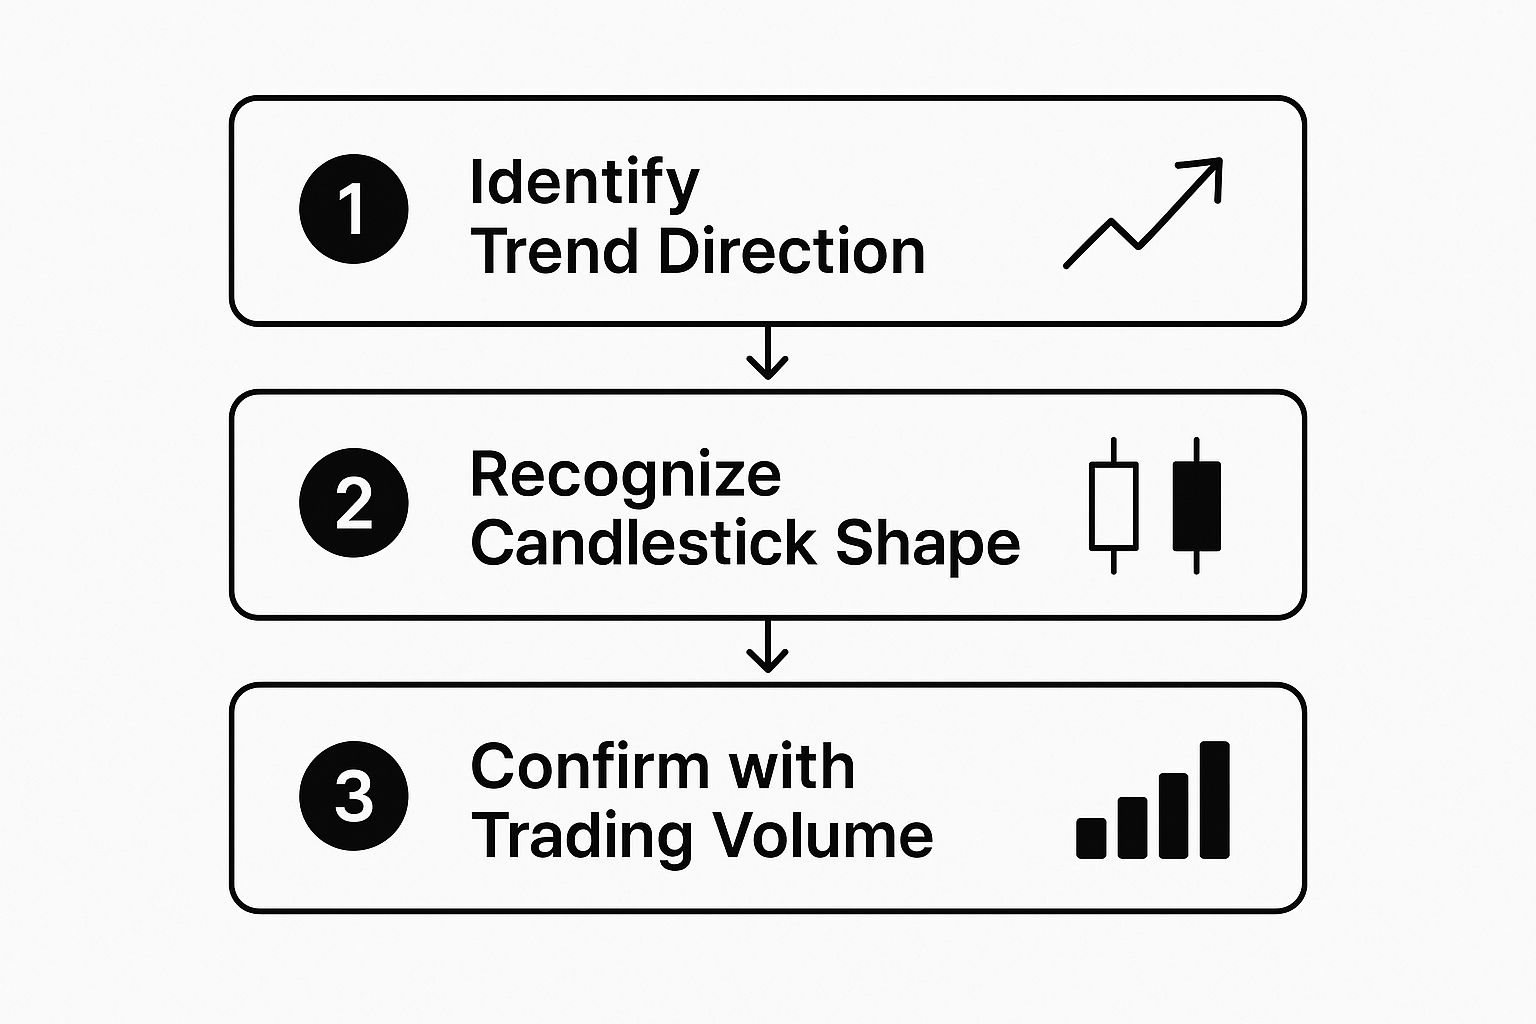
This systematic process—trend, pattern, confirmation—keeps me grounded and prevents me from jumping into trades based on just one piece of the puzzle.
Weaving in Momentum and Volume
Beyond simple volume, momentum oscillators like the Relative Strength Index (RSI) are invaluable. The RSI is fantastic because it measures the speed and change of price moves, flagging when an asset is overbought (usually above 70) or oversold (usually below 30).
Let's say you spot a Shooting Star—a classic bearish reversal pattern—at the peak of a strong uptrend. Before you do anything, you glance at the RSI and see it’s screaming a reading of 80. That's a huge layer of confirmation. The candlestick is hinting at a reversal, and the overbought RSI reading backs it up, suggesting the uptrend is running out of steam.
Here’s how I combine patterns with my favorite indicators:
- Moving Averages: I use MAs (like the 50-day or 200-day) to define the bigger trend. A bullish Hammer pattern is ten times more credible if it forms right as the price bounces off a key moving average that’s acting as support.
- Volume: High volume on a breakout or reversal candle shows that the big institutions are involved. Low volume on a pattern? That tells me there’s no real conviction, and it's more likely to fail.
- RSI and Stochastics: These are my go-to for confirming overbought or oversold conditions. A bearish pattern in an overbought market is a much stronger signal than one that just pops up in neutral territory.
Trader’s Insight: One of my all-time favorite high-probability setups is finding a bullish or bearish divergence with the RSI. If the price hits a new low but the RSI makes a higher low (that's bullish divergence), and then a Hammer or Bullish Engulfing pattern appears? That's an A+ setup for a potential long entry right there.
A Data-Driven Approach to Confirmation
The power of combining indicators isn't just a trader's gut feeling; it’s backed by serious research. A landmark 2025 study analyzed 61 distinct candlestick patterns using a convolutional neural network on high-frequency Forex data. The research found that while patterns alone had some predictive value, pairing them with simple moving averages (SMAs) to define the trend boosted prediction accuracy to an incredible 99.3%.
That number blows traditional methods, which usually hover between 56% and 91.51%, out of the water. You can dive into the full findings on candlestick pattern effectiveness to see the statistical edge for yourself.
The data confirms a critical lesson: candlesticks tell you what’s happening right now, but other indicators provide the broader context. You need both to make smart decisions. This multi-layered analysis is the bedrock of any solid trading plan. If you're ready to build out that framework, our guide on mastering risk management in trading is the perfect next step.
Never trade a pattern in a vacuum. Always, always seek confirmation.
Common Questions About Candlestick Patterns
Even after you’ve memorized the major patterns, questions always pop up when you're staring at a live chart. It happens to everyone. Let's walk through some of the most common hurdles traders face when trying to read candlesticks in the real world.
Getting these right will help you build confidence and, more importantly, avoid some classic mistakes.
What Is the Best Time Frame for Candlesticks?
There’s no magic answer here—it all comes down to your trading style. The great thing about candlestick patterns is they're fractal, meaning you'll see them on a 1-minute chart, a weekly chart, and everything in between.
So, how do you choose? It depends on your horizon:
- Day traders live on the 5-minute to 15-minute charts, hunting for moves that play out within the day.
- Swing traders typically lean on the 4-hour and daily charts. They're looking for setups that might last a few days or even a couple of weeks.
- Long-term investors might zoom out to the weekly charts to get a bird's-eye view of major market trends.
As a rule of thumb, patterns on higher time frames are more reliable. A Hammer on a daily chart carries far more weight than one on a 5-minute chart because it reflects a full day of trading—more volume, more participants, and more conviction.
How Reliable Are Candlestick Patterns on Their Own?
Candlestick patterns are powerful, but you should never, ever use them in isolation. Think of a pattern as a strong hint from the market, not a guarantee. Their reliability skyrockets when you get confirmation from other signals.
A pattern appearing without any other confirming signals is like hearing a single clap in an empty theater—it could be something, but it’s more likely just noise. You need the full applause of confirming indicators to act with confidence.
Always look for confluence, which is just a fancy way of saying multiple signals are pointing in the same direction. For instance, a Bullish Engulfing pattern is interesting. But a Bullish Engulfing at a major support level, with a spike in volume and an oversold RSI? Now that's a high-probability trade setup.
Layering your analysis like this is how you filter out the false alarms.
What Is the Biggest Mistake Traders Make?
Without a doubt, the single biggest mistake is ignoring the context. A textbook-perfect Hammer pattern means absolutely nothing if it doesn't show up after a clear downtrend. The same goes for a Bearish Engulfing pattern that appears in the middle of a choppy, sideways market—it’s just noise.
Context is everything. You have to look at what happened before the pattern formed. Was the price trending up or down? Is the market generally bullish or terrified? A pattern is only as strong as the story it completes.
This is where understanding the broader market mood is crucial. Sentiment analysis tools can give you that critical context. For a deeper dive, our trader's guide to the Fear and Greed Index is a great place to start learning about market psychology.
At Fear Greed Tracker, we provide the real-time sentiment data you need to confirm your candlestick analysis. Our platform transforms market fear and greed into a strategic advantage, giving you the context to make smarter, data-driven decisions. Get instant sentiment insights for over 50,000 assets and stop trading on patterns alone. Visit us at https://feargreedtracker.com.