
When you’re trying to get a feel for the stock market, it’s easy to get lost in the noise of charts, earnings reports, and expert opinions. But what if you could take the market’s emotional temperature with a single glance? That's exactly what CNN’s Fear & Greed Index was built to do.
Think of it as a market mood ring. It operates on a simple 0-100 scale, giving you a real-time pulse of whether investors are acting out of fear or getting a little too greedy.
What Is the Fear and Greed Index?
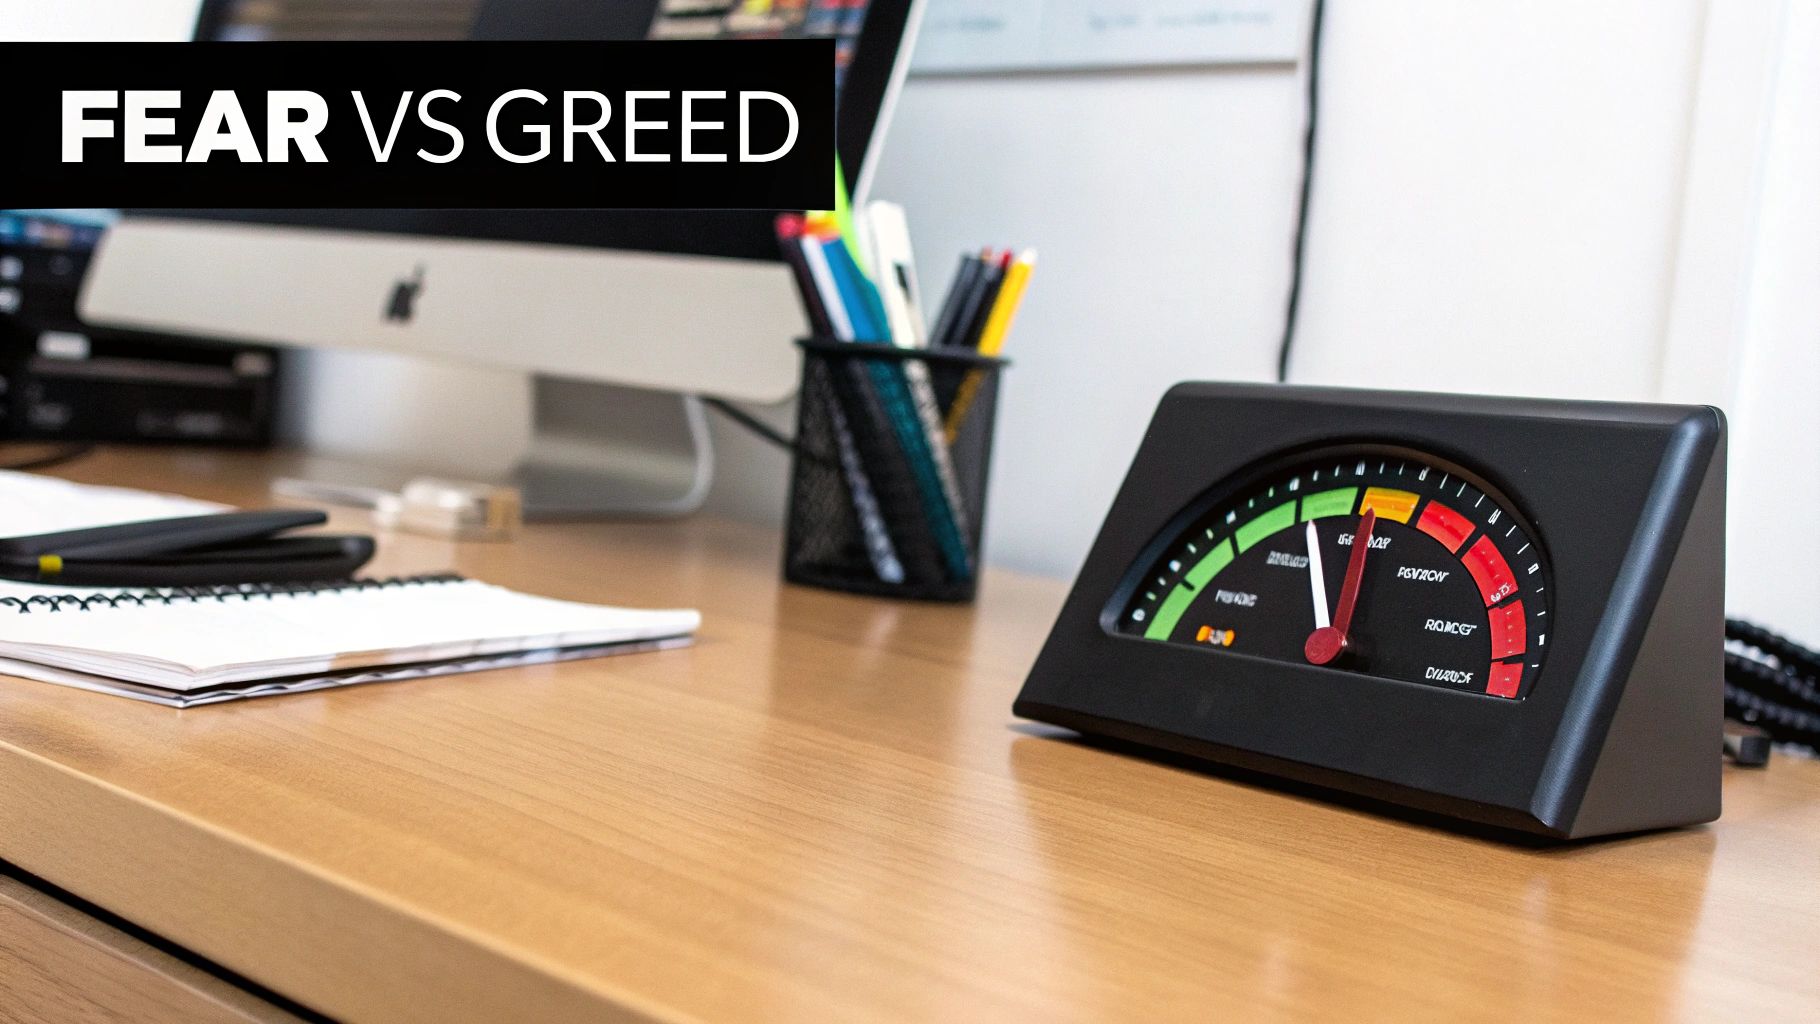
The dial above, from CNN Money, tells the whole story in an instant. It points to where the collective investor psyche is at any given moment, from "Extreme Fear" all the way to "Extreme Greed." This simple visual is a powerful summary of whether the market is panicking or popping champagne.
At its heart, the index is a fantastic contrarian barometer. It’s designed to help you spot moments when the market might be getting irrational, driven more by emotion than by fundamentals. The logic behind it is beautifully simple:
- Extreme Fear (Low Readings): When the index plummets, it's a sign of widespread pessimism. Investors are hitting the sell button, often indiscriminately. For a savvy contrarian, this can be a flashing green light—a signal that quality stocks might be on sale and a buying opportunity is forming.
- Extreme Greed (High Readings): On the flip side, a high reading screams euphoria. Everyone feels like a genius, and caution gets thrown to the wind. This is a warning sign that the market could be overbought and due for a reality check, or what we call a correction.
It’s basically a tool for applying Warren Buffett's famous wisdom: "be fearful when others are greedy and greedy when others are fearful." For a deeper dive into applying this mindset, our trader's guide to the Fear and Greed Index breaks it down even further.
The Fear & Greed Index isn't a crystal ball that predicts the future. Instead, it’s a gut check. It gives you critical context on market psychology, so you can understand the emotional climate before you make your next move.
A Quick Guide to the Index Levels
To make sense of the dial at a glance, here’s a quick breakdown of what each level generally means for the market.
| Index Reading | Sentiment Level | Potential Market Implication |
|---|---|---|
| 0-24 | Extreme Fear | Widespread panic; potential undervaluation and buying opportunities. |
| 25-44 | Fear | Investors are nervous, but not in full panic mode. |
| 45-55 | Neutral | The market is balanced, with no strong emotional pull. |
| 56-75 | Greed | Optimism is high; investors are chasing gains. |
| 76-100 | Extreme Greed | Euphoria and complacency; market may be overbought and due for a correction. |
This table serves as a handy reference, but remember that these are just general guidelines. The real magic comes from using these levels as a starting point for your own analysis.
Since its launch in 2011, the index has charted the market’s emotional roller coaster over thousands of trading days. Its long-term average sits at a nearly neutral 49.09, but it’s the dramatic swings that tell the real story.
Data shows that the market has registered "extreme fear" on 15% of all trading days, while "extreme greed" has appeared on 10% of days. This highlights just how often sentiment reaches levels where smart investors should be paying close attention. If you’re a data nerd, you can review the historical data on the index's performance to see these patterns for yourself.
Breaking Down the 7 Core Indicators
The Fear & Greed Index isn't just some arbitrary number. It’s a sophisticated instrument that blends seven different market metrics into a single, digestible score. Think of it as a finely tuned orchestra—each indicator is a unique instrument, and only when they play in harmony do you get a clear sense of the market's true emotional state.
To really grasp what the index is telling you, you have to pop the hood and look at the engine parts. Let's break down each of the seven components one by one.
This infographic gives you a bird's-eye view, showing how the indicators group together to measure things like market momentum, volatility, and raw investor sentiment.
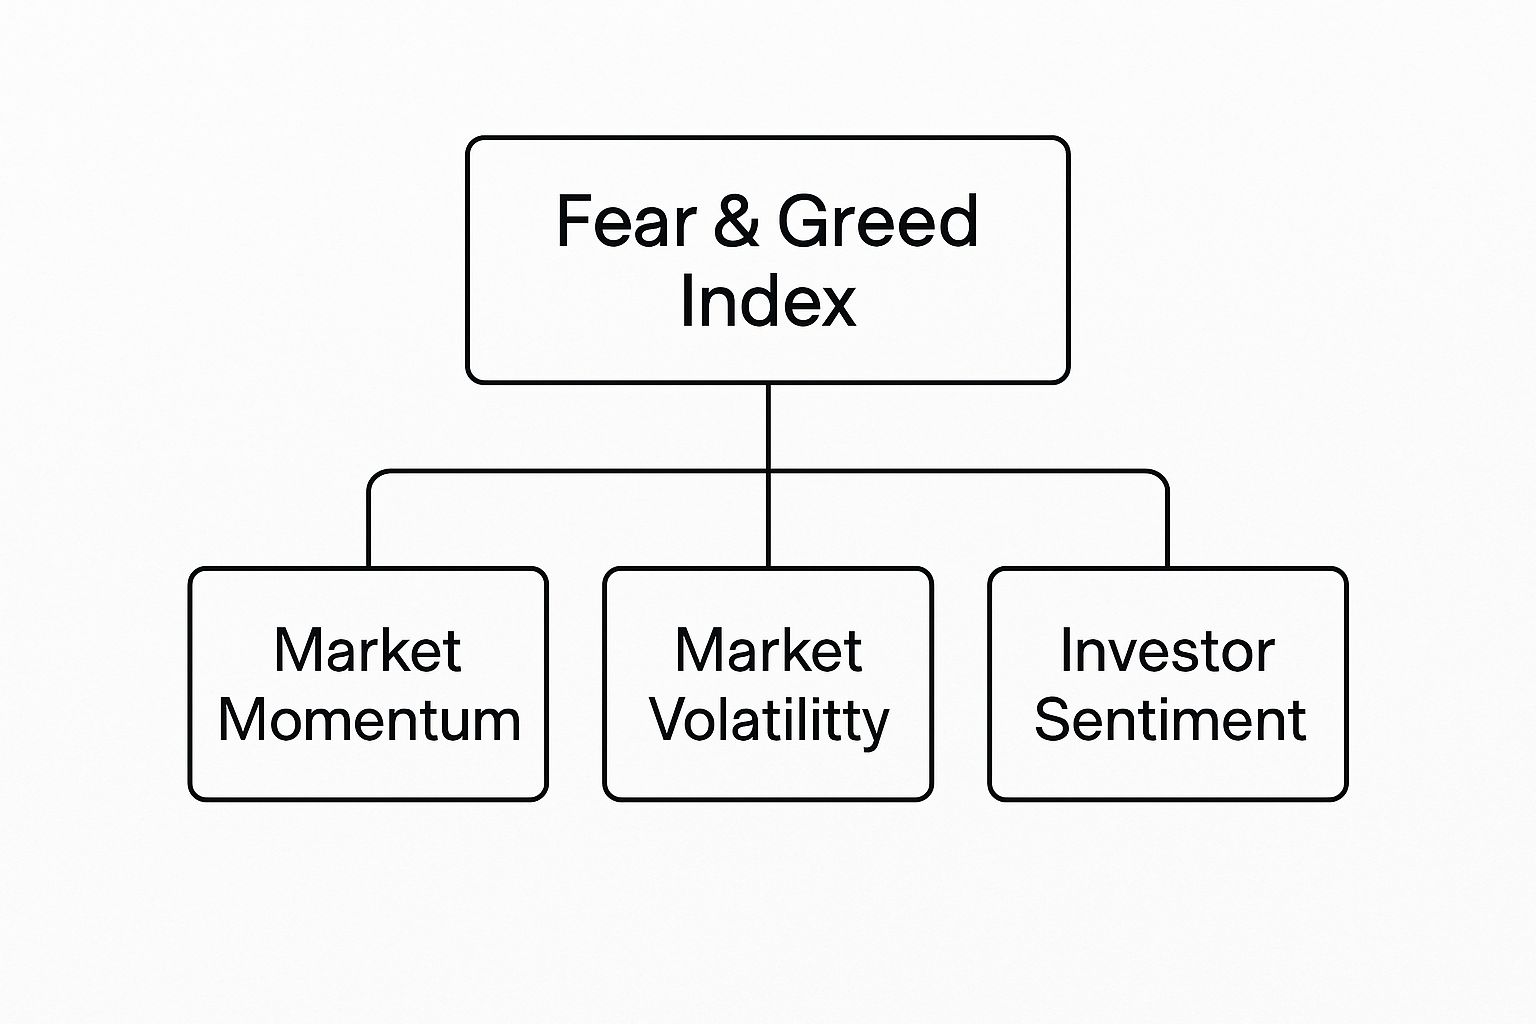
As you can see, the index is built on a solid foundation of distinct but interconnected market forces. Each one plays a crucial role in the final emotional reading.
To make sense of these components, I've put together a table that summarizes what each one tracks and how it contributes to the overall score.
A Summary of the 7 Fear & Greed Indicators
| Indicator | What It Measures | Signal of Fear | Signal of Greed |
|---|---|---|---|
| Stock Price Momentum | S&P 500 vs. its 125-day moving average | S&P 500 is far below its average | S&P 500 is far above its average |
| Stock Price Strength | Number of stocks at 52-week highs vs. lows | More stocks at 52-week lows | More stocks at 52-week highs |
| Stock Price Breadth | Trading volume in rising stocks vs. falling stocks | Higher volume in falling stocks | Higher volume in rising stocks |
| Put and Call Options | Ratio of bearish put options to bullish call options | High ratio of puts to calls | High ratio of calls to puts |
| Junk Bond Demand | The yield spread between junk bonds and safe bonds | Investors demand higher yields for junk bonds | Investors accept lower yields for junk bonds |
| Market Volatility (VIX) | The market's expectation of 30-day volatility | The VIX is rising or high | The VIX is falling or low |
| Safe Haven Demand | Performance of stocks vs. Treasury bonds | Bonds are outperforming stocks | Stocks are outperforming bonds |
This table provides a great cheat sheet, but let's dig into the why behind each one.
1. Stock Price Momentum
First up is a classic measure of momentum. This indicator looks at where the S&P 500 is trading relative to its 125-day moving average.
When the index is riding high above this long-term average, it’s a clear sign of bullishness and greed. But when it slips significantly below, it signals that fear is creeping in and momentum has soured.
2. Stock Price Strength
This one is all about participation. It compares the number of stocks hitting fresh 52-week highs to the number hitting depressing 52-week lows on the New York Stock Exchange.
If you see a stampede of stocks making new highs, it's a sign of a strong, confident, and greedy market. Conversely, a growing list of stocks at new lows is a major red flag for fear and heavy selling pressure.
3. Stock Price Breadth
Are buyers or sellers more motivated? That's what stock price breadth tries to answer by analyzing trading volume. It specifically pits the volume of rising stocks against the volume of falling stocks.
When advancing stocks are trading on high volume, it shows conviction from buyers—a classic sign of greed. But if declining stocks are seeing all the action, it tells you sellers are in firm control, reflecting widespread fear.
4. Put and Call Options
The options market is where traders go to place their bets, making it a fantastic sentiment gauge. This indicator checks the ratio of bearish put options (bets on a price drop) to bullish call options (bets on a price rise).
A high ratio of puts to calls means traders are rushing to protect their portfolios, which is a textbook signal of fear. When call buying explodes, it points to rampant speculation and greed.
5. Junk Bond Demand
This indicator is a bit more subtle but incredibly telling. It measures the spread, or difference in yield, between risky "junk" bonds and safer investment-grade corporate bonds.
When investors are feeling greedy and chasing higher returns, they'll accept a smaller premium for taking on risk. This shrinks the spread. When fear takes hold, they demand more compensation for that risk, and the spread widens as they flock to safety.
6. Market Volatility (VIX)
You’ve probably heard of this one. The CBOE Volatility Index (VIX) is often called the market's "fear gauge," and for good reason. It tracks the market's expectation of volatility over the next 30 days.
A low and stable VIX suggests investors are complacent and comfortable—a greedy environment. But when the VIX starts to spike, it means uncertainty and anxiety are rising, signaling a sharp increase in fear.
7. Safe Haven Demand
When investors get scared, where do they hide their money? This final indicator answers that by comparing the returns of stocks against ultra-safe Treasury bonds over the last 20 trading days.
If stocks are handily outperforming bonds, it means investors have a healthy appetite for risk (risk-on), which is driven by greed. But when money pours into bonds, causing them to outperform stocks, it’s a clear sign that investors are running for cover (risk-off), and fear is the dominant emotion.
How to Interpret What the Index Is Telling You
Knowing the seven components behind the index is one thing. Translating that single number into a smart decision is a whole different ballgame. The real power of the index isn't just knowing the score—it's learning how to read the story the market is telling you.
Think of it less like a crystal ball and more like a traffic light for your investment strategy. It’s a tool that gives you crucial context on market psychology, helping you gauge whether to hit the brakes or if an opportunity is flashing a green light. This is where contrarian thinking comes into play, turning crowd emotion into a tactical advantage.
Decoding Extreme Fear and Greed
The most powerful signals pop up at the extremes. When the dial swings hard to one side, it's a huge clue that raw emotion has probably hijacked rational thinking for the average investor.
Extreme Fear (Readings below 25): This is the market in full-blown panic mode. You'll see widespread selling, grim headlines everywhere, and a general sense of doom. It’s when investors are dumping assets, sometimes without rhyme or reason. For a disciplined investor, this can be a buy signal. It often points to market capitulation—a sign the worst of the selling might be over, creating a potential opening for those brave enough to go against the herd.
Extreme Greed (Readings above 75): Welcome to the market’s party phase. Euphoria is in the air, everyone's celebrating big wins, and the fear of missing out (FOMO) is running the show. This is your cue to be cautious. It warns that the market might be overstretched, valuations are getting frothy, and a pullback could be just around the corner. It’s a signal to think about taking some profits off the table and avoid jumping into new, risky positions.
This entire approach is the heart of what it means to be a contrarian. For a deeper dive, check out our guide on using sentiment analysis for stocks to read the market's mood.
The Key Takeaway: The Fear & Greed Index doesn't pinpoint the exact top or bottom. Its job is to tell you when the odds might be shifting in your favor. Extreme fear suggests risk could be lower and potential reward higher, while extreme greed hints at the opposite.
Looking Beyond the Number
A single reading from the Fear & Greed Index is just a snapshot. The real magic happens when you watch how it behaves over time. One of the most powerful techniques is spotting divergences.
Here’s an example: Imagine the index is screaming "Extreme Fear," but the S&P 500 stops making new lows and starts to level off. This clash—fear is high, but the market isn't falling further—can be a strong signal that selling pressure is running out of steam. The market could be building a base for its next move up.
At the end of the day, the index is a fantastic sentiment indicator, but it should never be your only one. Always pair its signals with your own fundamental research and technical analysis. Think of it as one essential tool in a well-stocked toolkit, there to help you make more informed, less emotional decisions.
Of course. Here is the rewritten section, crafted to sound like it was written by an experienced human expert, following all the provided guidelines and examples.
What We Can Learn from History’s Biggest Market Swings
Theory is all well and good, but the real magic of the Fear Greed Index CNN shows up when you see it in action during a massive market meltdown or a euphoric rally. Looking back at how the index behaved during these pivotal moments gives us clues that cold, rational analysis often misses. These historical snapshots prove that extreme emotion is frequently the loudest signal of an approaching turning point.
Take the March 2020 COVID-19 crash. It was a perfect storm of fear. As the world ground to a halt, investors weren’t just nervous; they were terrified. They dumped stocks indiscriminately, driven by pure panic. The index didn't just dip into "Fear"—it cratered, hitting a rock-bottom reading of 1 on March 12, 2020.
That single-digit score wasn't just fear; it was absolute, unconditional capitulation. But for a contrarian investor, it was a screaming buy signal. The moment of maximum fear was also the moment of maximum opportunity.
This is the index’s core lesson in a nutshell. The market was scraping the bottom right as the index hit its nadir, setting the stage for one of the most explosive recoveries we've ever seen. Anyone who recognized that signal had a rare chance to get in at a massive discount.
Greed as a Red Flag
The index isn't just for calling bottoms; it's an incredible early warning system for tops, too. Cast your mind back to 2021. Markets were roaring, fueled by stimulus checks and a wave of speculative mania. The index? It spent months hovering in "Extreme Greed" territory.
Toward the end of 2021, just as the major indexes were hitting their all-time highs, the Fear & Greed Index was consistently flashing readings above 75. This signaled a dangerous level of complacency—a collective "can't lose" mentality. Sure, the party kept going for a little while longer, but that extreme greed was a clear sign that risk was piling up. What happened next? The market rolled over into a major downturn in 2022.
It perfectly illustrates the two sides of the emotional coin:
- Extreme Fear often means the sellers are exhausted and there's nobody left to panic.
- Extreme Greed suggests the buyers are getting tired and the euphoria can’t last.
How Geopolitical Shocks Rattle the Market
Global events can send sentiment swinging wildly, and the index is great at capturing that whiplash. Imagine, for instance, a scenario in April 2025 where the Fear and Greed Index nosedives to a five-year low of 3—its weakest point since the 2020 crash. A drop that severe would almost certainly be tied to a major geopolitical shock, like a sudden escalation in US-China trade disputes.
In that situation, the market would react instantly, with selloffs mirroring the anxiety that the index captured. You can read more about how the index has historically responded to these global market pressures.
When you look at these moments side-by-side, a clear pattern emerges. The Fear & Greed Index consistently highlights the emotional tides that define market tops and bottoms. It’s not a crystal ball, but it’s an invaluable tool for keeping your head when everyone else is losing theirs.
How To Use The Index In Your Investment Strategy
Okay, so you get what the Fear & Greed Index is. But understanding it is one thing—actually using it to make smarter, more disciplined decisions is where the real magic happens. Think of it as your guide for stepping back from the market’s emotional roller coaster.
The secret is to weave its signals into your own personal style. Whether you're a long-term investor patiently building wealth or an active trader capitalizing on short-term moves, the index has something to offer.
For those in it for the long haul, the index is a fantastic companion for timing your investments. When it plummets into "Extreme Fear," it’s basically shouting that the market is panicking. This is often the perfect time to dollar-cost average into solid companies you already believe in, but at a serious discount. Instead of running from the dip, you can see it for what it is: a sale on quality assets.
Active traders can use the index a bit differently, more like a confirmation tool. It adds an extra layer of confidence before you pull the trigger. Say your technical charts suggest a stock is primed for a breakout, but the index is screaming "Extreme Greed." That’s your cue to pause. A high greed reading is a red flag that the market is overbought and a pullback could be right around the corner, potentially saving you from a nasty bull trap.
A Simple Decision-Making Framework
To make the index truly useful, you need a simple, repeatable process. This three-step framework keeps you from treating it like a magic 8-ball and ensures it’s just one part of a balanced strategy.
- Get the Vibe: First, check the index. Is the mood fearful, greedy, or somewhere in the middle? Don't just glance at today's number. Look back at the trend over the last few weeks to get the full emotional picture.
- Cross-Check Your Homework: Next, see if the market's mood aligns with your own research. Does that "Extreme Fear" reading line up with a key support level on your charts or your own fundamental analysis showing a stock is undervalued? This reality check is non-negotiable.
- Execute with Discipline: Finally, stick to your plan. If fear is rampant and your analysis confirms it’s a good entry point, place your buy order. If greed is off the charts and your stock has hit its price target, it might be time to take some profits off the table without getting swept away by the hype.
A huge mistake I see people make is overreacting to a single day's reading. A one-day blip into "Fear" doesn't mean you should mortgage the house and go all-in. Likewise, a single day of "Greed" isn't a signal to liquidate your entire portfolio. You're looking for sustained periods of extreme emotion—that’s where the more reliable signals lie.
Avoiding Common Pitfalls
The biggest trap you can fall into is relying only on the index. Remember, it’s a sentiment gauge, not a crystal ball or a complete trading system. It’s most powerful when combined with other tools.
To build a truly robust approach, you can dive deeper into our post that serves as a trader's guide to stock market fear and greed.
By treating the index as one valuable piece of your analytical puzzle, you can stop letting market emotions cause anxiety and start using them as a strategic advantage.
Of course. Here is the rewritten section, crafted to sound like it was written by an experienced human expert, following all your specified requirements.
Common Questions About the Fear & Greed Index
As you start working the Fear Greed Index CNN provides into your routine, some practical questions always pop up. Getting a handle on these will help you use this powerful sentiment gauge with more confidence and make it a reliable part of your analysis.
Let's clear up a few of the most common ones.
How Often Is the Index Updated?
This is one of the first things people ask. The CNN Fear & Greed Index updates just once a day, right after the U.S. stock markets close at 4:00 PM ET.
There’s a good reason for that timing. By waiting until the trading day is over, the index can soak up a full day's worth of market action across all seven of its indicators. This gives you a complete, considered snapshot of the day's final sentiment instead of getting jerked around by every little price swing during the day.
Think of it this way: The daily update isn't a live, ticking meter. It’s the market’s final emotional verdict for the day—a summary of where the collective psyche landed after the closing bell.
Can the Index Predict a Market Crash?
Ah, the million-dollar question. The short answer is a hard no. The Fear & Greed Index is a reactive tool, not a crystal ball. It’s brilliant at measuring the current emotional temperature of the market, telling you if investors are feeling skittish or overly bold right now. It doesn't predict the future.
Now, a long stretch of "Extreme Greed" often comes before a market correction, sometimes even a crash. But it doesn't guarantee one. Greed can run wild for weeks or months before the party finally stops. The best way to use the index is to gauge your current risk exposure.
- When Greed is high: It’s a yellow flag. Risk is elevated, and it might be a good time for caution.
- When Fear is high: This suggests a lot of the risk has been squeezed out of the market, and opportunities might be starting to surface.
It's an incredibly powerful barometer of market conditions, but it tells you what is, not what will be.
Are There Indexes for Other Markets?
Yes, definitely. While the fear greed index CNN created is the most famous one and focuses squarely on U.S. stocks, the concept itself is too useful to be contained. Its success has sparked a whole family of similar sentiment indexes for other asset classes.
The most popular offshoot is for the crypto market. It’s a perfect fit. Given crypto’s notorious volatility and wild, emotion-fueled cycles, a Fear & Greed Index is almost essential. These crypto-specific versions use different ingredients—like social media buzz and search trends—to capture the unique emotional drivers of that world. It just goes to show that measuring collective emotion can give you a strategic edge, no matter what you're trading.
Ready to move beyond the daily CNN update? Fear Greed Tracker offers real-time sentiment scores for over 50,000 stocks and cryptocurrencies, powered by a proprietary 16-indicator algorithm. Track market mood as it happens and get instant alerts when sentiment shifts for your favorite assets. Stop guessing and start making data-driven decisions today at https://feargreedtracker.com.