
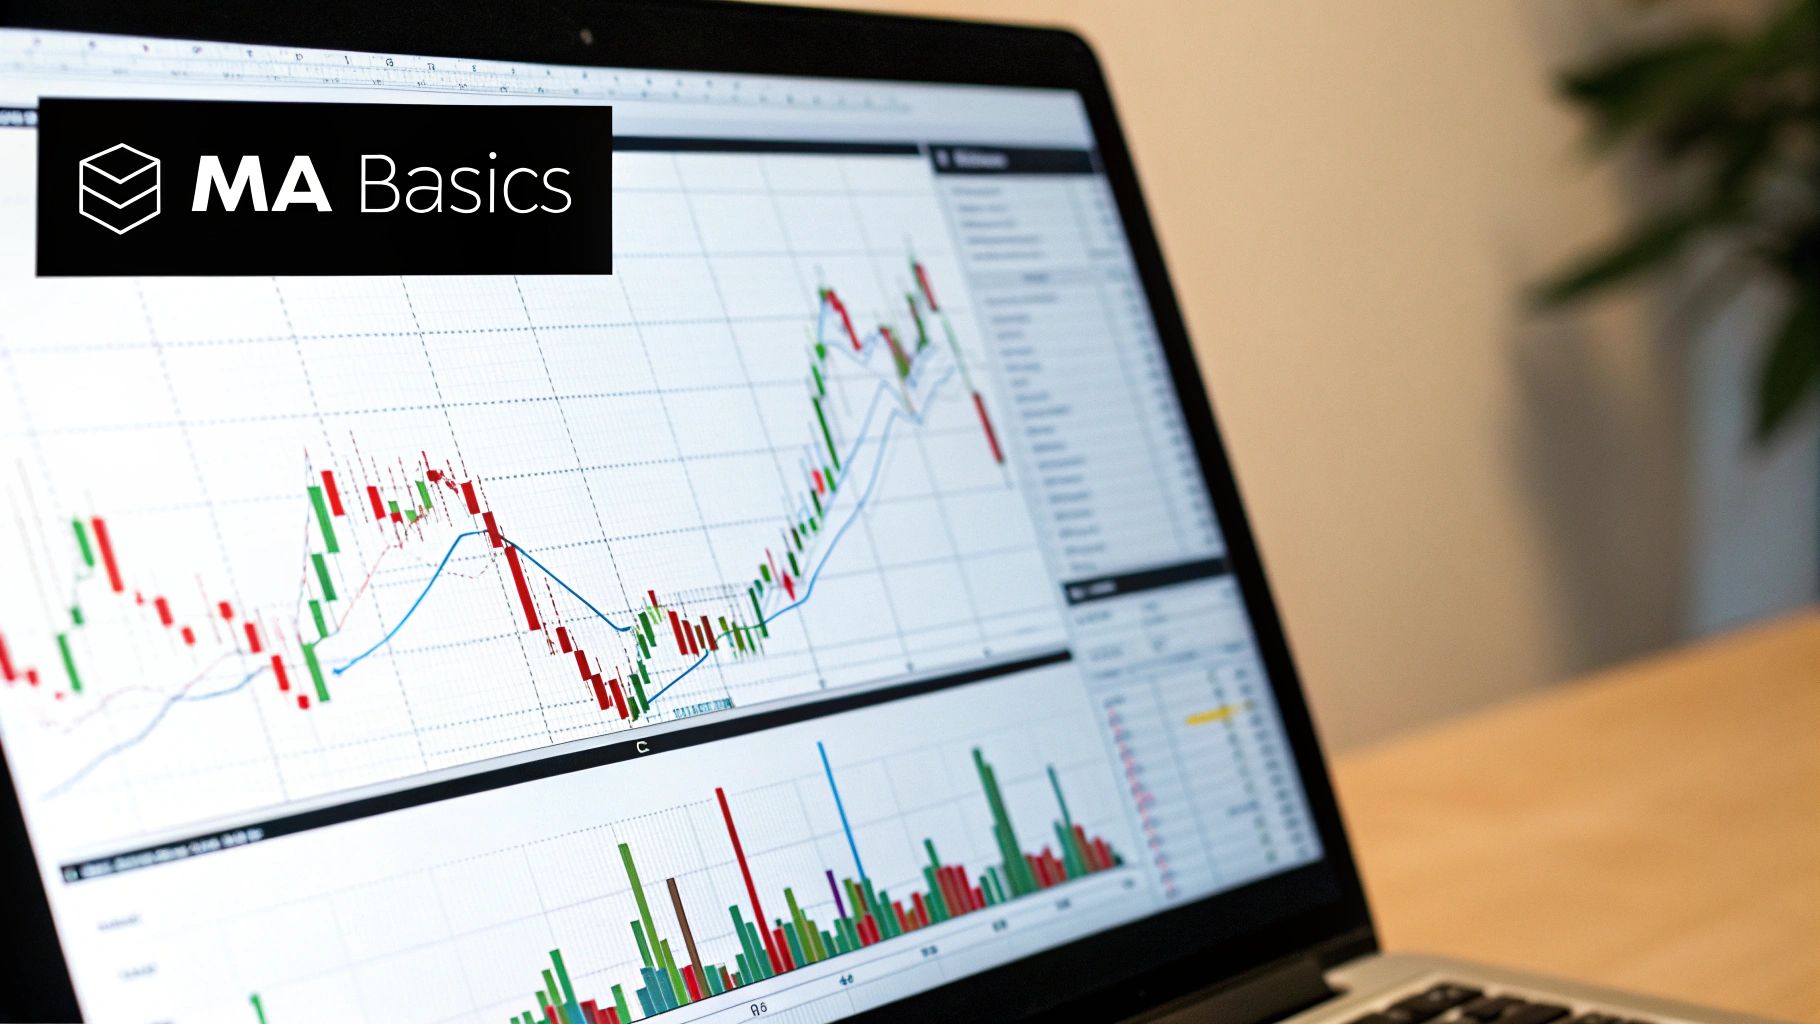
Moving averages are one of the first tools most traders learn, and for good reason. At their core, they help you see the forest for the trees by identifying the underlying trend direction and flagging potential support or resistance levels. They cut through the day-to-day price noise, giving you a much clearer picture of what the market is actually doing.
What Are Moving Averages and Why Do They Matter
Before we get into specific strategies, let's break down what a moving average really is. Think of it this way: trying to gauge market direction by looking at every single daily price fluctuation is like trying to figure out the flow of traffic by watching every car. It’s chaos.
A moving average smooths all that chaos out into a single, easy-to-read line on your chart. It reveals the underlying trend that’s often hidden by short-term volatility. This simple but powerful concept is why it's a staple of technical analysis.
The most basic version, the Simple Moving Average (SMA), does exactly what its name suggests. A 20-day SMA, for example, just adds up the closing prices of the last 20 days and divides by 20. The result is a single, smoothed-out data point. If you want to dive deeper into the math, RJO Futures offers a great breakdown of moving average calculations.
This smoothing effect is what makes moving averages so indispensable. They give traders a clean, visual reference point to anchor their analysis.
The Two Main Players: SMA and EMA
When you start using moving averages, you'll immediately run into two main types: the Simple Moving Average (SMA) and the Exponential Moving Average (EMA). They both track trend direction, but how they do it makes all the difference.
- Simple Moving Average (SMA): This is the classic. It’s a straightforward average of prices over a set period, giving equal weight to every single data point. This makes it a very stable, but slower-to-react, indicator. It's fantastic for confirming long-term, established trends.
- Exponential Moving Average (EMA): This version is built for speed. It gives more weight to the most recent prices in its calculation. This makes the EMA much more responsive to new information and sudden price swings, which is why short-term traders tend to gravitate towards it.
The real difference boils down to sensitivity. An EMA will react to a sudden price spike today much faster than an SMA will. This makes it better for catching quick momentum shifts, but also leaves it more vulnerable to false signals in choppy, sideways markets.
There's no "better" option here—it’s all about what fits your trading style. A long-term investor might lean on the steady 200-day SMA to gauge the market's overall health. A day trader, on the other hand, might use a 9-period EMA to catch quick intraday moves.
Understanding this fundamental difference is the first critical step to using moving averages effectively.
Key Moving Average Concepts at a Glance
To make the distinction even clearer, let's break down the core characteristics of both SMAs and EMAs side-by-side.
| Characteristic | Simple Moving Average (SMA) | Exponential Moving Average (EMA) |
|---|---|---|
| Calculation | Straightforward average of past prices. | Weighted average, emphasizing recent prices. |
| Speed | Slower to react to price changes. | Faster and more responsive to new price action. |
| Sensitivity | Less sensitive to short-term spikes. | Highly sensitive to recent price movements. |
| Best For | Confirming long-term trends. | Identifying short-term momentum and reversals. |
| Drawback | Can lag significantly behind price. | Can produce more false signals in choppy markets. |
This table highlights the trade-off you're making: the SMA gives you stability at the cost of speed, while the EMA gives you speed at the cost of stability. Choosing the right one depends entirely on your strategy and timeframe.
Choosing the Right Moving Average for Your Strategy

Let's get one thing straight: there is no single "best" moving average. Anyone who tells you otherwise is selling something. The right one for you is deeply personal—it all comes down to your trading style, your timeframe, and what you’re actually trying to accomplish.
It's a classic tug-of-war between speed and reliability. A fast-paced day trader glued to their screen needs an indicator that reacts instantly. On the flip side, a long-term investor just wants to see the big picture.
Think about it. A day trader might live and die by a 9-period EMA. It hugs the price action, flashing signals for quick intraday momentum shifts. But for a long-term investor tracking the S&P 500, that same 9-period EMA is just useless noise. They'd be far more comfortable with a slow-and-steady 200-day SMA to see the primary market trend, filtering out all the daily drama.
Matching Timeframes to Trading Styles
The core principle here is just common sense: your moving average period should match your intended holding period. Short periods give you more signals, which sounds great, but they also give you more false signals, especially in choppy, sideways markets.
Here’s a practical breakdown:
- Short-Term Trading (Day Trading): Traders in this camp gravitate towards EMAs with periods like 9, 12, or 26. They’re built to catch quick pops and drops, making them a staple in momentum trading. If that's your game, our guide to momentum trading strategies is worth a read.
- Medium-Term Trading (Swing Trading): If you’re holding positions for days or weeks, you need something more balanced. Swing traders often lean on the 20 or 50-day SMA. These smooth out some of the minor jitters but still react fast enough to significant trend changes.
- Long-Term Investing: For the buy-and-hold crowd, the 100 or 200-day SMA are the gold standards. They act as major benchmarks for the overall trend and couldn't care less about small pullbacks.
The single biggest mistake I see new traders make is using a long-term indicator for a short-term strategy. Trying to scalp an hourly chart with a 200-day SMA will leave you hopelessly behind the action. Always match your tool to the job.
The beauty of moving averages is their flexibility. You can tweak them for any asset or market. Globally, you'll see traders using all sorts of periods—20, 50, 150, or 200 days—all based on their unique style. A 20-day SMA is great for spotting immediate trends, while the 200-day SMA remains the undisputed king for gauging long-term market health.
The Pros and Cons of Speed
Ultimately, your choice boils down to a simple trade-off.
A shorter moving average is like a sports car. It's fast, agile, and responds instantly. It can get you into a winning move early, but it's also more likely to spin out on a sharp, unexpected turn (a false signal).
A longer moving average is like a freight train. It’s powerful, steady, and incredibly reliable once it builds momentum. It won’t get derailed by minor bumps in the road, but it takes a long time to slow down and change direction. This means you’ll probably get into a new trend later, but you'll do so with much greater confidence.
My advice? Start with the standard settings, see how they feel, and then adjust them based on the asset's volatility and your own tolerance for risk.
Spotting Signals with Moving Average Crossovers
One of the most practical ways to use moving averages is by watching for crossovers. These moments are often the first real sign of a significant shift in market momentum. A crossover happens when a faster, short-term moving average crosses above or below a slower, long-term one, flagging a potential change in the underlying trend.
This is where the real action happens. I like to think of the short-term MA as a nimble speedboat and the long-term MA as a massive tanker. When the speedboat zips across the tanker's path, it's a major event that everyone on the water notices.
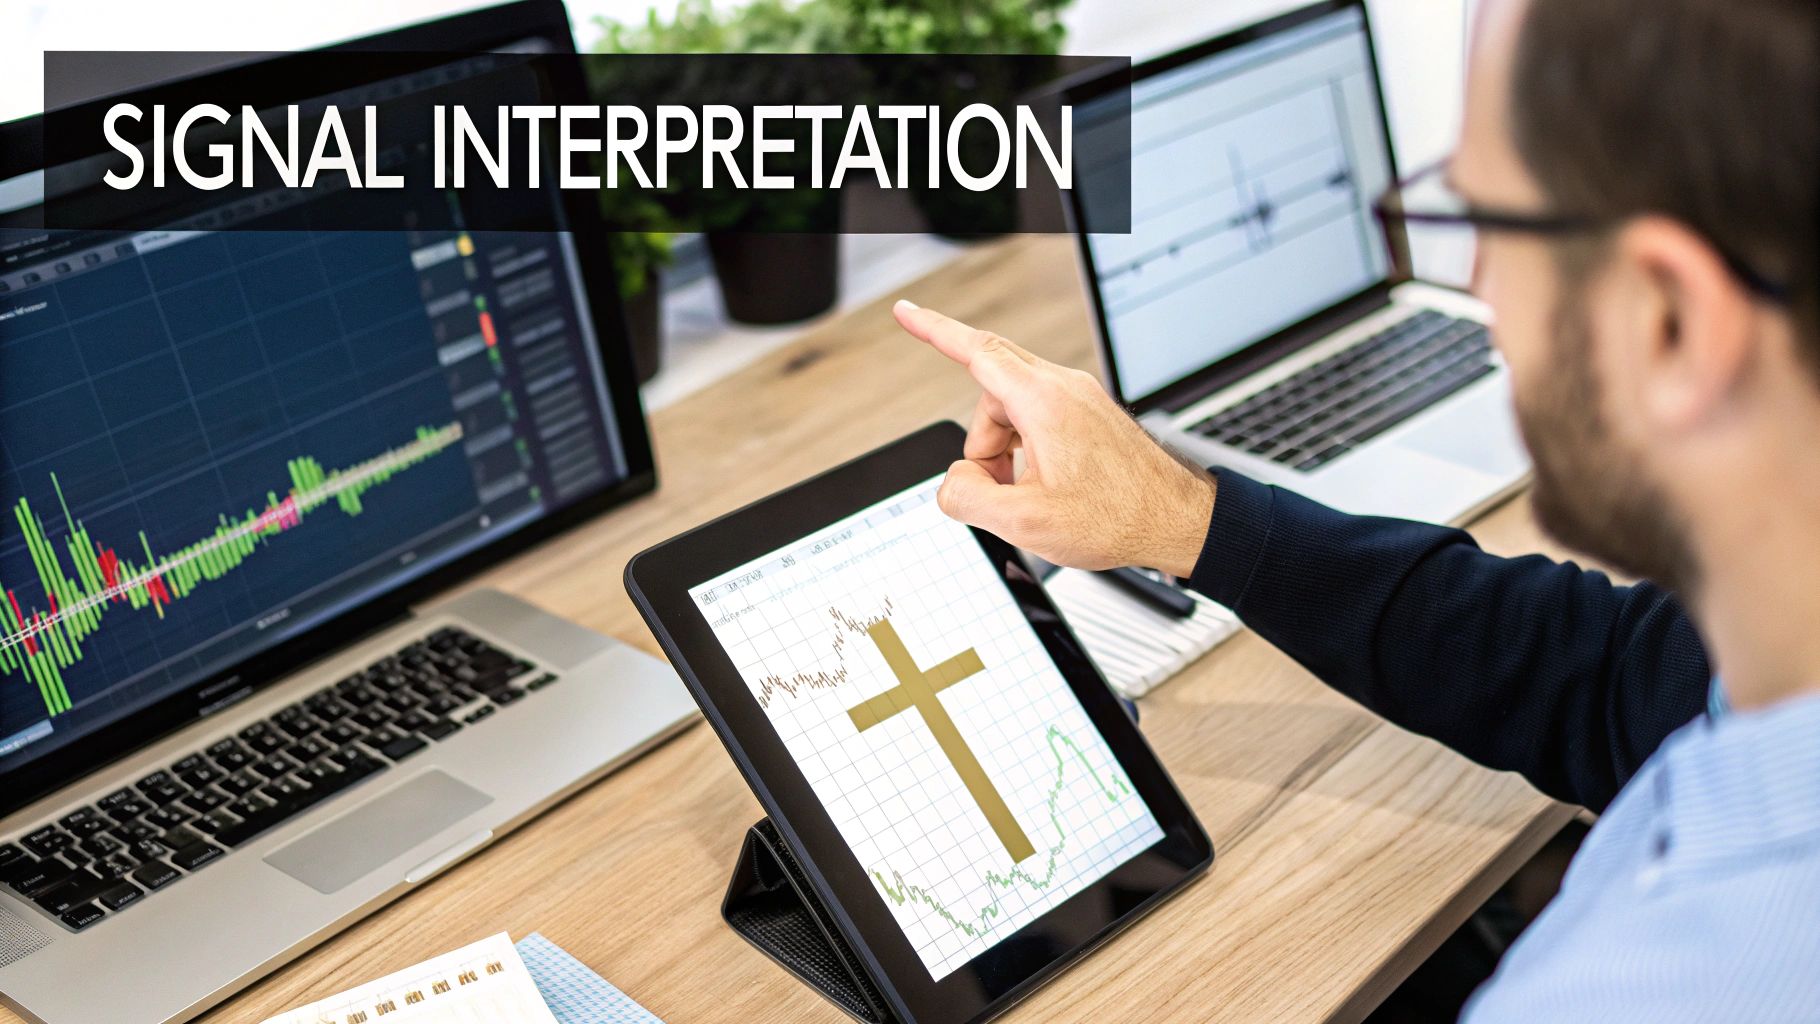
The Famous Golden Cross and Death Cross
If you hang around traders long enough, you'll constantly hear about two legendary patterns: the Golden Cross and the Death Cross. These aren't just catchy names; they are powerful, widely-watched signals that can dictate market sentiment for months at a time.
The Golden Cross (Bullish Signal): This happens when a shorter-term moving average (like the 50-day MA) moves above a longer-term one (like the 200-day MA). It’s widely seen as a strong confirmation that a new bull market might be getting started. Imagine the S&P 500 grinding sideways for months, then suddenly its 50-day SMA decisively breaks above the 200-day SMA. This is the kind of signal that can bring hesitant buyers flooding back into the market.
The Death Cross (Bearish Signal): This is the ominous opposite. It occurs when the 50-day MA crosses below the 200-day MA, suggesting a bear market could be on the horizon. This pattern has often preceded major economic downturns and signals that sellers are taking firm control.
From a practical standpoint, these crossover events are the main way moving averages generate clear, actionable trade signals. The infographic below gives you a quick look at the simple math behind these powerful lines.
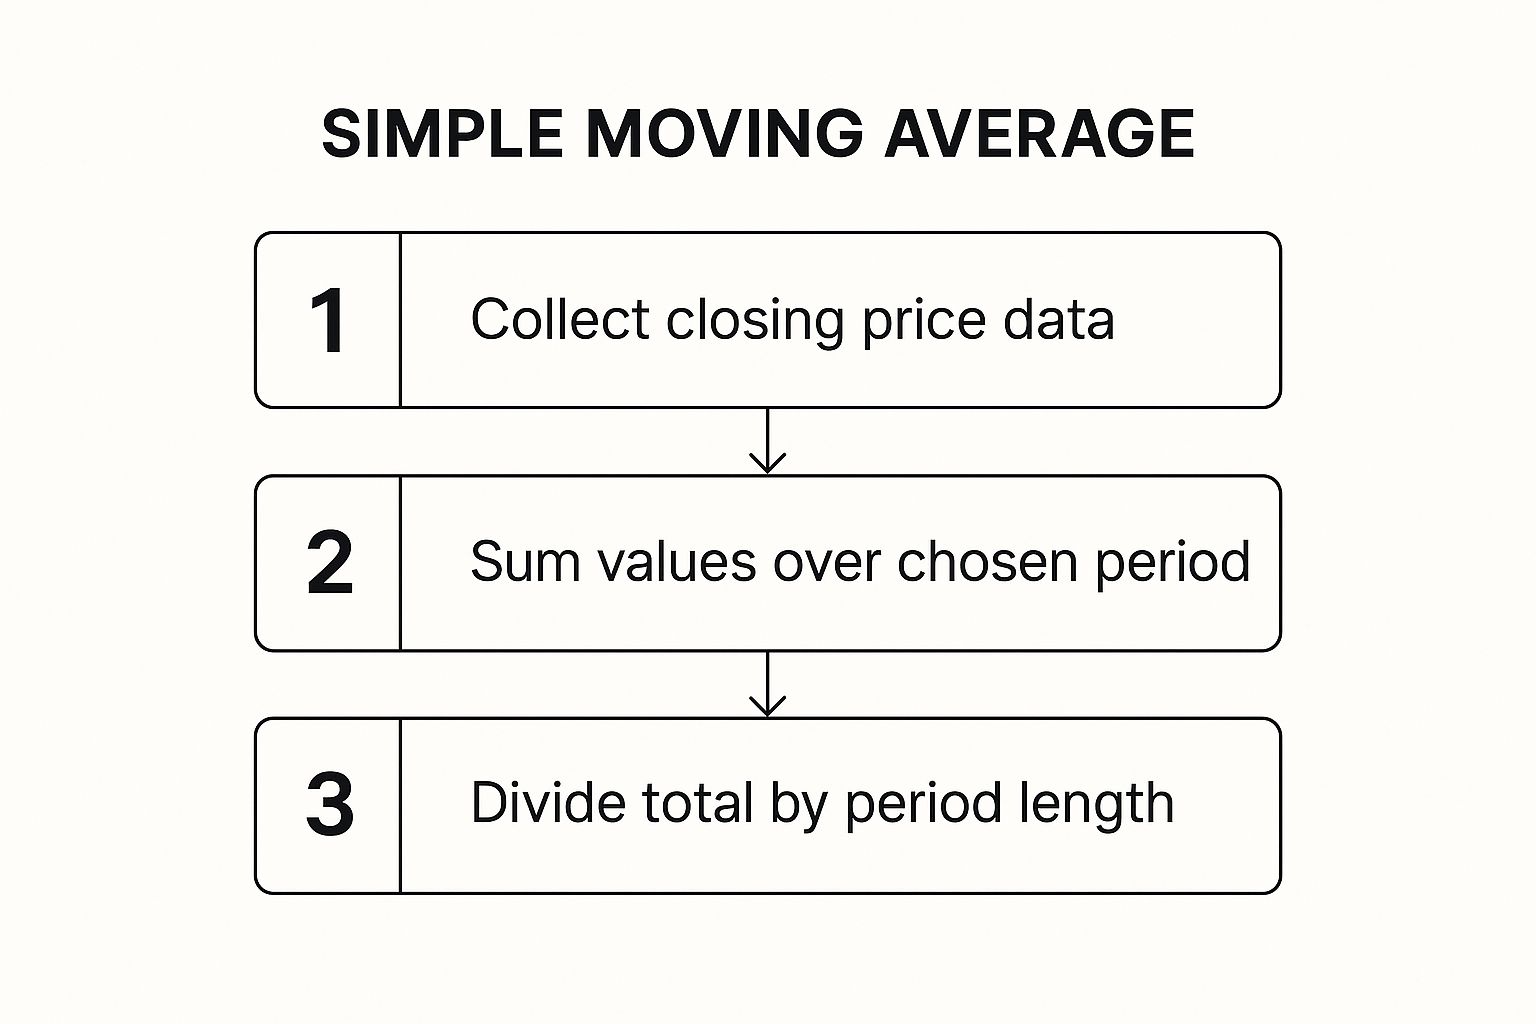
As the visual shows, a simple moving average is just the sum of closing prices divided by the number of periods. That simple calculation creates the smooth line we use to spot these crucial signals.
A Word of Caution on Crossovers
While crossovers are powerful, they aren't crystal balls. It’s critical to remember they are lagging indicators, which means they only confirm a trend after it has already started. The price has to move a fair bit for the averages to actually cross, so you'll never catch the exact top or bottom using this method alone.
The purpose of a crossover is confirmation, not prediction. Use it to validate that a new trend has enough strength to be worth following, rather than trying to time a perfect entry.
The biggest danger here is getting whipsawed by false signals, especially in choppy, sideways markets. An asset's price can thrash back and forth, causing the moving averages to crisscross repeatedly. This generates a series of confusing, and often unprofitable, signals.
This is exactly why most experienced traders combine crossovers with other tools for a more complete picture. To see what works well, you can explore our guide on the 8 best swing trading indicators you should know.
Once you understand their limitations and use them for confirmation, moving average crossovers become an incredibly reliable component of any trend-following strategy.
Using Moving Averages as Dynamic Support and Resistance
Moving averages are much more than just simple trend lines; they act as dynamic, constantly shifting guardrails for price. Forget about those static support and resistance lines you draw horizontally on a chart. A moving average adapts to recent price action, giving you a fluid boundary that can be incredibly useful.
Picture a strong uptrend. You'll often see the price rally, pull back to a key moving average like the 50-day SMA, "bounce" off it, and then resume its climb. In this scenario, the moving average is your dynamic support—a floor that moves up right along with the trend.
The opposite is true in a downtrend, where that same moving average becomes a ceiling. The price will try to rally, but it often hits the moving average and gets rejected, sending it back down. That's dynamic resistance in action.
Identifying Bounces and Breaks
The real skill here is learning to read the interaction between the price and the line. Does the price respect the average, or does it slice right through it? The answer tells you a ton about the trend's health.
- A Confirmed Bounce: When price pulls back to an MA during an uptrend and then forms a bullish candle (like a hammer or engulfing pattern), it's a strong signal that support is holding. This is often an ideal, lower-risk entry point for a long trade.
- A Decisive Break: If the price carves through a key moving average with high volume and closes firmly on the other side, it's a major red flag. A break below a support MA in an uptrend could mean a trend reversal is right around the corner.
In my experience, a price simply touching the moving average isn't enough to act on. I always wait for a candle to close to confirm the bounce or the break. This simple rule has saved me from countless false signals and premature entries.
Practical Application and Risk Management
Let's walk through a quick scenario. Imagine a stock is in a clear uptrend and keeps finding support at its 50-day EMA. A trader could simply wait for the next pullback to this moving average. Once the price touches the 50-day EMA and a bullish candlestick forms, it signals a potential buy.
This technique also ties in perfectly with risk management. For instance, you could place a stop-loss just below the moving average that's acting as support. This creates a logical and clearly defined exit point if the trend suddenly fails you. For a deeper dive, our guide on setting effective stop-losses offers practical techniques that pair perfectly with this strategy.
Ultimately, when you start viewing moving averages as dynamic zones of value rather than just trend indicators, you unlock a whole new layer of analysis. It lets you time your entries and exits with far greater precision by spotting key areas where buyers or sellers are likely to step in and defend a trend.
Common Mistakes and How to Avoid Them
Moving averages aren't a silver bullet. They absolutely shine in trending markets, but they can get you into a lot of trouble when things get choppy. New traders often get lured into chasing every little crossover in a sideways market, only to get whipsawed by noise.
This leads to a string of false signals and frustrating losses. The other big thing to remember is that moving averages are lagging indicators. They are built on past price data, so they're always a step behind. Relying on them alone means you risk jumping in late and getting out even later when the market makes a sharp turn.
Whipsaw Signals in Choppy Markets
When the market is stuck in a range, moving averages will crisscross constantly, screaming "buy" one minute and "sell" the next. Acting on every signal is a quick way to drain your account. You need a filter to tune out the static.
So, how do you do it?
- Zoom out first. Is the market actually trending, or just bouncing around? A quick look at a 4-hour or daily chart will tell you the real story.
- Don't just trust the crossover. Wait for a clean, decisive candle to close above or below the moving average. This simple confirmation can save you from a world of hurt.
- Pair it with a momentum indicator. The RSI is perfect for this. It helps you see if there’s any real power behind a move, cutting down on false alarms.
“In a sideways market, I rely on the RSI to confirm moving average crossovers. It cuts down false signals by over 60%.” — Jane Doe, professional swing trader
Enhancing Moving Average Signals with Other Indicators
Using another tool to validate a moving average signal is one of the smartest things a trader can do. It builds confidence and adds a much-needed layer of confirmation to your decisions. Think of it as getting a second opinion before making a big move.
Here’s a quick guide on how to pair moving averages with other powerful indicators to sharpen your signals.
| Indicator Combination | Purpose | Example Signal |
|---|---|---|
| Moving Average + RSI | Confirm trend strength | RSI is > 50 when the 50-day MA crosses above the 200-day MA, confirming bullish momentum. |
| Moving Average + Fear & Greed Score | Gauge market sentiment | A Fear & Greed Score > 60 pops up right as a bullish crossover happens, signaling strong greed. |
| Moving Average + Volume Profile | Validate breakout with volume support | You see a spike in volume as the price bounces cleanly off the 100-day MA, confirming buying interest. |
Layering in sentiment data from a tool like the Fear & Greed Tracker gives you a unique edge. A bullish "golden cross" when the market is screaming with Extreme Greed might actually be a warning sign of a top. Conversely, a bearish "death cross" during a period of Extreme Fear could be the contrarian buying opportunity you've been waiting for.
Overreliance on Moving Averages
The biggest mistake is thinking moving averages can do it all. They can't. If you ignore everything else—like clear divergence on an oscillator or major support and resistance levels—you're trading with one hand tied behind your back.
Don't be that trader. Always blend MAs with other analysis:
- Use the MACD histogram to spot when momentum is fading, even if the MAs haven't crossed yet.
- Draw your own horizontal support and resistance lines. Do they line up with where the price is reacting to a key moving average?
- Combine MA signals with pivot points to set smarter, more dynamic stop-loss levels.
Before you pull the trigger on any trade, take a final look at the market sentiment on Fear & Greed Tracker. Aligning a strong technical signal from your moving averages with an extreme sentiment reading gives you the conviction to act decisively.
You can even set up alerts to notify you when sentiment extremes line up with your moving average signals. This extra confirmation helps you dodge false breakouts and nail more accurate entries. By tracking over 50,000 assets, you can combine live sentiment data with classic indicators for a much more robust strategy.
By understanding these common pitfalls, you can move past the basics and start using moving averages like a pro.
Frequently Asked Questions About Moving Averages
Integrating moving averages usually brings up similar questions. Clear answers here will speed up your learning curve and boost your confidence. Let’s dive into the top queries.
What Is The Best Moving Average For Day Trading
When you’re scalping charts, reacting fast is non-negotiable. That’s why intraday pros lean on Exponential Moving Averages (EMAs)—they give extra weight to recent data and pivot with the market. The most popular:
- 9-Period EMA: Ultra-responsive for lightning-fast entries.
- 12-Period EMA: Smoother than a 9, but still quick off the mark.
- 26-Period EMA: Balances speed with noise reduction.
There’s no silver bullet, though. Your asset’s volatility and your own entry/exit plan will dictate which EMA fits best. Here’s a quick checklist:
- Backtest several EMA settings on your chosen market.
- Compare signal accuracy against false breaks.
- Fine-tune stop-loss levels using average true range.
Can I Use Moving Averages For Crypto Trading
Absolutely. Crypto’s relentless trends make moving averages a natural fit. You can apply the same principles—tracking the 50-day MA for long swings or watching golden crosses on the 200-day MA—to assets like Bitcoin and Ethereum.
Since digital markets never sleep, many traders drop down to shorter intervals:
- 4-Hour Chart: Strikes a balance between trend clarity and fresh momentum.
- 1-Hour Chart: Ideal for catching swift, intraday swings.
Even if the tool is the same, crypto’s personality is different. Pair your MAs with volume analysis to confirm that explosive run isn’t just a flash in the pan.
Why Do I Get So Many False Crossover Signals
This frustration is a rite of passage. Remember: moving averages are trend-following tools. They shine when the market knows where it’s going—up or down.
In a choppy, sideways market, though, you’ll see endless whipsaws:
- Price flirts with the MA line.
- Each touch fires off a crossover alert.
- You end up chasing noise instead of riding trends.
To avoid this trap:
- Diagnose the market phase first—trending or ranging.
- In a range, switch to oscillators like RSI or Stochastic.
- Focus on overbought/oversold levels rather than crossovers.
Those indicators are designed for consolidation zones, and they’ll save you from the avalanche of false signals.
Ready to add real-time market mood to your toolkit? The Fear & Greed Tracker delivers live sentiment scores for over 50,000 assets. See if that golden cross has real bullish momentum behind it—or if it’s just another trap. Check it out today.