
Trying to figure out how to analyze a crypto project can feel like you've been dropped into a foreign country without a map. There are thousands of coins, the market never sleeps, and everyone seems to be shouting different advice. It’s overwhelming.
But here’s the good news: a solid analysis boils down to just three core pillars. Think of them as different lenses you can use to examine any potential investment. Each one gives you a unique and crucial piece of the puzzle.
Relying on just one approach is a classic rookie mistake, and it can leave you dangerously exposed. You might find a project with an incredible idea (strong fundamentals), but it could still be a terrible investment if everyone is panic-selling (bad sentiment) or the price chart is in a nosedive (weak technicals).
Your Crypto Analysis Toolkit: The Three Pillars
A balanced perspective is your single greatest asset in this market. By pulling insights from all three areas, you build a much clearer, more reliable picture of a crypto's true potential.
Here’s a quick rundown of what each pillar is all about:
Fundamental Analysis: This is all about digging into a project's intrinsic value. Is it actually useful? You'll look at its technology, the problem it solves, the team behind it, and its tokenomics—the economic model of its coin.
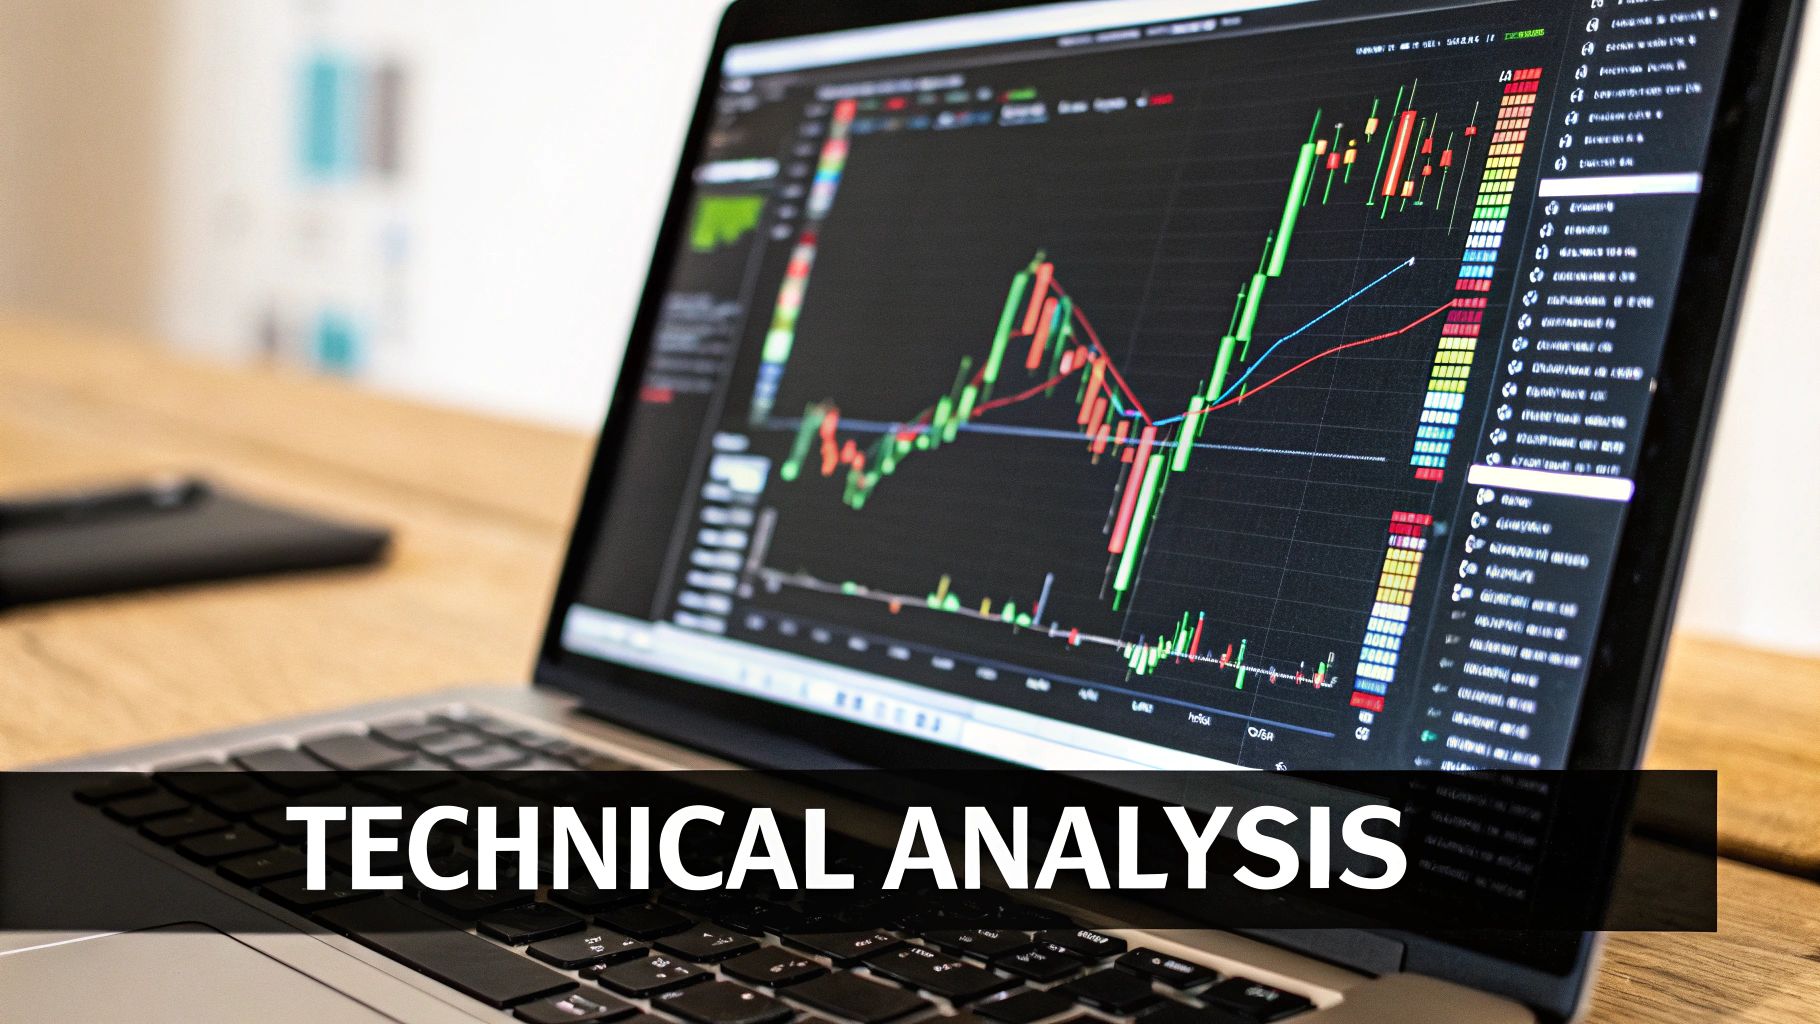
Technical Analysis: This is the art and science of reading the charts. By studying historical price action and trading volume, you can spot trends, identify patterns, and find strategic entry or exit points.
Sentiment Analysis: This one is all about the market's mood. Is the crowd feeling greedy and euphoric, or are they fearful and pessimistic? Gauging this "vibe" often gives you powerful clues about where the price might be heading next.
Before we dive deeper, it's helpful to see how these three methods stack up against each other. Each one answers a different, vital question for you as an investor.
The Three Pillars of Crypto Analysis
| Analysis Type | What It Measures | Key Question It Answers |
|---|---|---|
| Fundamental | A project's intrinsic value, utility, and long-term viability. | "Is this project built to last and create real value?" |
| Technical | Historical price movements, volume, and chart patterns. | "Where has the price been, and where might it go next?" |
| Sentiment | The collective emotion and mood of the market participants. | "Are investors feeling fearful or greedy right now?" |
Understanding how to blend these three is what separates guessing from investing.
The bigger picture is that crypto isn't just a niche hobby anymore. The global cryptocurrency market was valued at USD 5.70 billion and is projected to hit USD 11.71 billion by 2030, a surge driven by real-world adoption.
Once you start putting your money to work, staying organized is non-negotiable. To help with that, check out our guide on the best crypto portfolio tracker tools to keep all your assets in one place.
Evaluating a Project’s Long-Term Potential
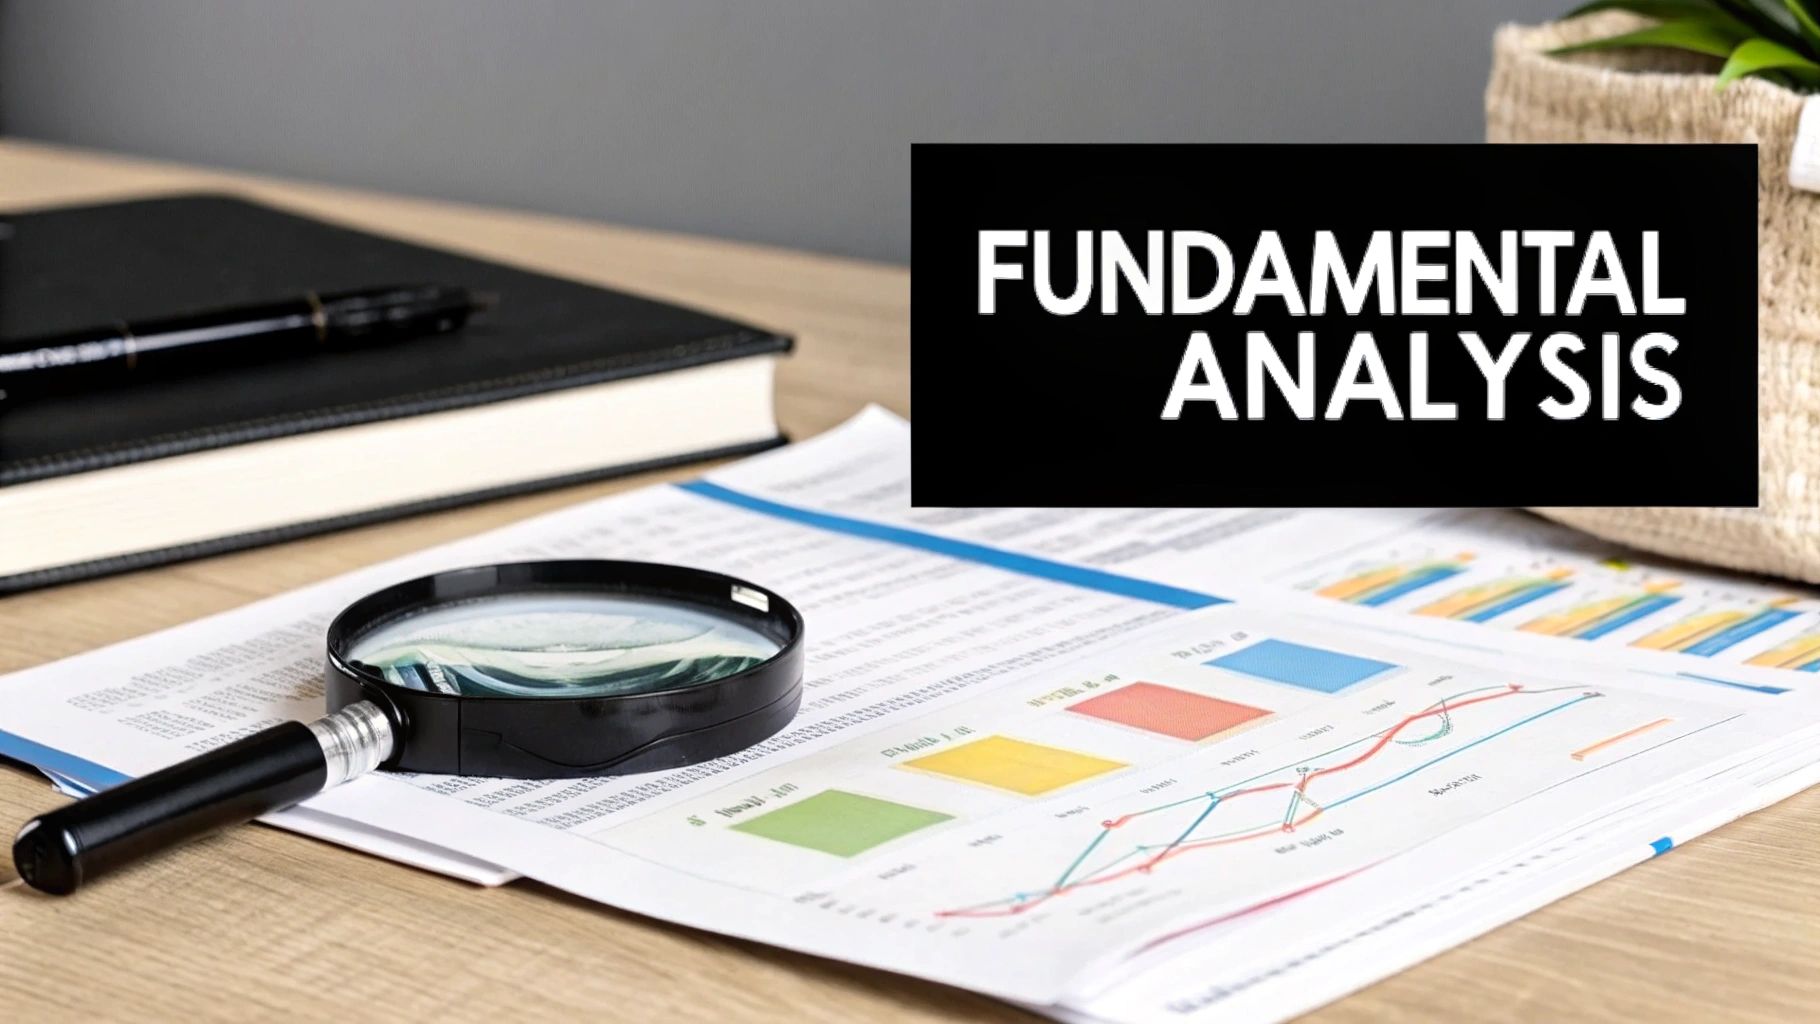
Price charts tell you what’s happening right now. But to figure out if a project has any real staying power, you have to go deeper. This is where fundamental analysis comes in.
Think of yourself as a detective. You’re moving past the hype and the flashy marketing to see if there’s any actual substance. Is this project solving a real-world problem, or is it just another pretty website with a celebrity endorsement?
Deconstructing the Whitepaper
Every crypto project starts with a whitepaper. It’s supposed to be the blueprint, explaining the tech, the mission, and the grand vision. The problem? Most are crammed with jargon designed to sound impressive, not to be understood.
Your job is to cut through the fluff. Don't get bogged down trying to decipher complex formulas. Instead, just try to answer a few simple questions:
- What problem are they actually solving? If you can't explain it in a sentence, that's a bad sign.
- Does this really need a blockchain? So many projects use crypto as a fundraising gimmick when a simple database would do the job better.
- Who is this for? A project with a clearly defined user base shows the team has actually thought about who will use their product.
If you can’t find clear, straightforward answers, that’s a massive red flag. A solid project shouldn't need a PhD to explain its purpose.
Investigating the Team and Community
An incredible idea is completely worthless if the team can't build it. Start digging into the founders and developers. A quick LinkedIn search is your best friend here. Do they have any real experience in tech, finance, or building a business?
Pro Tip: I always look for teams that have shipped products before, even if it wasn't in crypto. Execution is everything. A history of actually building and launching something shows they can deliver on their promises.
But it’s not just about the core team. A project is nothing without its community. Check out their Discord, Telegram, and GitHub. A healthy project has people who are genuinely engaged, developers actively contributing code, and a team that communicates openly. Dead silence is never a good sign.
Understanding Tokenomics: The Economics of a Coin
Tokenomics is just a fancy word for the economics of a coin—how it’s made, who gets it, and what you can do with it. This might be the single most important part of your analysis. A project can have the best tech in the world, but if its tokenomics are garbage, it’s doomed.
Here’s what to look for:
- Total Supply: Is there a hard cap, like Bitcoin’s 21 million coins, or can they print it forever? Scarcity is a powerful driver of value.
- Distribution: How were the coins given out at the start? If the team and their private investors are sitting on a massive pile, they could easily dump on the market later and crash the price.
- Utility: What’s the point of the token? Does it let you vote, pay for fees, or access a service? A token with a real use case has built-in demand.
Diving this deep is critical because the crypto market is incredibly top-heavy. Bitcoin and Ethereum alone make up nearly 75% of the entire market cap. This winner-take-all environment means only projects with rock-solid foundations have a chance to stick around. You can see more on these trends in the latest global crypto adoption report from Chainalysis.
Gauging the Market’s Emotional Temperature
Once you've sized up a project's long-term potential, it's time to check the market's heartbeat. Crypto is a market driven by pure emotion, swinging wildly between euphoria and flat-out despair. This is where sentiment analysis comes in—it’s your tool for measuring that collective mood, giving you an edge that charts and whitepapers just can't provide.
This kind of analysis goes beyond the cold, hard numbers. It’s all about answering one simple question: is the crowd feeling greedy or fearful right now? Knowing the answer can be a powerful contrarian signal, helping you spot opportunities everyone else is too emotional to see.
Reading the Digital Tea Leaves
The best place to get a read on the market's pulse is where the conversation is happening—online. Platforms like X (formerly Twitter), Reddit, and Telegram are constantly buzzing with gut reactions to news, price swings, and project updates.
Of course, trying to track all of that manually is impossible. Instead, you can look for key trends:
- Social Mentions: Are people talking more or less about a specific coin? A sudden spike in chatter can signal that interest is heating up.
- Keyword Tone: Is the language positive and hyped, or is it filled with fear, uncertainty, and doubt (FUD)?
- News Cycles: Big positive news can fuel a rally, while scary headlines can trigger a sell-off. The key is to watch how the market reacts to the news, not just the news itself.
Learning to filter the signal from the noise turns raw public opinion into a valuable dataset. The goal isn't to just follow the herd, but to understand which way it's stampeding and anticipate its next move.
Using the Fear & Greed Index as Your Compass
One of the most powerful tools for this is the Crypto Fear & Greed Index. It boils down multiple data points—like market volatility, social media trends, and trading volume—into a single, easy-to-read score from 0 (Extreme Fear) to 100 (Extreme Greed).
For example, the screenshot above shows a neutral reading. That suggests the market is in a state of indecision—neither extreme fear nor greed is calling the shots, which could point to a period of consolidation.
The index is at its best when you use it as a contrarian tool. The logic, famously put by Warren Buffett, is to be "fearful when others are greedy and greedy when others are fearful."
- Extreme Fear (0-24): This often means investors are way too worried. Historically, these moments have been prime buying opportunities for anyone with a long-term view.
- Extreme Greed (75-100): This suggests the market is getting way ahead of itself and a correction might be on the horizon. It could be a signal to think about taking some profits or just waiting for a better entry point.
Getting comfortable with this data is a huge part of learning how to analyze crypto effectively. If you want to go deeper, our guide on the Crypto Fear & Greed Index explained gives you a complete breakdown of how it’s calculated and how to fit it into your own strategy. When you blend this emotional insight with your fundamental research, you get a much more complete picture of any asset.
Using Charts to Time Your Moves
After you’ve dug into a project’s fundamentals and taken the market’s emotional temperature, the final piece of the puzzle is timing. This is where technical analysis comes into play. It’s all about using price charts and historical trading data to get a feel for future moves, helping you decide when to pull the trigger on a buy or sell.
You don't need some high-tech Wall Street setup to get going. The core idea is pretty simple: market prices tend to move in recognizable patterns and trends, all driven by the collective psychology of buyers and sellers. Learning to spot these patterns helps you make strategic decisions instead of just taking a wild guess.
Getting Started with Candlestick Charts
First things first, you need to learn how to read a basic candlestick chart. Think of each "candle" as a quick story of what the price did over a specific time—whether that’s a minute, an hour, or a full day.
Here's what each part of a candle tells you:
- The Body: This shows you the price range between where the asset opened and where it closed for that period.
- The Color: A green body means the price closed higher than it opened (a good day for bulls). A red body means it closed lower (a win for the bears).
- The Wicks: Those thin lines sticking out of the top and bottom show the absolute highest and lowest prices hit during that same period.
When you look at a series of these candles together, you start to see the bigger picture—the constant tug-of-war between buyers pushing the price up and sellers dragging it down. For a deeper dive, our guide on how to read crypto charts is a fantastic place to build your confidence.
Spotting Trends with Moving Averages
One of the most useful tools for any trader, especially when you're starting out, is the Moving Average (MA). An MA essentially smooths out the chaotic, day-to-day price swings to give you a much clearer view of the underlying trend. It does this by calculating the average price over a set number of periods, like the last 50 days or 200 days.
For example, if the current price is trading above its 50-day moving average, it's generally considered to be in an uptrend. If it dips below, that could be a signal that a downtrend is taking over.
Many traders keep an eye out for a "golden cross," which happens when a shorter-term MA (like the 50-day) crosses above a longer-term MA (like the 200-day). This is often seen as a powerful bullish signal.
Measuring Market Momentum with the RSI
While moving averages help you see the trend’s direction, the Relative Strength Index (RSI) helps you measure the steam behind it. The RSI is what’s known as an oscillator, and it moves on a scale between 0 and 100. Its job is to tell you if an asset is potentially overbought or oversold.
A common rule of thumb is that an RSI reading above 70 suggests an asset might be overbought and due for a price correction. On the flip side, a reading below 30 suggests it could be oversold and undervalued—potentially signaling a good time to buy.
Let’s put it all together. Imagine you’ve done your fundamental research on a solid project and you believe in its long-term potential. Then, during a market-wide panic, you see its RSI dip below 30. This technical signal, combined with your fundamental analysis, could give you the confidence to buy when everyone else is fearful.
This is exactly how you start combining different types of analysis to build a complete, well-rounded investment thesis.
Building Your Crypto Analysis Framework
Knowing the different types of analysis is one thing, but actually turning that knowledge into a repeatable process is what separates guessing from investing. Information without a framework is just noise. This is where you put all the pieces together to form a solid investment thesis before you risk a single dollar.
Let's walk through a real-world scenario to see how this works. Imagine you’ve stumbled upon a promising new project—we'll call it "Project X"—and you're trying to figure out if it's worth your money. Instead of just aping in on a whim, you'll apply a structured, three-lens approach. This method is all about moving from a pile of scattered data to a confident, well-reasoned decision.
Starting with the Foundation: Is This Thing Legit?
First things first: fundamental analysis. Forget the price chart for a minute and focus entirely on the project's core value. This is where you ask the tough questions.
Does Project X have a legitimate team with a proven track record, or is it a bunch of anonymous devs? Is their whitepaper clear, and does it solve a real-world problem that actually needs a blockchain?
Next, you have to scrutinize its tokenomics. What’s the total supply of the token? How was it distributed—did the team and early investors get a massive slice that they could dump on the market later? A project with a solid use case and fair token distribution has a much better shot at long-term survival.
By grounding your analysis in fundamentals, you're investing in potential value, not just chasing speculative hype. A strong foundation stops you from getting shaken out by every little bit of market noise.
Tuning into Market Sentiment: What's the Vibe?
Once you've confirmed Project X has solid ground to stand on, it’s time to gauge the market’s emotional state. Check out social media channels like X and Reddit to see what the community is really saying. Is the conversation genuinely enthusiastic about the tech, or is it just an echo chamber of "wen Lambo" posts?
This is also the perfect time to consult the Crypto Fear & Greed Index. If the index is screaming "Extreme Greed," it might mean the market is overheated. That could be a risky time to buy, even if the fundamentals for Project X look great.
On the flip side, if the index signals "Extreme Fear" but your fundamental research still holds up, you might have just stumbled upon a fantastic buying opportunity.
Pinpointing Your Entry and Exit: Time for the Charts
Finally, with your fundamental and sentiment checks complete, you can turn to technical analysis. This is all about timing your entry and exit points. Is the price of Project X currently bouncing off a key support level, or is it wildly overextended after a massive pump?
Look at indicators like the RSI. If it's hovering above 70, the asset is likely overbought, and being patient for a pullback might be the smart play. If you see the price is trading above its 50-day moving average, that can help confirm an uptrend, adding another layer of confidence to your decision. This final step is about strategy, not guesswork.
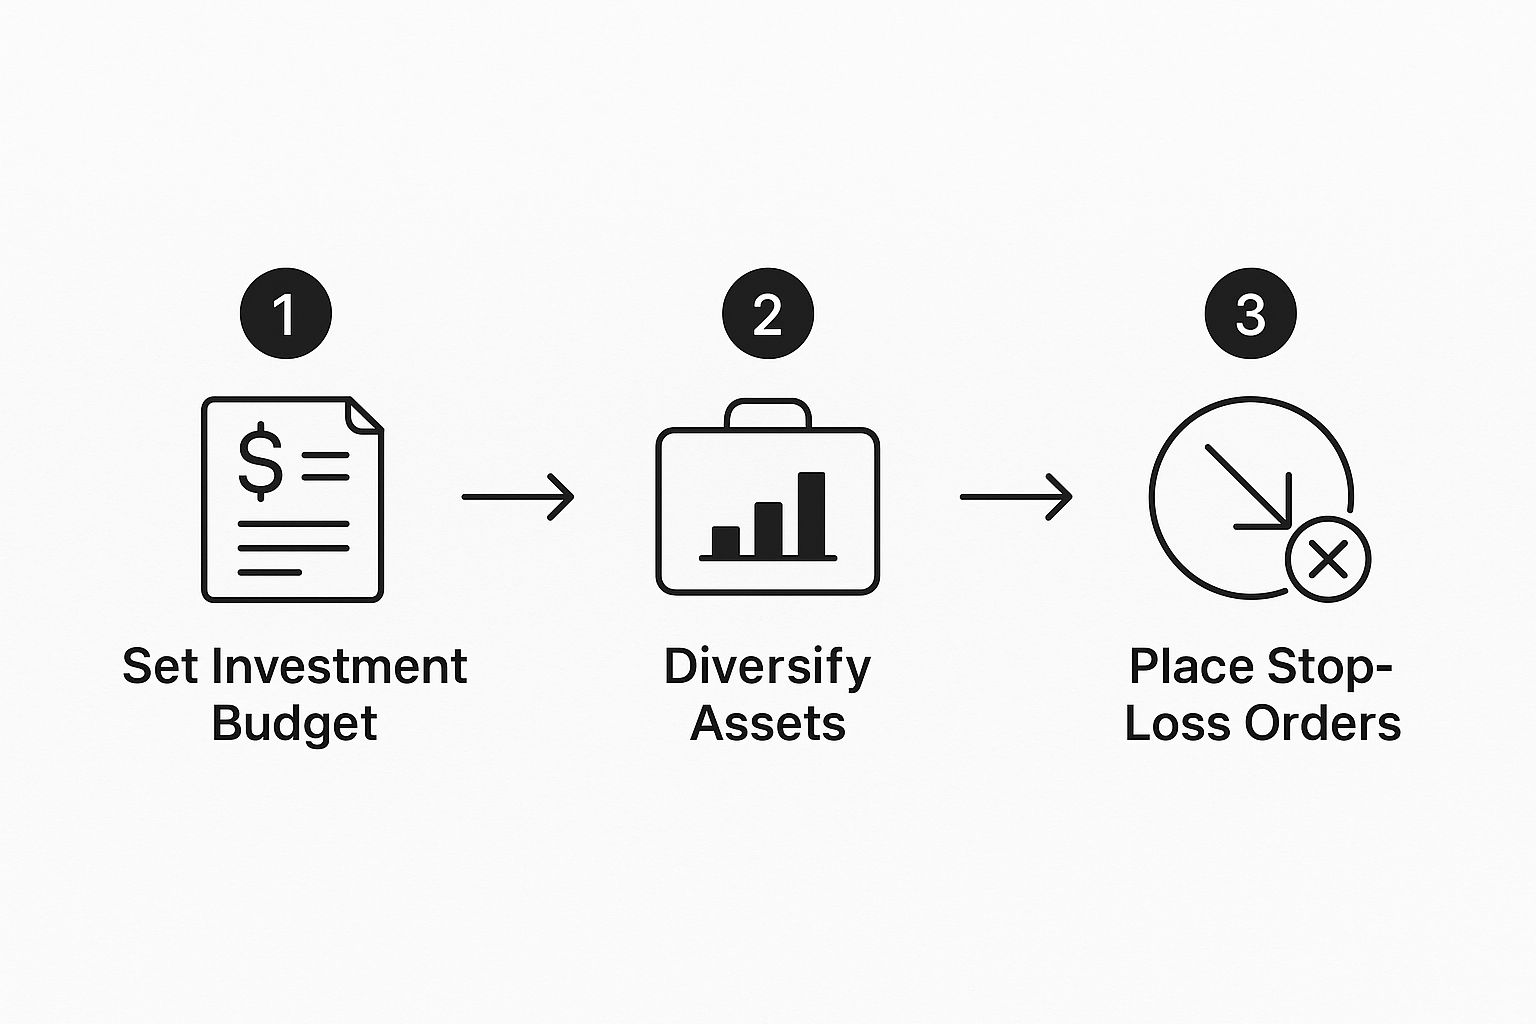
The whole process shows that analysis is useless without sound risk management, like setting stop-loss orders to protect your capital. With global cryptocurrency ownership expanding to over 560 million people, the need for a structured approach has never been more critical.
This market has grown at a compound annual rate of 99% from 2018 to 2023, a mind-boggling figure that highlights both its massive potential and its inherent volatility. You can dig into more of this data on Triple A's research page. By combining all three analysis types, you build a robust framework that helps you navigate this dynamic market with clarity and confidence.
Common Questions About Crypto Analysis
Even with a solid framework, some questions always pop up when you start analyzing crypto projects on your own. Let's tackle a few of the most common ones to clear up any confusion and get you moving with confidence.
Which Type of Analysis Is Best for a Beginner?
If you're just starting out, your best bet is fundamental analysis. Hands down.
It forces you to look past the noisy price chart and really dig into the "why" behind a project. You’ll learn about its mission, the tech it’s built on, and whether it has a real shot at long-term survival. This approach anchors your decisions in actual value, not just hype.
Technical analysis is great for timing your buys and sells, but a strong fundamental understanding ensures you're investing in something with substance. Think of it like building the foundation of a house before you start worrying about the color of the paint.
Once you’re comfortable sizing up a project's core strengths, you can start layering in sentiment and technical analysis to really dial in your strategy.
How Often Should I Re-Analyze My Crypto Holdings?
The crypto market moves at lightning speed, so a "set it and forget it" attitude is a recipe for disaster. You need to check in periodically to make sure your original reasons for investing still make sense.
Here’s a good rhythm I've found works well:
- Quarterly Fundamental Review: At least once every three months, take a fresh look at the core projects in your portfolio. Are they hitting their roadmap goals? Have they announced new partnerships? Has a new competitor emerged?
- Weekly Sentiment & Technical Check: A quick, weekly glance at the charts and the Fear & Greed Index is enough to stay in tune with the market’s mood without getting lost in the daily noise.
Of course, if there’s a massive project announcement or a huge market-wide event, be ready to do a full re-analysis on the spot.
The Biggest Mistake to Avoid When Analyzing Crypto:
The single worst mistake you can make is relying on just one type of analysis. Buying a coin just because its chart looks bullish—without knowing what the project even does—is pure gambling. On the flip side, buying into a fantastic project during a peak of "Extreme Greed" can set you up for immediate pain.
Another massive pitfall is giving in to FOMO (Fear of Missing Out). That's an emotional reaction, usually driven by social media hype, not sound analysis. Always do your own research (DYOR) instead of blindly following an influencer's latest call.
A balanced approach that combines fundamental, technical, and sentiment analysis will always be your most reliable path forward.
Ready to stop guessing and start analyzing? Fear Greed Tracker gives you real-time sentiment scores and deep data on over 50,000 assets, helping you make smarter, data-driven decisions. Get your edge at https://feargreedtracker.com.