
Relying on last quarter's sales data to predict today's market is like driving while only looking in the rearview mirror. It shows you where you’ve been, but not where you’re going. True market analysis has to blend that historical data with what’s happening right now, because human emotion—fear and greed—is what really steers the ship.
Why Traditional Market Analysis Falls Short
The classic approach to market trends always leaves you a step behind. It's built on lagging indicators: quarterly earnings reports, old sales figures, and annual consumer surveys. This stuff is useful, sure, but it only paints a picture of the past. In a world where a single tweet can shift markets in seconds, that delay means you're missing the real story.
This old-school method completely misses the emotional currents that drive sudden market moves. Fear, uncertainty, and greed are powerful forces that don't show up in a spreadsheet until the damage is done. To stay ahead, you need to bridge that gap with real-time insight.
The Problem with Lagging Indicators
Let’s say a company makes premium hiking gear. Their Q3 sales figures are amazing, showing a solid 15% year-over-year growth. High-fives all around, right? They decide to ramp up production for the holidays, thinking they've got a winner.
But they missed something. A conversation was bubbling up online about a new, more durable, and cheaper material from a small competitor. That online chatter, full of excitement and glowing reviews, was a huge sentiment shift. By the time the company sees its Q4 sales tank, the competitor has already grabbed a huge piece of the market. The traditional data said "success," but the real-time sentiment was screaming "warning."
The core issue with old-school analysis is that it can't measure the feeling of the market. It tracks what people bought, but misses why they bought it—and what they're planning to buy next.
The Growing Demand for Real-Time Insight
Businesses are finally waking up to this. The market research industry is on track to hit $140 billion in 2024, a massive 37.25% jump from $102 billion just three years ago. That’s not just a small bump; it’s a clear signal that everyone is scrambling for tools that can keep up. You can discover more insights about market research industry growth and see what it means for the future.
This isn't about collecting more data; it's about getting the right data at the right time. Understanding market trends today means looking beyond the numbers and using tools that can actually measure the public’s pulse. By tracking sentiment scores, keeping an eye on social media, and setting up smart alerts, you can stop reacting to the past and start anticipating the future.
Translating Market Sentiment Into Actionable Insights
Raw data tells you what is happening. Market sentiment, on the other hand, pulls back the curtain to show you the why. It’s the emotional undercurrent driving the numbers, and understanding it is the difference between just watching prices move and actually anticipating where they might go next.
A high score isn't a simple green light to "buy," and a low one isn't a screaming "sell" signal. These scores are all about context. Let's say a new tech product launches to massive hype. A score of 90+ (Extreme Greed) might seem great, but to an experienced eye, it could be a red flag. It often signals that the market is getting overheated and a correction might be just around the corner.
Now, flip that scenario. An established, solid company takes a small PR hit, and the sentiment score plummets into Extreme Fear. This is where savvy traders lean in. They see a classic overreaction—a potential buying opportunity before the market comes to its senses.
How To Read The Scores Correctly
The biggest mistake you can make is treating sentiment as a standalone metric. Real insight comes from layering it with other data points, like trading volume, price momentum, and, of course, fundamental news. Acting on sentiment alone is like trying to navigate a city with only one landmark. You need the full map.
One of the most powerful techniques I've learned is to hunt for divergence. This is when a stock's price is climbing, but its sentiment score is quietly slipping. That's a huge tell. It could be an early warning that the rally is running out of steam and the big players are starting to get bearish.
A high sentiment score can be a sign of market froth, while extreme fear often precedes a rebound. Your job is to distinguish between genuine panic and a temporary overreaction, which is where combining sentiment with other data becomes indispensable.
A Quick Guide to Fear and Greed Sentiment Scores
To help you get a feel for what each score means in the real world, I've put together this quick reference table. Think of it as a cheat sheet for translating sentiment into potential market action.
| Sentiment Score Range | Meaning | Potential Market Action | Common Mistake |
|---|---|---|---|
| Extreme Greed (75-100) | The market is euphoric; FOMO is high. | Time for caution. Consider taking profits or setting tighter stop-losses. | Jumping in late, thinking the rally will last forever. |
| Greed (55-74) | Investors are optimistic and buying. | The trend is strong, but be watchful for signs of a top. | Ignoring fundamentals because the price keeps climbing. |
| Neutral (45-54) | The market is uncertain; a tug-of-war. | A good time to wait for a clearer signal. Patience is key. | Forcing a trade when the market hasn't chosen a direction. |
| Fear (25-44) | Pessimism is growing; investors are selling. | The market is getting cheaper. Start looking for potential bargains. | Selling in a panic along with the crowd. |
| Extreme Fear (0-24) | Widespread panic and capitulation. | Historically, a prime buying opportunity for long-term investors. | Being too scared to buy when prices are at their lowest. |
Remember, these are guidelines, not gospel. Always use them as one part of a much broader analysis.
From Data Points to Strategic Decisions
To truly master what is market sentiment, you have to connect the dots between these emotional shifts and your own strategy.
Here’s a practical look at how I might use the different levels:
- Extreme Greed (80-100): This is my signal to be extra cautious. It often means a market is due for a pullback. Forget FOMO; this is when I start thinking about taking profits or tightening up my stop-losses.
- Neutral (45-55): The market is basically shrugging its shoulders. When I see this, I usually sit on my hands. It's better to wait for a clear signal than to guess which way things will break.
- Extreme Fear (0-25): For a long-term investor, this is often where the best opportunities lie. It signals that investors are far too pessimistic. These are the moments that have historically rewarded those who are willing to buy when everyone else is selling.
This is why a comprehensive dashboard pulls from so many different places.
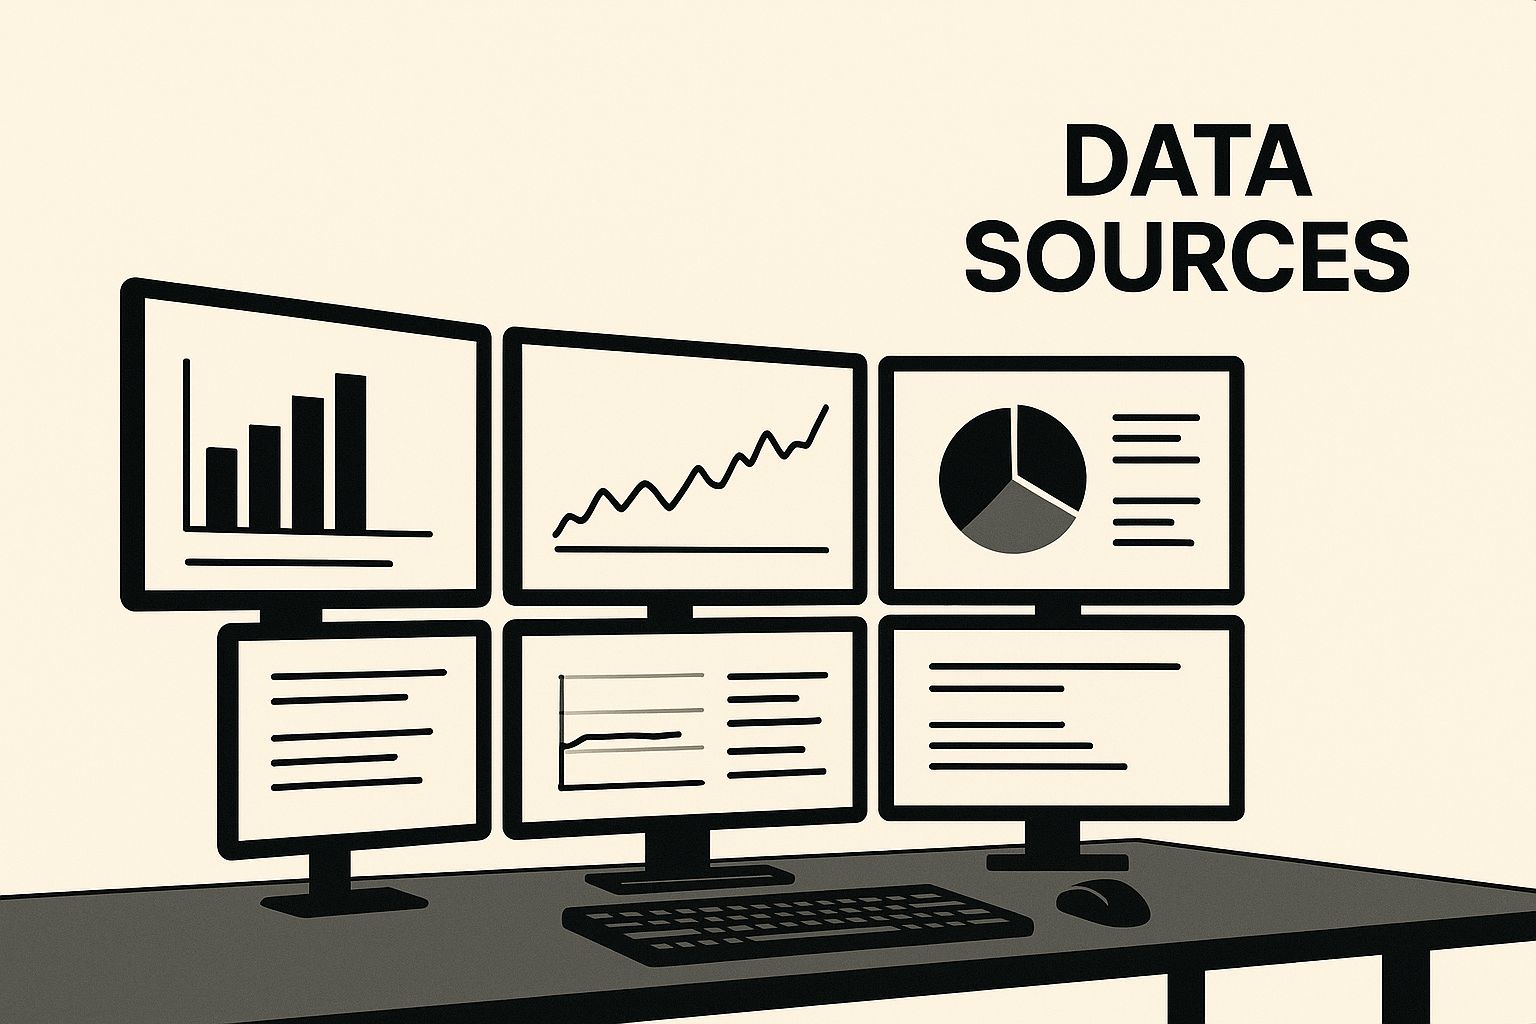
As you can see, a solid analysis isn't just one thing. It's a blend of technical charts, fundamental data, and social chatter. By bringing all these sources together, you build a much more resilient and nuanced view of the market—one that goes way beyond simple price action to understand the forces actually driving it.
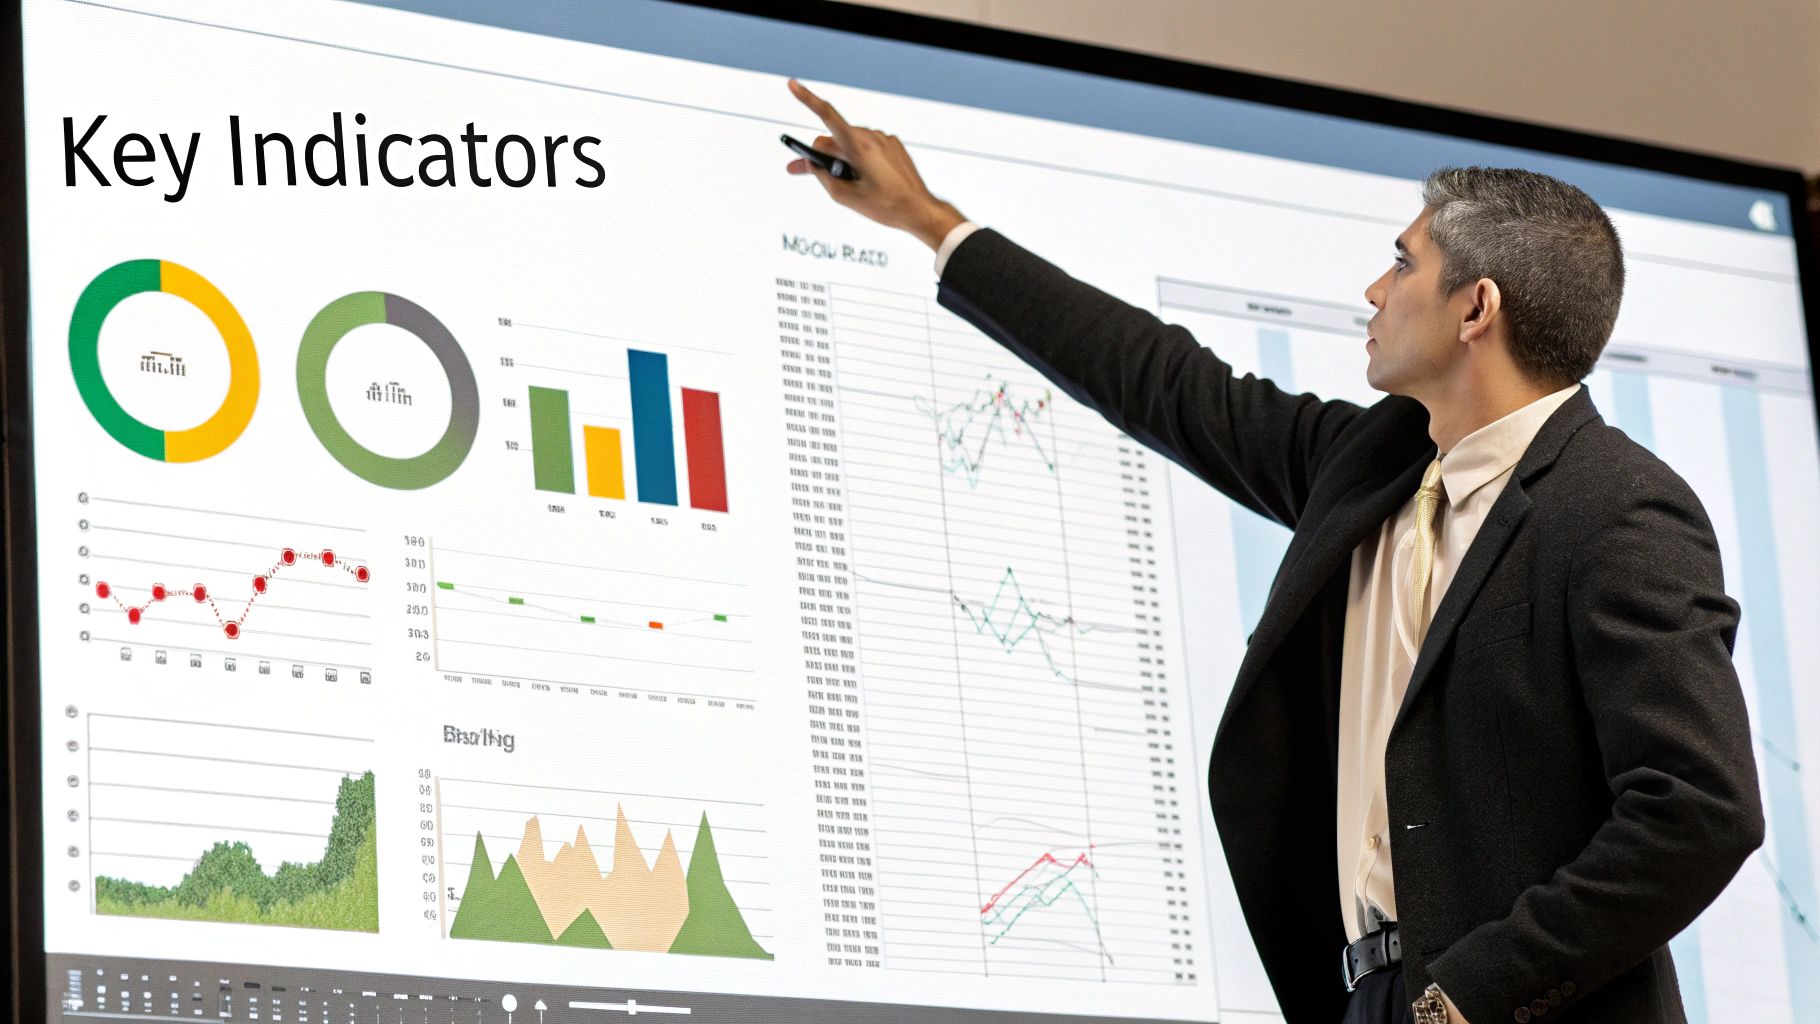
Using Charts to Visualize Market Trends
Sentiment scores give you a powerful, at-a-glance snapshot of market emotion. But charts? That’s where the real story unfolds. This is where you get to see the minute-by-minute battle between buyers and sellers, transforming abstract data into something you can actually see and interpret. It’s the best way to move beyond just numbers and start recognizing patterns like support, resistance, and shifts in momentum.
Simply watching a price go up doesn't give you the full picture. When you start layering sentiment data on top of a price chart, you suddenly gain a much deeper understanding of the trend's health. It’s a powerful combination that either confirms your analysis or, more importantly, screams at you when something isn't quite right.
Uncovering Deeper Insights with Chart Types
Different charts tell different parts of the story. A simple line chart is fine for a quick overview, but if you want to dig in, you need more detail. Bar charts are a step up, showing you the open, high, low, and close for a period, which gives you a much better feel for volatility.
For my money, though, nothing beats a candlestick chart. Each candle is a rich, visual summary of the price action within a specific timeframe. If you’re serious about visual analysis, you absolutely have to learn how to read candlestick patterns. They can signal potential reversals or continuations long before other indicators catch on.
Spotting Divergence: A Powerful Warning Signal
One of the most valuable techniques I’ve learned is spotting divergence. This is what happens when the price of an asset and a related indicator—like our market sentiment score—start moving in opposite directions. It’s a classic sign that the current trend is running out of gas.
Think about a stock that’s been hitting new highs for weeks. On the surface, it looks unstoppable. But when you overlay the sentiment score, you notice it’s been quietly trending downward. This is a bearish divergence, and it's a massive red flag.
- What Price Shows: The trend is strong; everyone is confident.
- What Sentiment Shows: The underlying belief is fading; smart money might be quietly heading for the exits.
- The Takeaway: That price climb is built on a shaky foundation and could be about to topple.
Divergence is the market’s way of whispering that the party might be ending soon. Ignoring it is like hearing a smoke alarm and assuming someone is just making toast—a risk you really don’t want to take.
On the flip side, you have bullish divergence. This occurs when a price is hitting new lows, but the sentiment score starts to creep higher. It suggests that while the market is in panic-selling mode, a bottom might be forming as quiet optimism starts to build.
Catching this early can position you perfectly for the next big move up. By combining sharp visual chart analysis with sentiment data, you stop just reacting to price changes and start anticipating them.
How to Automate Your Trend Monitoring with Smart Alerts
Look, you can't stare at charts all day. Nobody can. But while you're living your life, the market is always moving. The trick isn't to become a 24/7 chart-watcher; it's to shift from passive analysis to proactive monitoring. You let the technology do the heavy lifting so you can focus on making the smart calls.
This is where automated alerts come in. Instead of compulsively checking sentiment scores every hour, you can create custom notifications that ping you only when specific, important conditions are met. It’s the best way to make sure you never miss a critical shift just because you stepped away from your screen.
Configuring Your First Smart Alerts
Getting this set up is way easier than you might think. Start by asking yourself: what market events would absolutely demand my immediate attention? Those are your key thresholds.
Here are a few practical examples to get you going:
- Broad Market Meltdown: Set an alert for when the S&P 500 enters ‘Extreme Fear’ (a score below 25). A drop like that often signals a market-wide overreaction—and a potential buying opportunity for those who are paying attention.
- Sudden Sector Shake-up: If you're heavy into EVs, you could create an alert for when the industry's collective sentiment nosedives by 10% or more in a single day. That could be your first heads-up about a piece of bad regulatory news.
- An Outlier Emerges: Maybe you want to know when a specific stock, like AAPL, shows a sentiment score that’s way off from the rest of the tech sector's average. This is great for spotting company-specific issues that the broader market hasn't priced in yet.
Think of these alerts as your personal market watchdogs. They free you up from hours of manual work, letting you move from chasing trends to being notified the second they start to form. To really get the most out of these signals, it helps to have a solid grasp of how to use market sentiment analysis for trading within your overall strategy.
Personalizing Alerts for a Real Edge
Generic alerts are fine, but custom-tailored notifications are what give you a distinct advantage. It's about getting the right information at the right time. This idea isn't just for traders, either. A recent report found that 56% of marketing leaders are investing heavily in personalization to drive growth. You can read the full research on marketing personalization from Deloitte Digital to see just how powerful this concept is across different industries.
Think of smart alerts as your personal research assistant. It constantly scans the market for the exact conditions you care about and taps you on the shoulder only when it finds something that requires your attention.
For example, you could set a very specific alert for a cryptocurrency that’s suddenly trending in online searches but still has a neutral sentiment score. That unique combination could be a signal that a breakout is coming before widespread greed kicks in.
By creating these highly specific, personalized triggers, you’re turning raw data into a timely, actionable signal. It completely changes how you analyze what the market is doing.
Gaining an Edge with Predictive AI Analysis
Traditional data tells you what happened yesterday. Predictive AI analysis, on the other hand, gives you a glimpse into what might happen tomorrow. This isn't some far-off sci-fi concept anymore; AI is a real tool that sifts through massive, unstructured datasets—think news articles, social media chatter, and earnings call transcripts—to spot patterns a human analyst would almost certainly miss.
It's like having a thousand analysts on your team, working 24/7.
This shifts your entire approach from reactive to proactive. Imagine your AI model flagging a subtle but growing negative sentiment around a key component in the electric vehicle supply chain. This insight could pop up weeks before it hits official reports, giving you a massive head start to adjust your positions. AI is all about catching those faint signals before they become blaring trends.
Uncovering Hidden Market Narratives
The real magic of AI in market analysis is its knack for understanding context and emotion at an incredible scale. It doesn't just count keywords; it interprets the nuance behind them. This process generates predictive sentiment scores that can forecast potential market moves with a much higher degree of accuracy.
For example, an AI might notice that online conversations about a new pharmaceutical drug are slowly shifting from concerns about side effects to celebrating patient success stories. That kind of qualitative shift is a powerful leading indicator that public perception is turning positive, often right before the company’s stock price begins to climb.
This isn't just an experimental approach anymore—it's a structural shift in how professionals are analyzing the market. A recent report from Qualtrics, which surveyed over 3,000 researchers, confirmed AI is fundamentally changing how experts predict market behavior and make their teams more efficient. You can see the full findings in their 2025 Global Market Research Trends Report.
Putting AI Insights into Practice
So, how does this actually give you an advantage? The key is to use AI-driven insights as another layer of confirmation for your own analysis. It provides an objective, data-backed perspective that can challenge your assumptions or, just as importantly, validate your hunches.
Think about these practical applications:
- Early Trend Detection: AI can spot emerging consumer preferences, like a sudden interest in sustainable packaging, long before it ever shows up in sales data.
- Risk Management: It can flag rising negative chatter around a company or industry, acting as an early warning system for potential trouble ahead.
- Opportunity Identification: By finding assets with low prices but increasingly positive online buzz, AI helps uncover undervalued gems the rest of the market has completely missed.
AI doesn't replace your judgment; it enhances it. Think of it as a powerful flashlight that illuminates parts of the market that were previously hidden in the dark, allowing you to make more informed and timely decisions.
When you start weaving predictive AI into your workflow, you’re not just keeping up. You’re putting yourself at the front of the line, ready to act on insights that others haven't even seen yet.
Frequently Asked Questions About Market Trend Analysis

Whenever you start using new techniques in your workflow, questions are going to pop up. It's only natural. Getting comfortable with a modern approach to market analysis means getting clear, direct answers to those questions.
So, let's tackle some of the most common ones we hear from traders and investors. The goal here is to help you fine-tune your process and use these powerful tools with more confidence.
How Reliable Is Sentiment Analysis for Predicting Market Moves?
Think of sentiment analysis less like a crystal ball and more like a highly accurate weather forecast. It's not about giving you a perfect prediction in isolation. Its real power—and reliability—skyrockets when you combine it with your existing technical and fundamental analysis.
Sentiment data often provides the crucial "why" behind a sudden price swing that a chart can't explain on its own.
For instance, you might see a fundamentally solid stock taking a dip. But if its sentiment score is holding firm or even rising, that dip is likely just market noise, not a real trend change. This is the kind of context that helps you make smarter moves.
Sentiment analysis adds a vital layer of confirmation to your decisions. It uncovers the emotional currents driving the market, helping you avoid acting on incomplete information that a price chart alone will never show you.
This insight is exactly what helps you tell the difference between a genuine trend reversal and a fleeting overreaction—which, by the way, is where some of the best opportunities are often hiding.
Can I Use These Trend Analysis Techniques for Any Market?
Absolutely. While a lot of advanced tools are built for financial assets, the core principles are universal. Why? Because every market, at its heart, is driven by human emotion.
Whether you're looking at stocks, crypto, real estate, or even consumer goods, the goal is always the same: to read the collective mood of the crowd.
You can apply these concepts pretty much anywhere. You could analyze social media chatter and local news in a specific neighborhood to get a feel for real estate trends. Or you could track online brand mentions to get an early read on a new product launch. The skill isn't just about reading a score; it's about learning how to interpret the emotional pulse of whatever market you're in.
How Often Should I Be Checking Market Sentiment Trends?
There's no single right answer here. The best frequency depends entirely on your strategy and your time horizon. It’s all about syncing up your monitoring habits with your actual investment goals.
Here are a few guidelines to help you find your rhythm:
- Long-Term Investors: A detailed check-in once a week is usually plenty. It keeps you tapped into the broader market direction without getting you bogged down in the day-to-day noise.
- Short-Term Traders: This is where you need to be on top of things. Daily or even hourly monitoring is often necessary to catch the quick shifts that create trading opportunities. Smart alerts are a complete game-changer here.
- Brand Managers: For you, it's about continuous monitoring. You have to be ready to react to sentiment shifts in real-time to protect your brand's reputation.
For most people, a thorough weekly review combined with quick daily glances is a great starting point. This ensures you won't miss any major shifts that might require a strategic adjustment.
Ready to stop guessing and start analyzing the market with data-driven confidence? Fear Greed Tracker provides the real-time sentiment scores, advanced charts, and smart alerts you need to gain an edge. Transform fear into your strategic advantage today by visiting https://feargreedtracker.com.