
Figuring out a company's intrinsic value is all about looking past the daily market noise. At its core, it's a process of projecting how much cash a business will generate in the future and then translating that back into today's dollars. This gives you a solid anchor for its true underlying worth, completely separate from its often-fickle stock price.
This is the bedrock of value investing.
Understanding Intrinsic Value and Why It Matters

Before we get into the number-crunching, let's nail down the concept. Intrinsic value answers one simple question: "What is this business actually worth if you ignore the stock market's mood swings?" It forces you to think like an owner, not a trader.
This mindset is crucial. A stock price can jump or tank based on a single news headline, a viral tweet, or just plain old market sentiment. Intrinsic value, on the other hand, is tied to something far more stable: the company's ability to generate cold, hard cash over the long haul.
The Role of Discounted Cash Flow
The gold standard for this calculation is the Discounted Cash Flow (DCF) model. A DCF analysis isn't as scary as it sounds. You're basically forecasting a company's future cash flows—usually for about 10 years—and then "discounting" them back to what they're worth today.
Why? Because a dollar today is worth more than a dollar ten years from now.
To give you a real-world picture: if you run the numbers and find a company’s total discounted value is $830 million and it has 100 million shares out there, its intrinsic value is $8.30 per share. If the stock is trading at $5, you might have found a bargain.
Why This Calculation Is Essential
Learning to calculate intrinsic value gives you a massive edge. It's the difference between gambling and investing. With this skill, you can:
- Spot Undervalued Stocks: Find those hidden gems the market is overlooking.
- Dodge Overpriced Hype: Avoid getting caught up in bubbles and buying at the peak.
- Make Rational, Data-Driven Moves: Take emotion out of the equation and invest with confidence.
By focusing on what a business is fundamentally worth, you build a logical framework for every decision you make. You're no longer reacting to the market's whims; you're operating from a position of strength and clarity.
Ultimately, mastering this is a non-negotiable step in building a truly effective investment decision-making process. It shifts your entire perspective from speculating on prices to investing in great businesses at fair values.
How to Project Future Free Cash Flows
Alright, this is where the real work—and the real fun—begins. To get to a company's intrinsic value, you have to predict its future ability to churn out cash. The metric we care about most here is Free Cash Flow to the Firm (FCFF).
Think of FCFF as the total cash left over for everyone who has a claim on the company (both stockholders and lenders) after it has paid for its operations and invested in its future.
Our job is to project this number out for a reasonable amount of time, usually five to ten years. You can't just make numbers up, though. A solid forecast is always built on a foundation of historical performance and smart assumptions about what's coming next.
Finding Historical Free Cash Flow
Before you can predict the future, you need to understand the past. The first step is to dive into the company’s annual financial statements for the last five years or so. You'll be spending most of your time in the Income Statement and the Cash Flow Statement.
You're looking for the pieces to calculate historical FCFF using this standard formula:
FCFF = EBIT(1 - Tax Rate) + Depreciation & Amortization - Capital Expenditures - Change in Net Working Capital
Every single one of these inputs can be found in those financial reports. By calculating this for the past few years, you get a feel for the business's rhythm. It tells you a story about its profitability, how much it needs to reinvest to grow, and how efficiently it's running.
For instance, if you notice that capital expenditures are consistently growing faster than revenue, that's a red flag. It might mean the company is in a tough industry and has to spend a ton of cash just to keep up, which will definitely eat into future free cash flows.
Building Your Projections
Once you have your historical data laid out, it's time to start forecasting. This is less about being a psychic and more about making educated guesses based on the evidence. I highly recommend building a simple spreadsheet to keep all your assumptions in one place.
You’ll be focusing on a few key drivers of the business:
- Revenue Growth Rate: Start with historical growth, but don't end there. What's happening in the broader industry? What did management say on their last earnings call? What's the economic forecast look like? A 15% growth projection doesn't make much sense if the entire industry is only growing at 5%.
- Operating Margins (EBIT Margin): Has the company's profitability been steady, getting better, or getting worse? Think about what could push margins up or down. New competitors or rising supply costs could squeeze them, while a powerful brand might give them room to expand.
- Capital Expenditures (CapEx): This is the cash spent on big-ticket items like new factories or technology upgrades. You can find past spending in the "Investing Activities" section of the Cash Flow Statement. Also, pay close attention to what the leadership team says about their future investment plans.
A huge mistake I see all the time is getting way too optimistic. You have to ground every single assumption in reality. If a business has grown at an average of 8% for the last decade, you need a very good reason to project 30% growth for the next five years.
By forecasting these key items, you can build a picture of the company's financial performance year by year. From there, you can calculate your projected FCFF for each year in your forecast period. This stream of future cash flows is the raw material we'll need for the next step in our valuation.
How to Choose the Right Discount Rate
You've done the hard work of forecasting a company's future cash flows. Now comes the real magic—and the part where art meets science. How do you pull those future dollars back into today's value?
You do it with a discount rate, and it's arguably the most powerful lever in your entire valuation model. A tiny nudge to this number can send your final intrinsic value soaring or plummeting.
Think of the discount rate as your opportunity cost. It's the minimum return you'd demand for tying your money up in this specific company, given all its risks. A higher rate signals higher risk, which makes those future cash flows less valuable in the present. It's a reality check.
Using WACC as Your Discount Rate
So, where does this number come from? The most common and academically sound approach is to use the Weighted Average Cost of Capital (WACC).
Don't let the name scare you. WACC simply blends the costs of the two ways a company funds itself: raising money from shareholders (equity) and borrowing from lenders (debt).
It breaks down like this:
- Cost of Equity: The return shareholders expect for taking on the risk of owning the stock. We'll get to how you find this in a moment.
- Cost of Debt: The effective interest rate the company pays on its loans, adjusted for the tax savings it gets from interest payments.
You then weigh these two costs based on how much of the company's capital structure is made up of debt versus equity.
Breaking Down the Cost of Equity with CAPM
To pin down the cost of equity, we turn to a classic finance tool: the Capital Asset Pricing Model (CAPM). This model gives us a structured way to estimate the expected return based on risk.
You’ll need to find three key inputs to make it work:
- Risk-Free Rate: This is what you could earn on a "riskless" investment. The yield on the 10-year U.S. government bond is the universal go-to for this. You can find it on any major financial news site.
- Market Risk Premium: This is the extra return investors demand for putting their money in the stock market instead of sticking with risk-free bonds. This figure is always debated, but historically it's hovered between 5% and 7%.
- Beta: This is a measure of a stock's volatility compared to the overall market. A beta of 1.0 means the stock moves in lockstep with the market. A beta above 1.0 means it's more volatile (riskier), and below 1.0 means it’s more stable. You can find this on just about any stock data platform.
The discount rate is deeply personal and subjective. Warren Buffett, for instance, often uses the long-term Treasury rate, but the choice has a huge impact. In one case study, shifting from a 3% Treasury rate to a personal required return of 10% dropped a company's estimated intrinsic value from $1,125 to just $211.66. Explore more about this sensitivity to see why it’s so important to test your assumptions.
This is exactly why picking your rate is so crucial. A great company can look like a terrible investment if your discount rate is too high, and vice versa.
It also drives home why you need to be aware of all the costs that eat into your returns. To learn more about one of the biggest, check out our guide to understand asset management fees and save on investments.
Calculating the Terminal Value
Alright, you've painstakingly forecasted the company's cash flows for the next ten years. Great. But what about year 11? And every year after that? A solid business doesn’t just fall off a cliff after a decade.
This is where the Terminal Value (TV) comes in. It’s a single, powerful number that captures the value of all cash flows from the end of your forecast into forever.
Don't skim over this part. In many DCF models, the terminal value can make up a whopping 70% or more of a company’s total intrinsic value. Botch this calculation, and your entire valuation is worthless. It pays to be thoughtful and, frankly, a little conservative here.
Two Paths to Find Terminal Value
Analysts generally take one of two roads to nail down this number. Each has its place, but the first one is far more common for the kind of long-term, fundamental investing we're doing.
- Perpetuity Growth Model: This is our workhorse. It assumes the company will keep growing its free cash flows at a slow, steady, and constant rate forever.
- Exit Multiple Model: This approach pretends you're selling the business at the end of the forecast period. It values the company based on a multiple of its earnings or revenue, much like a private equity firm would.
We’re sticking with the Perpetuity Growth Model because it aligns perfectly with the mindset of a long-term business owner, which is the heart of intrinsic value investing.
Using the Perpetuity Growth Model
The formula, often called the Gordon Growth Model, looks simple enough on the surface:
Terminal Value = [FCFF in Final Year * (1 + Growth Rate)] / (Discount Rate - Growth Rate)
The most crucial—and most debated—input here is the long-term growth rate. This is not the high-octane growth you might have projected for the next few years. Think of this as the company's "cruise control" speed once it's a mature, established player in the economy.
Here's a non-negotiable rule of thumb: this perpetual growth rate should never be higher than the expected long-term growth rate of the overall economy (GDP). A rate between 2% and 3% is a standard, defensible choice for most mature companies. Anything more implies the company will one day swallow the entire global economy. That’s not happening.
Once you have your terminal value, you treat it like one giant cash inflow that happens in the final year of your forecast.
Discounting Everything to Today's Value
Now you have all the building blocks: your year-by-year free cash flows (say, for years 1-10) and your terminal value (representing years 11 and beyond). The next job is to pull all that future money back into today’s dollars.
You’ll discount each individual cash flow, including the terminal value, using the WACC you figured out earlier. Add up all those discounted figures, and you've got the company's Enterprise Value. This is the total value of the company's core business operations.
The Final Adjustments for Per-Share Value
We're in the home stretch, but Enterprise Value isn't the price you see on your brokerage screen. We need to make a couple of key adjustments to get to a per-share value.
- Subtract Net Debt: First, subtract the company's net debt (Total Debt minus Cash and Equivalents). Why? Enterprise Value is the value for everyone—lenders and shareholders. As equity holders, we only get what’s left after the debt is paid off.
- Divide by Shares Outstanding: What remains is the company's total equity value. To get the intrinsic value per share, just divide this by the total number of diluted shares outstanding.
That final number is the prize. It’s your best estimate of what a single share is truly worth today, based on all its future cash-generating power.
Let's Run the Numbers: A Real-World Example
Theory is one thing, but putting it into practice is where the real learning happens. Let’s walk through a simplified example to see how all these moving parts connect when you’re trying to find a company’s intrinsic value.
For this exercise, we'll analyze a fictional (but realistic) tech company we’ll call "Innovate Corp."
First things first, we need a baseline. We’d pull Innovate Corp's financial statements for the last five years and calculate its historical Free Cash Flow to the Firm (FCFF). After crunching the numbers, we spot a consistent growth pattern. Based on that history, plus current industry trends and the company's own guidance, we can start projecting.
Let's assume we project 10% annual FCFF growth for the next five years, followed by a more moderate 5% growth rate for the five years after that.
Nailing Down the Key Assumptions
With our cash flow projections mapped out, it's time to tackle the two most important (and subjective) inputs: the discount rate and the terminal growth rate.
After analyzing Innovate Corp’s capital structure and risk profile, we calculate its Weighted Average Cost of Capital (WACC) to be 8.5%. This is our discount rate—it represents the minimum return we need to make this investment worthwhile.
For the terminal value, we need a conservative perpetual growth rate that we can sustain forever. A safe bet is a number that mirrors long-term economic growth. We’ll pencil in a conservative 2.5% here to keep our model from getting too optimistic.
A Discounted Cash Flow model forces you to think like a business owner. Instead of getting distracted by daily market noise, you're focused entirely on the company's ability to generate cash over the long haul. That’s its true value.
Putting It All Together and Interpreting the Results
Now for the fun part. We take each of those ten projected FCFF figures and our terminal value, then discount them all back to today's dollars using our 8.5% WACC.
Adding up all those present values gives us Innovate Corp's Enterprise Value. From there, we just subtract the company's net debt and divide the result by the number of shares outstanding. Voila! We arrive at an intrinsic value of $150 per share.
But what if the stock is currently trading at $120? This is where the all-important "margin of safety" comes in. Our calculation suggests the stock is undervalued by 25%, giving us a nice cushion in case our assumptions were a little off.
This flowchart shows how that final step works—your calculated intrinsic value isn't your buy price; it's the number you use to set your buy price.
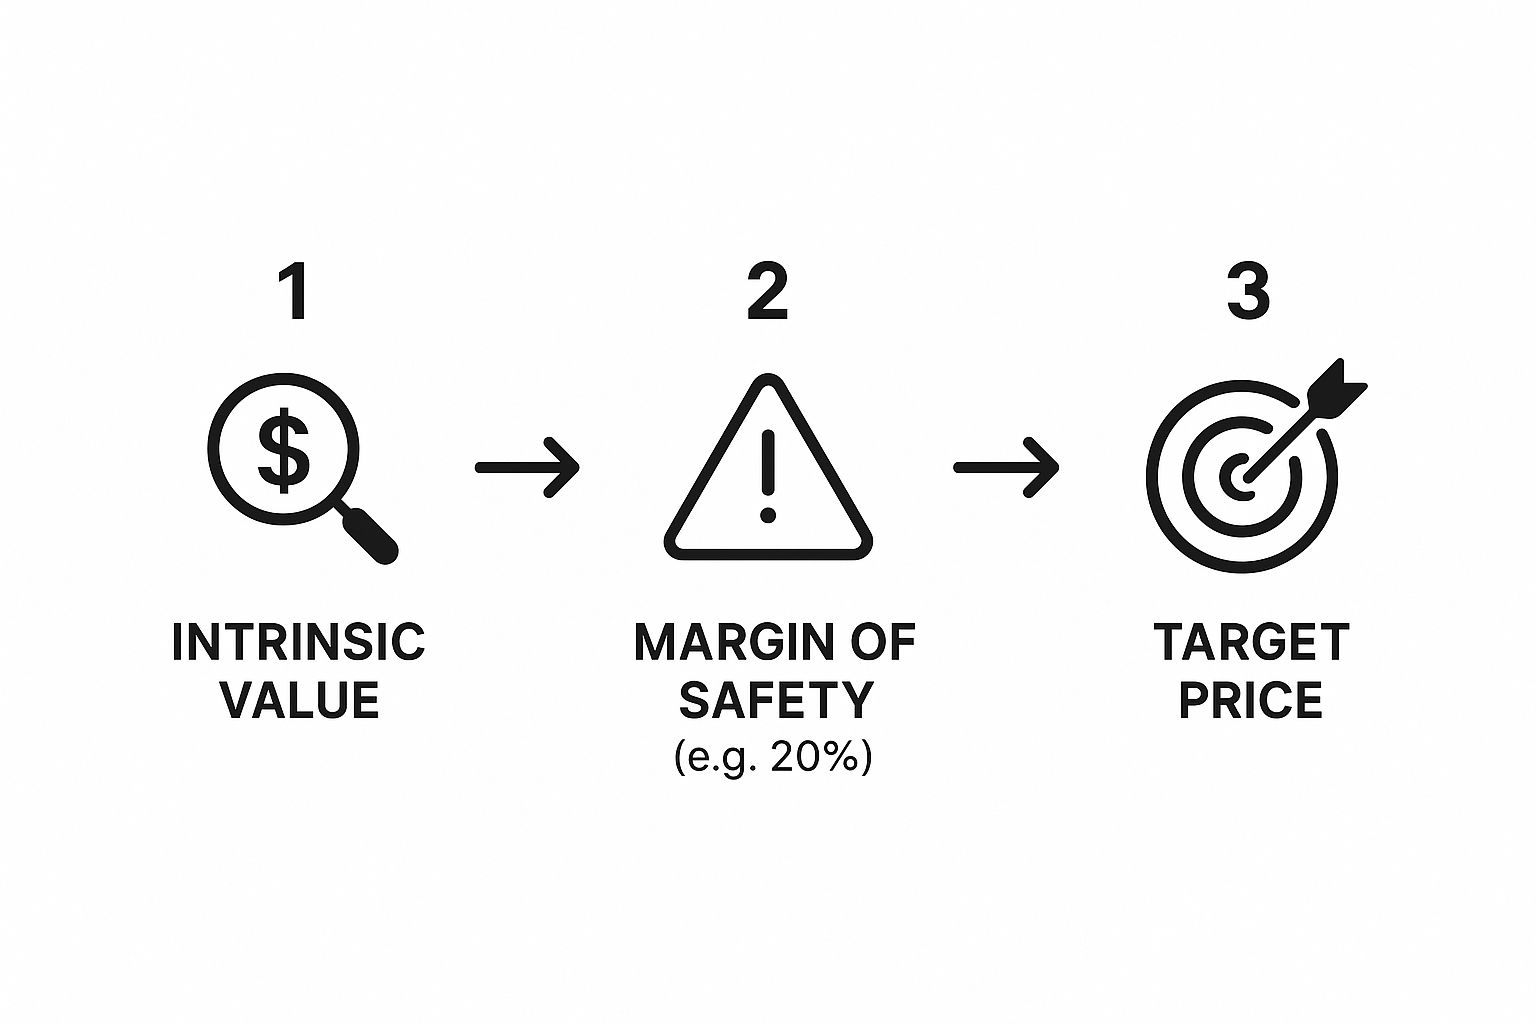
As you can see, that margin of safety is what protects you from overpaying and gives you a real edge.
The Power of "What If?": Running a Sensitivity Analysis
Hold on, we're not done yet. Your intrinsic value calculation should never be a single, magic number. It's an estimate—and a fragile one at that.
What happens if our WACC was actually 9.5%? Or if the long-term growth rate was only 2%? This is why a sensitivity analysis isn't just a nice-to-have; it's essential. You need to see how much your final number changes when you tweak your key assumptions.
For instance, you'll quickly find that even small adjustments to the discount rate and terminal growth rate can cause massive swings in your final valuation. An investment paying $10,000 annually for 10 years at a 10% discount rate is worth about $61,446 today. But that value changes dramatically if your risk assumptions shift. You can find more insights on how these modeling assumptions dramatically alter outcomes and why understanding this is so critical.
A sensitivity table is the perfect tool for this. It shows you a range of potential values based on different scenarios.
Sensitivity Analysis Example Impact of Assumptions
This table illustrates how the intrinsic value of Innovate Corp. shifts when we adjust our two most critical inputs.
| Scenario | Discount Rate (WACC) | Terminal Growth Rate | Calculated Intrinsic Value per Share |
|---|---|---|---|
| Base Case | 8.5% | 2.5% | $150.00 |
| More Optimistic | 8.0% | 3.0% | $175.40 |
| More Pessimistic | 9.0% | 2.0% | $128.75 |
| High Discount Rate | 9.5% | 2.5% | $135.50 |
| Low Growth Rate | 8.5% | 2.0% | $139.20 |
Seeing the valuation in a range like this gives you a much smarter framework for making decisions. It helps you understand not just the potential upside, but, more importantly, the risks hiding in your assumptions.
Common Intrinsic Value Questions
Even with a detailed guide, a few questions always seem to pop up once you start running these calculations yourself. Don't worry, that's completely normal. The whole process is built on assumptions and judgment calls, so hitting a few snags is just part of the learning curve.
Let's tackle some of the most common sticking points head-on. Think of this as a quick-reference guide for those "what if" scenarios that inevitably come up, helping you bridge the gap between theory and practical application.
Is Intrinsic Value a Perfect Number?
Not even close, and that’s probably the most important lesson you can learn. The final number you get is purely an estimate, and it's incredibly sensitive to your assumptions about growth, risk, and what the distant future holds. Two different analysts could use the exact same DCF model on the same company and get wildly different results just by tweaking the discount rate by a single percentage point.
The real goal here isn't to pinpoint one perfect number. The power of this exercise comes from understanding the range of possible values. This is why running a sensitivity analysis is so crucial—it shows you just how fragile your estimate is and helps you build in a much more realistic margin of safety.
Your calculated intrinsic value is a starting point for decision-making, not the final answer. It provides a logical framework to compare against the market price, forcing you to justify your investment thesis with data rather than emotion.
What if a Company Has No Profits?
Ah, the classic dilemma. This comes up all the time with high-growth tech companies or startups that are pouring every last dollar back into the business. Since they often have negative Free Cash Flow, a standard DCF model feels like trying to fit a square peg in a round hole.
When this happens, you have to get a bit more creative. Analysts typically try a few different things:
- Forecast Further Out: Instead of a 10-year projection, you might have to push it out to 15 or even 20 years to get to a point where the company is expected to be mature and consistently profitable.
- Use Revenue Multiples: Sometimes it makes sense to cross-check your work with an alternative valuation method, like a Price-to-Sales (P/S) multiple. Just know that this moves you away from a pure intrinsic value calculation.
Ultimately, valuing unprofitable companies is a much more speculative game. The range of potential outcomes is huge, which demands an even larger margin of safety. To get more context, it's helpful to see how professionals handle these tricky situations. A good next step is to learn how to understand stock analyst ratings to get a broader perspective on how the market prices these types of assets.
Ready to stop guessing and start making data-driven investment decisions? Fear Greed Tracker provides real-time market sentiment scores for over 50,000 assets, giving you the edge you need to spot opportunities and manage risk. Visit https://feargreedtracker.com to track live sentiment and build a smarter portfolio today.