
When you're picking stocks for day trading, you're looking for a specific trifecta: high liquidity, significant volatility, and a clear catalyst pushing the price. The game plan is to filter the market for stocks trading over a million shares a day that have predictable price swings. This lets you get in and out of positions fast, which is exactly where the profit is.
Building Your Foundation for Day Trading Success
Before you even think about specific stocks, let's get your mindset and setup right. This is what separates the consistently profitable traders from everyone else. Day trading isn't a slow-burn investing strategy; it’s a high-stakes discipline that demands intense focus, emotional discipline, and the right gear.
Forget about a company’s five-year plan. Your world revolves around immediate supply and demand, breaking news, and market sentiment that can move a stock in the next few minutes. It's a completely different ballgame.
Setting Up Your Trading Cockpit
Your success lives or dies by the quality of your tools. A laggy data feed or slow execution can flip a winning trade into a loser in the blink of an eye. There's no room for compromise here.
- A Low-Latency Broker: Find a platform known for lightning-fast order execution and low commissions. Every millisecond—and every penny—adds up.
- Reliable Charting Software: You need real-time data and customizable charts loaded with the technical indicators you trust. This is how you'll read the price action.
- A High-Speed Internet Connection: A rock-solid, fast connection is non-negotiable. It ensures your orders hit the market instantly and you're never trading on delayed information.
Think of these as the absolute fundamentals. Without them, even the most brilliant stock-picking strategy will crumble under the pressure of a live market.
The Mental Edge and Realistic Expectations
Let's be real: the stats on day trading can look pretty grim. But success becomes much more attainable when you approach it with discipline. One study found day traders hit an average success rate around 47% on S&P 500 trades. That number gets a lot better, though, when trades are filtered by strict criteria like volume and volatility.
Day trading is a business of probabilities, not certainties. Your job is to find high-probability setups and manage risk relentlessly. Winning every trade is impossible; the goal is to ensure your winning trades are bigger than your losing ones.
This brings us to the single most important skill you'll ever learn: risk management. Knowing which stocks to trade is only half the battle. Knowing when to cut a loss is what keeps you in the game long enough to win.
Before you go any further, make sure you understand how to protect your capital. Our guide on mastering day trading risk management is the perfect place to build this crucial skill.
Decoding Liquidity and Trading Volume
When it comes to day trading, liquidity is the lifeblood of any good strategy. Think of it as the flow of a river—you need a strong, steady current to get your boat in and out smoothly. In the market, that current is trading volume, which is simply the number of shares changing hands.
Without it, you’re dead in the water. You might spot the perfect entry, but if there aren't enough sellers at your price, your order won't get filled. Worse, you could be sitting on a winning trade but can't cash out because there are no buyers. That’s the nightmare of an illiquid stock.
Why High Volume Is Non-Negotiable
For day traders, high volume means you can execute trades almost instantly at or very close to the price you see on your screen. This is huge because it dramatically cuts down on slippage—that frustrating (and costly) gap between the price you expected and the price you actually got.
In a low-volume stock, even a single large order can send the price careening against you before your trade even goes through.
Most pros won’t touch a stock that trades less than 1 million shares a day. Many set the bar even higher, looking for names that consistently move over 5 million shares per day. Being able to get in and out without single-handedly moving the price is fundamental. You can find more great insights on how high volume aids trade execution at home.saxo.
This chart breaks down the relationship between trading volume, price volatility, and the potential success of your stock picks.
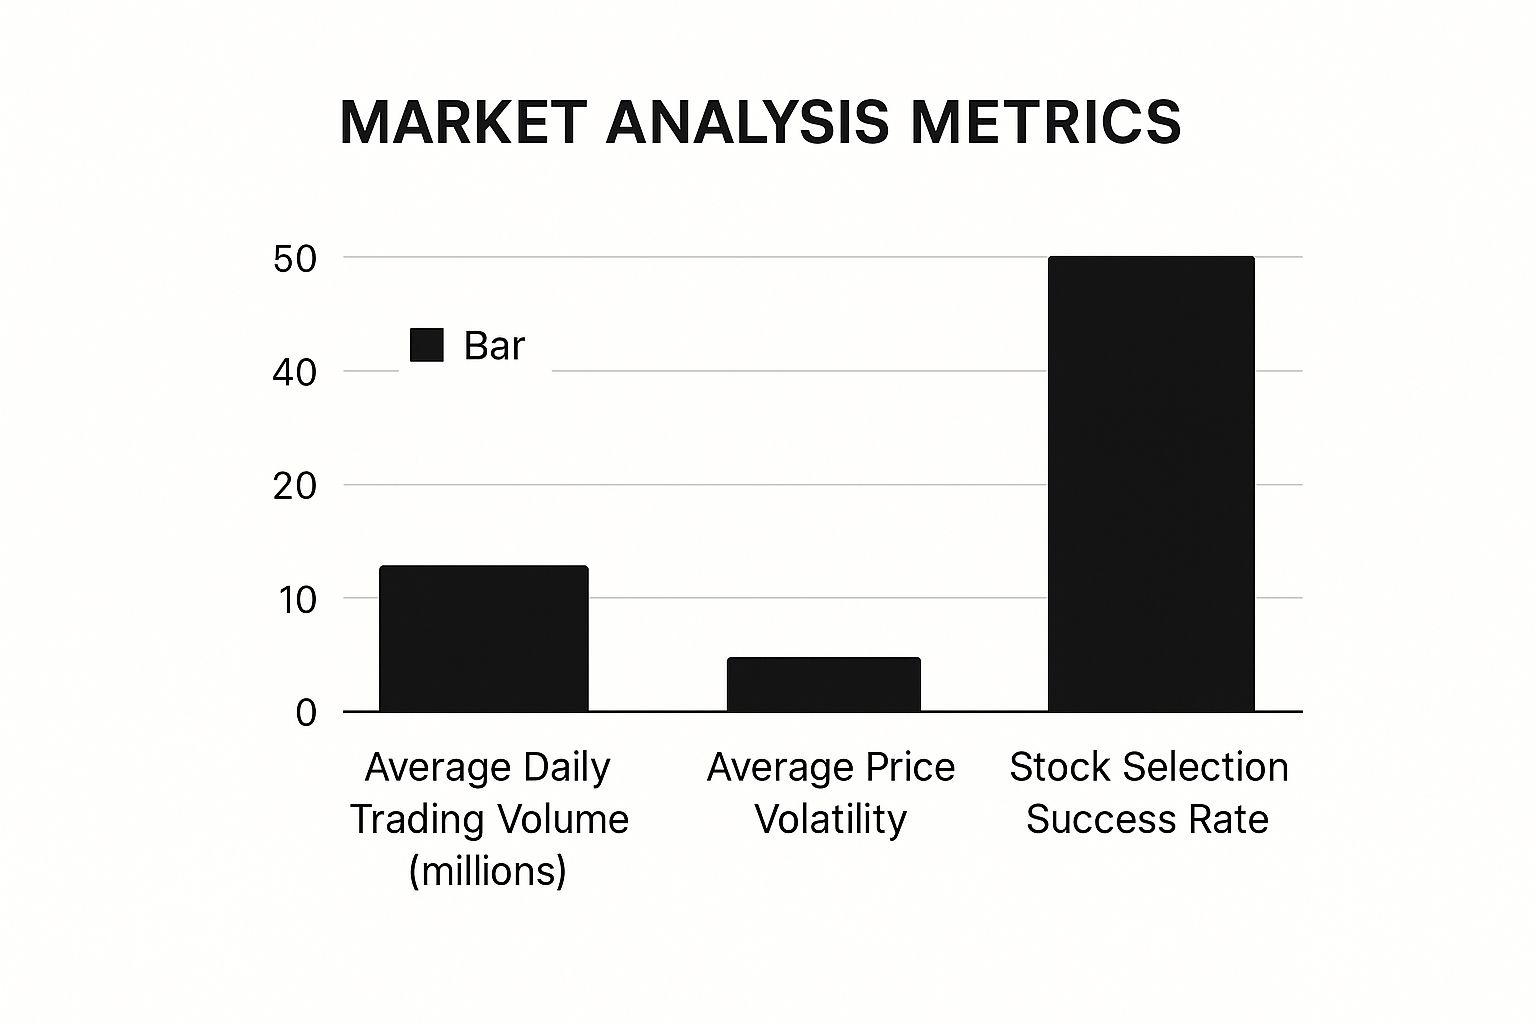
As you can see, higher trading volume and manageable volatility often line up with a better success rate. It really hammers home why these metrics are so critical.
To put it all in perspective, here are the key volume-based indicators that should be on every day trader's radar.
Key Liquidity and Volume Indicators for Day Traders
This table summarizes the essential metrics for gauging a stock's tradability, what they mean, and what you should be looking for.
| Metric | What It Measures | Ideal Target for Day Trading | Why It Matters |
|---|---|---|---|
| Average Daily Volume (30-day) | The average number of shares traded per day over the last 30 days. | > 1,000,000 shares | Establishes a baseline of consistent liquidity, proving the stock is regularly traded. |
| Share Price | The cost per share of the stock. | $10 - $200 | Filters out high-risk penny stocks and overly expensive shares requiring large capital. |
| Bid-Ask Spread | The difference between the highest price a buyer will pay (bid) and the lowest price a seller will accept (ask). | As tight as possible (e.g., $0.01 - $0.05) | A tight spread indicates high liquidity and lower transaction costs from slippage. |
| Relative Volume (RVOL) | Current volume compared to the average volume for the same time of day. | > 2.0 | Signals unusual interest and activity, highlighting stocks that are "in play" right now. |
Having a solid grasp of these numbers is non-negotiable. They quickly tell you whether a stock is worth your time or if it's a trap waiting to happen.
Identifying Liquid Stocks with a Screener
Trying to find these high-volume stocks manually is a fool's errand. This is where a good stock screener becomes your best friend, letting you filter the entire market down to a manageable watchlist.
Your pre-market routine should absolutely include running a scan with a few core liquidity criteria. Here’s a simple setup to get you started:
- Average Daily Volume (30-day): Set this to
> 1,000,000. This weeds out stocks that aren't consistently liquid. - Share Price: Choose a range you’re comfortable with, like $10 to $200. This gets rid of penny stock gambles and shares so expensive they tie up too much capital.
- Exchange: Stick to the major leagues—the NYSE and NASDAQ. You'll get better regulation and more reliable data.
This first pass might still leave you with hundreds of stocks. Now, it's time to layer in a more dynamic filter to find where the action is today.
Going Beyond Volume with Relative Volume
While average daily volume tells you a stock is generally liquid, relative volume (RVOL) tells you if it's unusually active right now. RVOL is a powerful metric that compares a stock's current trading volume to its normal average for that specific time of day.
A relative volume of 2.0 or higher is a massive tell. It means the stock is trading at twice its normal volume, which screams that something is going on—news, an earnings surprise, or major institutional interest. These are the stocks poised to make big moves.
Picture this: Stock XYZ usually trades about 500,000 shares in the first hour after the opening bell. But today, you notice it's already hit 1.5 million shares in that same first hour. Its RVOL is 3.0. That's a bright, flashing neon sign telling you to pay immediate attention. Big money is moving, and that’s what creates the clean, tradable trends we’re all looking for.
Any decent screener will let you filter by relative volume. Setting it to > 2.0 in your pre-market or early morning scan is one of the single most effective ways to find stocks that are "in play." When you combine high average volume with high relative volume, you get the perfect recipe: a history of solid liquidity mixed with a fresh catalyst for immediate movement.
Finding Opportunity in Market Volatility
While liquidity gets you in and out of a trade, volatility is what actually pays you. No price movement, no profit. Simple as that. Day traders live for these daily swings, but you have to learn that not all volatility is created equal.
Your mission is to hunt for stocks with clean, predictable movement—not the ones flailing around like a fish out of water. Choppy, chaotic price action is just a quick way to get stopped out over and over. We want clean trends and a daily range we can actually work with.
Quantifying a Stock's Daily Movement
Guessing how much a stock might move is a rookie mistake. Thankfully, we have tools that give us cold, hard data on a stock’s typical price action. This is how you separate a real opportunity from a high-risk gamble.
One of the best tools for the job is the Average True Range (ATR). This indicator tells you the average price range a stock has moved over a set period, usually the last 14 days. It basically answers the question, "How much does this thing typically move in a day?"
Let's say a $50 stock has an ATR of $2.50. That tells you it's reasonable to expect about a $2.50 move on any given day. This insight is gold for setting profit targets and stop-losses that make sense. A stock with a tiny ATR probably won't give you enough room to profit, while one with a sky-high ATR might be too wild to handle.
Measuring Volatility Against the Market
Another killer metric is Beta. Beta measures how volatile a stock is compared to the rest of the market, which is usually benchmarked against the S&P 500 index (SPY).
- A Beta of 1.0 means the stock pretty much moves in lockstep with the market.
- A Beta greater than 1.0 tells you the stock is more volatile than the market. For instance, a Beta of 1.5 means it's theoretically 50% more volatile than the SPY.
- A Beta less than 1.0 means it’s less volatile and more stable.
Day traders are often drawn to stocks with a Beta higher than 1.0. Why? Because they offer more bang for your buck. If the S&P 500 is up 1%, a stock with a 1.8 Beta might climb 1.8%, amplifying your potential gains on a strong market day.
Keep in mind, high Beta is a double-edged sword. It juices up your gains when you're right, but it will absolutely magnify your losses when the market turns against you. It’s a tool for finding opportunities, not a get-out-of-jail-free card.
When you combine ATR and Beta, you get a powerful one-two punch. ATR gives you the stock's typical daily dollar movement, while Beta tells you how it dances in relation to the broader market.
Using News as a Volatility Catalyst
Some of the cleanest, most explosive moves are triggered by specific news events. These catalysts inject a shot of adrenaline into a stock, pulling in huge volume and creating the kind of directional trends day traders dream of.
If you can anticipate these events, you gain a massive edge. You're no longer just reacting to price charts; you're getting in front of stocks that are about to become volatile.
Here are the big catalysts to watch for:
- Earnings Reports: This is the Super Bowl for traders. When a company reports its quarterly results, the reaction to a "beat" or "miss" can fuel monster moves for days.
- FDA Announcements: For any biotech or pharma company, news about drug trials or FDA approvals can send a stock soaring or tanking by 50% or more overnight.
- Product Launches or Company News: Think of an Apple (AAPL) iPhone launch or a major partnership announcement. This kind of buzz generates serious interest and trading volume.
- Analyst Upgrades/Downgrades: When a big Wall Street firm changes its rating, traders often pile in, causing a sharp, immediate price reaction.
You can use a financial calendar or set up news alerts to stay on top of these. The goal isn't to guess the outcome but to be ready to trade the price action that follows the announcement.
This is where volatility and volume come together in a big way. A strong catalyst often creates a spike in relative volume—a key metric traders watch. A stock trading at two times its average volume (or more) signals intense interest that often precedes a big move. Historical data confirms that these spikes frequently happen around market-moving events, creating a potent setup. You can dig deeper into how traders use these metrics by exploring insights on picking stocks for day trading on smartasset.com.
By focusing on stocks with a healthy ATR, a suitable Beta, and a clear catalyst, you stop fearing volatility and start using it as your greatest source of opportunity.
Using Technical Analysis to Time Your Trades
You’ve got your watchlist—a solid lineup of liquid, volatile stocks ready for action. Now it’s time to play coach and decide the exact moment to send them into the game.
This is where technical analysis comes in. It’s not about memorizing dozens of complicated indicators. In fact, most pros stick to a small, core set of tools that consistently work. Let's break down the essentials that help you pinpoint entry and exit points with real, data-driven confidence.
https://www.youtube.com/embed/jfaABy0E6r4
Find Your Trend with Moving Averages
The simplest way to get a read on a stock's immediate direction is with Exponential Moving Averages (EMAs). Unlike their slower cousins, simple moving averages, EMAs react faster because they give more weight to the latest price action—exactly what a day trader needs.
The 9-period and 20-period EMAs are a classic, powerful combo.
Think of them as your trend GPS. When the faster 9 EMA crosses and stays above the slower 20 EMA, you've got a clear short-term uptrend. If the 9 EMA dips below the 20, the momentum has shifted bearish. It’s a clean, visual cue that cuts through the noise.
Many traders also use these EMAs as dynamic support or resistance. In a strong uptrend, you’ll often see the price pull back toward the 9 or 20 EMA before bouncing higher, offering a high-probability spot to consider a long entry.
Measure the Momentum with RSI
Once you know the trend, you need to ask: how much gas is left in the tank? That's what the Relative Strength Index (RSI) helps you figure out. RSI is a momentum indicator that measures the speed and change of price movements, scored on a scale from 0 to 100.
It’s best known for its "overbought" and "oversold" signals:
- Overbought (RSI above 70): This hints that buying might be getting a little too heated, and a pullback could be on the horizon.
- Oversold (RSI below 30): This suggests selling pressure is fizzling out, and the stock might be gearing up for a bounce.
A word of caution: Never take RSI signals in a vacuum. A stock in a monster uptrend can stay "overbought" at 80 for a long time. Instead, use RSI for confirmation. For instance, if your stock is in an uptrend (9 EMA > 20 EMA) and pulls back to the 20 EMA while the RSI dips to the 40-50 range before curling back up, that’s a much stronger signal to go long.
These indicators are powerful, but they work best when you can also read the story the price chart itself is telling. To sharpen that skill, check out our guide on how to read candlestick patterns and see what the charts are really saying.
Anchor Your Day with VWAP
If there’s one indicator that big-money institutional traders are watching, it’s the Volume Weighted Average Price (VWAP). VWAP calculates the average price a stock has traded at throughout the day, factoring in both price and volume. In short, it shows you the "true" average price paid.
VWAP becomes a critical benchmark for the entire trading day.
- Price trading above VWAP? Buyers are generally in control.
- Price trading below VWAP? Sellers likely have the upper hand.
For day traders, VWAP is often the line in the sand. You might look for opportunities to buy pullbacks to the VWAP in a strong stock, or initiate a short position if a weak stock tries and fails to reclaim the VWAP from below. It's an objective level that helps you avoid getting chopped up by minor price swings.
Comparing Popular Technical Indicators for Day Trading
Choosing the right tool for the job is half the battle. This table breaks down the most useful indicators, what they do best, and how you can apply them in a real trading scenario.
| Indicator | Primary Use | Best For Identifying | Practical Tip |
|---|---|---|---|
| EMAs | Trend Direction | Short-term uptrends and downtrends; dynamic support/resistance levels. | Watch for the 9-period EMA crossing above the 20-period EMA as a bullish signal for entry. |
| RSI | Momentum | Overbought/oversold conditions; potential trend exhaustion or reversal points. | Use RSI divergences—where price makes a new high but RSI doesn't—to spot weakening momentum. |
| VWAP | Intraday Benchmark | Institutional buying/selling pressure; the "fair value" for the day. | Treat VWAP as a key decision point. A break above can signal bullish control for the day. |
| MACD | Trend & Momentum | Trend changes and the strength of momentum behind a price move. | Look for the MACD line crossing above the signal line for a classic buy signal, especially above the zero line. |
| Bollinger Bands | Volatility | Periods of high vs. low volatility; potential price breakouts or mean reversion. | When the bands squeeze tight, it often signals a big price move is coming. Be ready. |
By combining these indicators, you stop guessing and start building a high-probability case for every trade. It’s this kind of systematic approach that separates consistently profitable traders from the crowd. You’re not just looking at lines on a chart—you’re using a confluence of signals to make smarter, more informed decisions.
Gaining an Edge with Sentiment Analysis
Technical indicators and volume charts give you a fantastic view of a stock's mechanics, but they don't tell the whole story. The stock market is fundamentally driven by people. That means it’s fueled by raw human emotions like fear and greed.
This collective mood, what we call market sentiment, is a powerful force that can hijack short-term price action. Learning to read the room gives you a qualitative edge that charts alone just can't provide. When you get a feel for the narrative swirling around a stock, you can start anticipating its next move instead of just reacting to it.
Decoding the Market's Mood
So, how do you actually measure something as fuzzy as emotion? Sentiment analysis is all about gauging the overall attitude of investors toward a stock or the broader market. Are traders feeling wildly optimistic and piling into positions? Or are they panicking and dumping everything in sight? Knowing the answer helps you decide whether to join the crowd or bet against it.
A classic tool for this is the Fear & Greed Index. It’s a composite indicator that rolls up multiple market factors into a single score, typically from 0 (Extreme Fear) to 100 (Extreme Greed).
- Extreme Fear: This often signals that investors are way too pessimistic. It can be a contrarian's dream, highlighting potential buying opportunities in oversold stocks.
- Extreme Greed: This suggests traders are getting euphoric, which could mean the market is overbought and due for a pullback.
Keeping an eye on this index gives you a quick, data-backed snapshot of the market’s emotional state. It's invaluable context that helps you understand the bigger picture influencing the individual stocks on your watchlist.
Tapping into Real-Time Chatter
These days, sentiment is also forged in real-time on social media and in breaking news headlines. A viral tweet or a major news story can send a stock soaring or tumbling in a matter of minutes.
Monitoring this chatter gives you a ground-level view of what traders are thinking and talking about right now. You can track this by looking for:
- Unusual Spikes in Mentions: When a stock is suddenly being discussed everywhere on platforms like X (formerly Twitter) or Reddit, it can signal a huge surge in retail interest.
- The Prevailing Narrative: Is the news coverage about a company overwhelmingly positive or negative? This shapes perceptions and can easily become a self-fulfilling prophecy for the stock's price.
- Keyword Analysis: Modern tools can scan financial news and social feeds for bullish or bearish keywords tied to a stock, giving you a quantifiable sentiment score.
Imagine a biotech stock is waiting on FDA news. The chart might look dead quiet. But if social media is buzzing with optimistic speculation, you know there’s pent-up demand ready to ignite a massive move on a positive announcement. To get a better handle on this, check out our guide on using sentiment analysis for stocks to read market mood.
Trading With or Against the Crowd
Once you have a read on sentiment, you can use it to build a trading thesis. You really have two ways to play it.
The first is to simply trade with the prevailing sentiment. If a stock has a strong, positive narrative and heavy volume, you can ride that momentum. The crowd becomes your tailwind.
The second, and often more powerful strategy, is to trade as a contrarian. This means you’re on the hunt for moments of emotional overreaction. When the market is gripped by extreme fear and selling off indiscriminately, it can create incredible discounts on perfectly good companies.
On the flip side, when euphoria takes over and a stock goes parabolic, it might be a signal to look for a short entry as the hype eventually dies down. This contrarian approach takes discipline, but it’s where many professional traders find their most profitable setups.
By layering sentiment on top of your technical analysis, you add a crucial dimension to your strategy. You'll start moving from simply reacting to charts to anticipating where the market is headed next.
Got Questions About Picking Day Trading Stocks?
Even when you have a solid strategy on paper, the real world throws curveballs. How many stocks is too many to follow? Is there really a "best" time to trade? Nailing down these practical details is what separates theory from a consistent, profitable routine.
Let's walk through some of the most common questions that trip traders up.
How Many Stocks Should I Actually Watch?
When you're starting out, less is more. Seriously.
Aim for a tight, focused watchlist of just 3-5 stocks. Trying to track dozens is a rookie mistake that leads to analysis paralysis and missed signals. A smaller list lets you learn each stock's unique personality—how it reacts to news, its typical support and resistance levels, and its average daily moves.
Even veteran traders often stick to a small handful of names or a single sector. Why? Because mastery over a few beats mediocre awareness of many.
The bottom line: Quality over quantity. Get to know a few stocks inside and out. It's the only way to build real trading intuition.
Should I Only Trade Large-Cap Stocks?
Yes, especially when you're new to the game. Think of large-cap stocks—companies with market caps over $10 billion—as your training ground. They’re predictable and highly liquid, which is exactly what you need to learn the ropes without getting slaughtered by crazy, unpredictable price swings.
Sure, those small-cap and penny stocks can deliver explosive, headline-grabbing moves. But they come with a ton of baggage you don't want to deal with:
- Low Liquidity: Getting in and out of a trade can be tough without the price moving against you.
- Wide Bid-Ask Spreads: That gap between the buy and sell price is like an invisible fee that just eats away at your profits.
- Insane Volatility: Their movements are often chaotic and random, making risk management a total nightmare.
Master your strategy on stable, well-known names from the S&P 500. Once you're consistently profitable, then you can think about wading into more speculative waters.
When Is the Best Time of Day to Find Trades?
The market has a clear rhythm. Not every hour is a good time to trade.
The real action happens in two key windows: the first 90 minutes after the open (9:30-11:00 AM ET) and the final hour before the close (3:00-4:00 PM ET).
The opening bell unleashes a flood of volume and volatility, driven by overnight news and institutional orders. This early period often sets the tone for the entire day. The closing hour is similar, with another surge of activity as institutions and traders close out their positions, often leading to strong, decisive moves.
That long stretch in the middle of the day? It’s often called the "lunchtime lull" for a reason. It’s usually quiet, choppy, and best avoided if you're just starting out.
How Do I Use a Stock Screener the Right Way?
A stock screener is your best friend for cutting through the noise. It lets you filter thousands of stocks down to a manageable list of real opportunities that fit your specific strategy.
Your pre-market scan, which you should run about 30 minutes before the market opens, is the most critical part of your daily prep.
Here’s a great starting point for your screener settings to find stocks that are already "in play":
- Average Daily Volume: Set it above 1,000,000 shares. This ensures you’re only looking at stocks with enough liquidity.
- Price Range: Stick to what you’re comfortable with. A range like $10 to $200 will weed out penny stocks and ridiculously expensive shares.
- Daily Price Change: Look for stocks already moving. A filter for a change greater than 2% (either up or down) is a good place to start.
- Relative Volume (RVOL): This is your secret weapon. Set RVOL to be greater than 2.0. This finds stocks trading at least twice their normal volume for that time of day, flagging unusual interest and a higher chance of a continued move.
Run this scan every morning, and you'll have a fresh, high-quality watchlist ready to go before the opening bell.
Ready to stop guessing what the market is thinking? The Fear Greed Tracker gives you real-time sentiment scores on over 50,000 assets, so you can see the emotional drivers behind every price move. Transform fear and greed into your greatest trading advantage by making smarter, data-driven decisions today. Explore live market sentiment at https://feargreedtracker.com.