
Before you even think about looking at a single stock chart or financial report, you need a personal investment framework. This is your non-negotiable set of rules, the constitution for your portfolio that guides every single decision.
Without one, you're just reacting. You'll get spooked by market noise, make emotional trades, and chase the latest hot trend—a strategy that almost never pays off. A solid framework keeps you consistent, logical, and focused on what actually matters to you.
Let’s be clear: generic advice is useless here. What works for a 25-year-old saving for a house is completely wrong for a 55-year-old getting ready for retirement. Your life, your goals, your money—that’s the only context that counts.
Building Your Personal Investment Framework
Define Your Financial Goals and Timeline
First things first: what are you investing for? Your answer changes everything. Are you chasing aggressive growth to build wealth over the next few decades? Or do you need steady, reliable income starting next year?
Your goals need to be specific and measurable.
- Long-Term Growth: If retirement is 30 years away, you have the luxury of time. You can take on more risk for a shot at higher returns, focusing on assets with serious growth potential, even if they’re volatile in the short term.
- Medium-Term Savings: Got a five-year plan to buy a house? You'll need a more balanced portfolio. You want a smart mix of growth and stability so the money is there when you need it.
- Short-Term Income: If you're already retired, the game changes. Your top priority is protecting what you have and generating consistent cash flow from things like dividends or bonds.
Your timeline is your single greatest advantage. The data is overwhelmingly clear: time in the market smooths out the bumps. A long-term view dramatically stacks the odds in your favor. Since 1926, the U.S. market has ended the year in the green about 75% of the time. Stretch that to 10-year periods, and the win rate jumps to 95%. Over 20-year periods? 100%. You can explore more about historical market performance and see what it means for long-term investors.
Key Takeaway: A long investment horizon doesn't just boost potential returns; it historically crushes the probability of loss. Patience isn't just a virtue; it's a strategy.
Honestly Assess Your Risk Tolerance
Now for some tough self-reflection. You have to be brutally honest about how much risk you can stomach. Would a 20% drop in your portfolio have you staring at the ceiling all night? Or do you see dips as buying opportunities?
Your risk tolerance isn't just about your financial ability to absorb a loss; it's about your emotional wiring. Getting this wrong is a classic rookie mistake—it’s how people end up panic-selling at the bottom and FOMO-buying at the top.
This simple framework—your goals, timeline, and true risk tolerance—is the lens you'll use to evaluate every investment opportunity from here on out.
Decoding a Company's Financial Health

To really get a feel for an investment, you have to look past the stock ticker and the noise from the daily news cycle. The real story of any business is written in its numbers. This is what we call fundamental analysis—digging into a company’s financial and economic health to figure out its true, underlying value.
Think of a company's financial statements as its report card. The income statement, balance sheet, and cash flow statement are the three core documents that show you everything from performance and stability to how efficiently it’s running. Learning to read them isn't optional; it's a must-have skill for any serious investor.
Mastering the Language of Financial Statements
Each statement gives you a different piece of the puzzle. The income statement lays out profitability over a specific period, detailing all the revenues and expenses. The balance sheet is more like a snapshot, showing you exactly what the company owns (assets) and what it owes (liabilities) on a single day.
Then there’s the cash flow statement. This one tracks how actual cash moves in and out of the business, breaking it down into operating, investing, and financing activities. I pay close attention to this one because it's much harder to fudge than earnings. It tells you if a company is actually generating cold, hard cash.
For example, I've seen companies report huge profits on their income statement but have negative cash flow from their core operations. That's a massive red flag. It tells me their "profits" aren't turning into money in the bank—a situation that's completely unsustainable.
Using Financial Ratios to Uncover Insights
Just reading the raw statements is only the first step. The real magic happens when you use that data to calculate financial ratios. These ratios turn a bunch of abstract numbers into powerful, comparable insights. They're perfect for benchmarking a company against its competitors or even its own past performance.
Here are a few of the most important ratios I always look at:
- Price-to-Earnings (P/E) Ratio: This classic metric compares the stock price to its earnings per share. A high P/E might mean the stock is overvalued, or it could signal that investors are betting on big future growth. A low P/E could point to an undervalued gem or a company with serious problems.
- Debt-to-Equity Ratio: This shows you how much leverage a company is using by dividing its total debt by shareholder equity. A high ratio isn't always bad, but it means the company is relying heavily on debt to grow, which can get risky fast, especially when the economy sours.
- Return on Equity (ROE): ROE tells you how well management is using investors' money to make a profit. I love to see a consistently high ROE—something like 15% or more—as it often points to a well-run business with a solid competitive edge.
To help you get started, here's a quick reference table for some of the most essential financial ratios.
Key Financial Ratios for Investment Evaluation
| Ratio Name | What It Measures | Formula | What to Look For |
|---|---|---|---|
| Price-to-Earnings (P/E) | Market's valuation of earnings. | Market Price per Share / Earnings per Share (EPS) | Compare to industry average and historical levels. |
| Debt-to-Equity | Company's financial leverage. | Total Liabilities / Shareholder Equity | Lower is generally safer; industry context is key. |
| Return on Equity (ROE) | Profitability relative to equity. | Net Income / Shareholder Equity | Consistently above 15% often indicates a strong business. |
| Price-to-Book (P/B) | Market valuation vs. book value. | Market Price per Share / Book Value per Share | Below 1.0 may suggest undervaluation. |
| Current Ratio | Short-term liquidity. | Current Assets / Current Liabilities | Above 1.0 is preferred; too high can be inefficient. |
These ratios are your diagnostic tools. They help you quickly size up a company's profitability, solvency, and efficiency.
Key Takeaway: Financial ratios are your diagnostic tools. They help you quickly assess a company's profitability, solvency, and efficiency, allowing you to spot both strengths and weaknesses that aren't obvious on the surface.
Ultimately, the goal of this deep dive is to figure out what the business is actually worth. This idea, called intrinsic value, is the bedrock of value investing. To see how the math works, check out our guide on how to calculate intrinsic value for investors.
Looking Beyond the Numbers at Qualitative Factors
A solid evaluation doesn't end with a spreadsheet. Quantitative analysis tells you what happened, but qualitative analysis helps you understand why it happened and what's likely to happen next. These are the intangibles you won't find on a balance sheet but can make or break a company long-term.
Think about a company's competitive advantage—its "economic moat." Does it have a brand so powerful it commands loyalty and premium prices, like Apple? Does it have network effects like Meta, where the platform gets more valuable as more people join? Or is it a low-cost leader like Walmart?
A wide, durable moat is what lets a company keep competitors at bay and earn high returns for years. Without one, even a profitable business is vulnerable.
The Importance of Leadership and Vision
The quality of the management team is just as crucial. Are they visionary leaders with a clear strategy, or are they just trying to hit the next quarterly target? I look for leaders who are honest with shareholders, have a history of smart capital allocation, and have a lot of their own money invested in the company. "Skin in the game," as they say.
A perfect real-world example is Microsoft under Satya Nadella. When he became CEO in 2014, the company felt stuck. His strategic pivot to cloud computing with Azure and a more collaborative culture completely turned the ship around, creating incredible value for shareholders. That was a qualitative shift that no financial ratio could have predicted.
When you combine tough quantitative analysis with a thoughtful look at these qualitative factors, you build a complete, three-dimensional picture of an investment. This balanced approach is your best defense against buying into hype and your best tool for finding truly great businesses built for the long haul.
Reading the Mood of the Market
So, you've done your homework and analyzed a company's financial health. It's easy to stop there and think the job is done. But here's a hard truth I've learned over the years: a great business bought at the wrong price can quickly turn into a poor investment. This is where you need to start reading the room—and by room, I mean the entire market.
Understanding market sentiment, which is really just the collective mood of investors, is a powerful tool. It acts like an emotional overlay on top of all that solid, fundamental value you just researched.
When everyone is overwhelmingly optimistic (greedy), prices can completely detach from reality and soar into bubble territory. But when pessimism (fear) takes hold, even the best companies get thrown out with the bathwater, creating some absolutely fantastic buying opportunities.
Using Technicals to Gauge Momentum
While fundamental analysis tells you what to buy, technical analysis helps you figure out when. It's about reading the market's current psychology through price charts and indicators. Think of it less like predicting the future and more like understanding the present momentum.
A few key indicators give you a clean, visual snapshot of what other investors are doing:
- Moving Averages (MAs): These smooth out the daily price noise to show you the underlying trend. The 50-day and 200-day moving averages are the ones most traders watch. When the shorter-term 50-day MA crosses above the 200-day MA (a "golden cross"), it's often a sign of bullish momentum. A cross below (a "death cross") can signal a bearish shift.
- Relative Strength Index (RSI): This is a momentum gauge that measures the speed and change of price movements on a scale of 0 to 100. A reading above 70 is generally considered "overbought," hinting that the stock might be due for a pullback. A reading below 30 is "oversold," which could mean a bounce is on the horizon.
These aren't crystal balls, of course. But they provide crucial context. If a company has rock-solid fundamentals but its RSI has been sitting above 80 for weeks and the price is miles above its moving averages, you might want to wait for a better entry point.
Interpreting Broader Market Sentiment
Beyond just one stock, you have to get a feel for the mood of the entire market. This is where sentiment tools are a game-changer. They pull together a ton of different data points into a single, easy-to-read score.
The most famous of these is the Fear & Greed Index. It combines seven different indicators—like market momentum, stock price strength, and junk bond demand—into a score from 0 (Extreme Fear) to 100 (Extreme Greed).
Expert Insight: As Warren Buffett famously said, "Be fearful when others are greedy and greedy when others are fearful." The Fear & Greed Index is a practical way to actually quantify this advice, helping you lean against whatever emotional tide is sweeping the market.
This screenshot gives you a real-time look at the market's emotional state.

When that needle is pointing way over toward "Extreme Greed," it's a clear signal of widespread euphoria. That's usually a warning sign that a market correction could be just around the corner.
A high "Greed" reading doesn't mean you should immediately sell everything you own. Instead, see it as a signal to be more cautious. Maybe it's time to trim some overextended positions or hold off on making new buys.
On the flip side, when the index shows "Extreme Fear," it points to widespread panic and potential capitulation—often the point of maximum opportunity for disciplined, long-term investors. To get a better handle on this, you can check out our deep-dive guide that explains what market sentiment is and how to measure it effectively.
Ultimately, adding market sentiment to your process is about layering tactical awareness onto your strategic, fundamental research. It helps you sidestep the two costliest emotional mistakes: buying into euphoric tops and panic-selling into fearful bottoms. By understanding the market's mood, you give your well-researched investments the best possible chance to succeed.
Conducting a Realistic Risk Assessment
It’s easy to get swept up in the thrill of potential returns. We’ve all been there. But seasoned investors know the real work starts with a sober look at what could go wrong. Honestly, understanding the downside is far more important than fantasizing about the upside. A realistic risk assessment is your financial shield. It protects your capital from nasty surprises and keeps your emotions from running the show.
This isn't about being pessimistic; it's about making sure the potential reward truly justifies the dangers involved. Every single investment carries risk, but not all risks are created equal. Learning to spot them, categorize them, and plan for them is a non-negotiable step in evaluating any opportunity.
Identifying the Different Types of Risk
Investment risk isn't some big, scary monolith. It comes in different flavors, and you need to look at each one to get the full picture. If you don't distinguish between them, you can leave your portfolio exposed in ways you never saw coming.
You have to look beyond just the company itself and consider the entire financial environment. Here are the main categories to keep on your radar:
- Market Risk (Systematic Risk): This is the big one that can hit everything. Think of a recession, geopolitical turmoil, or a surprise interest rate hike. You can't just wish it away, but you can definitely prepare for it.
- Company-Specific Risk (Unsystematic Risk): These are the threats unique to one business. It could be anything from a botched product launch and a nasty lawsuit to just plain bad management. This is the type of risk you can actually manage through solid research and diversification.
- Liquidity Risk: This one’s sneaky. It’s the danger of not being able to sell an asset quickly without taking a massive haircut on the price. It's a huge issue with things like real estate or shares in small, thinly-traded companies. If you need your cash back in a hurry, an illiquid asset can feel like a trap.
Stress-Testing Your Investment Thesis
Once you’ve got a handle on the potential risks, it's time to put your investment idea under pressure. This is where scenario analysis, or "stress-testing," comes into play. Instead of just hoping for the best, you actively model the worst-case scenarios.
Start asking yourself the tough "what if" questions. For example, if you’re looking at a hot tech stock that relies on consumer spending, what happens to its revenue if a recession hits and unemployment jumps to 8%? Or if you're eyeing a utility company, how would a sudden 2% spike in interest rates affect its ability to handle its debt?
Actionable Tip: Fire up a simple spreadsheet and create three columns: "Best Case," "Base Case," and "Worst Case." Project key metrics like revenue, earnings, and stock price for each. This little exercise forces you to put a number on the potential downside and shifts your analysis from wishful thinking to tactical planning.
The Power of Smart Diversification
You can't control the market, but you absolutely can control how you spread your risk. This is where diversification becomes your best friend. It’s the single most powerful tool for protecting your portfolio from isolated shocks. And it’s about more than just owning a bunch of different stocks—it’s about owning different types of assets that don't all move in the same direction.
This means you need to diversify across:
- Asset Classes: A healthy mix of stocks, bonds, real estate, and maybe some commodities can act as a buffer. When stocks are having a bad year, bonds might be stable or even up.
- Geographies: Don't put all your eggs in one country's basket. Adding international stocks can shield you from a downturn that’s only happening in your home market.
- Industries: Owning shares across tech, healthcare, consumer staples, and industrials ensures that a crisis in one sector doesn't torpedo your entire portfolio.
By systematically assessing risk, stress-testing your assumptions, and diversifying intelligently, you build a portfolio that can weather the inevitable storms. For a deeper dive into protecting your assets, check out our guide on the 9 best practices for risk management in 2025. This proactive approach turns risk from something to fear into a calculated variable you can manage.
Creating Your Actionable Evaluation Checklist
Theory is great, but what really drives consistent results is a repeatable process. After you've sized up a company's health, checked the market's mood, and weighed the risks, it's time to pull it all together. A solid checklist is what turns a pile of research notes into a powerful evaluation tool that keeps your emotions in check.
This isn't about finding some magic formula. It’s about building a structured framework that forces you to look at every critical angle before putting your hard-earned money on the line. A good checklist makes sure you never skip a crucial step, especially when a "hot" stock has everyone buzzing.
Building Your Investment Scorecard
The heart of your process should be an investment scorecard. It’s a simple but incredibly effective tool where you grade an opportunity against the criteria that matter to you. This turns a messy, complex decision into a clear, quantified assessment, letting you compare different investments on an apples-to-apples basis.
Your scorecard should hit the four main pillars of any solid evaluation:
- Fundamental Strength: How healthy is the business, really? You'll want to look at things like revenue growth, profitability (think Return on Equity or ROE), and how much debt they're carrying.
- Valuation: Is the price right? Check its P/E and P/B ratios against its industry peers and, just as importantly, against its own history.
- Risk Profile: What could sink this ship? Think about company-specific threats, broader market risks, and how it might hold up if things go south.
- Personal Alignment: Does this investment actually fit your goals and timeline? A fantastic company can be a terrible investment if it doesn't align with what you're trying to achieve.
My Personal Tip: I use a simple 1-5 scale for each category. If any single category scores below a 3, that’s an immediate red flag for me. It means I need to dig much, much deeper. An investment has to score well across the board before I'll even consider it.
To help you get started, here's a template you can adapt. The goal is to be brutally honest with your scoring.
Your Investment Evaluation Scorecard
| Evaluation Category | Key Questions to Ask | Score (1-5) | Notes |
|---|---|---|---|
| Fundamental Strength | Is revenue growing? Is it profitable (ROE, margins)? Is debt manageable? | e.g., "Solid revenue but margins are shrinking." | |
| Valuation | Is the P/E ratio fair compared to peers and its own history? What about P/B or P/S? | e.g., "P/E is 45x, 50% above industry avg." | |
| Risk Profile | What are the biggest competitive threats? Any regulatory risks? How would it fare in a recession? | e.g., "Heavy competition from three major players." | |
| Personal Alignment | Does this fit my long-term growth goals? Am I comfortable with the volatility? | e.g., "Perfect for my 20-year timeline." |
Filling this out for every potential investment forces discipline and clarity into your decision-making.
Documenting Your Investment Thesis
Before you even think about clicking "buy," you need to write down your investment thesis. This is just a short, clear summary—a paragraph or two is plenty—explaining exactly why you're making this investment. What's the core belief you have about this company that you think the market is missing or undervaluing right now?
Think of this document as your anchor in a storm. When the market gets choppy and fear or greed start messing with your head, your written thesis is the rational voice that reminds you why you bought in. It's the thing that stops you from panic-selling a solid company during a dip or, just as bad, holding on to a loser long after the original story has fallen apart.
This flow is a great way to visualize how you can assess potential threats before they ever hit your portfolio.
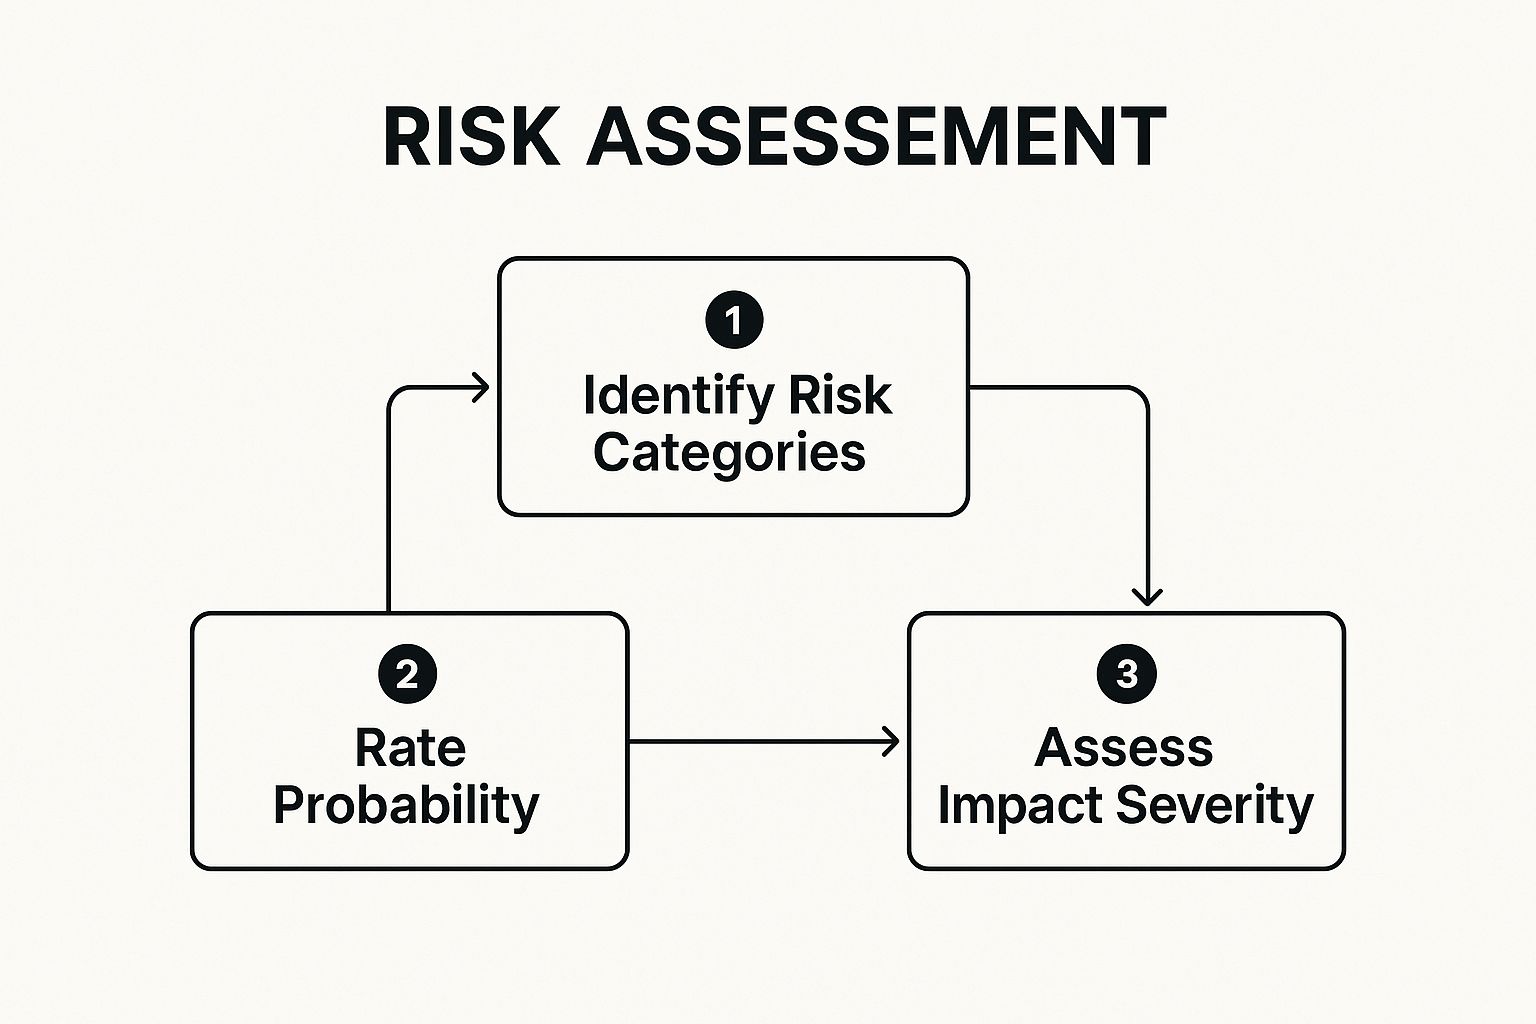
This structured approach helps you move from just spotting risks to truly understanding their potential impact, which is a game-changer for a complete evaluation.
Applying the Checklist: A Quick Case Study
Let's walk through a real-world scenario. Imagine you're looking at a big tech company, "Innovate Corp.," in early 2024.
- Fundamentals (4/5): The company is putting up strong numbers. Revenue growth is a healthy +15% year-over-year, ROE is a solid 22%, and its debt is under control. The business looks good.
- Valuation (2/5): Here's the problem. Its P/E ratio is sitting at 45x, way above its 5-year average of 28x and the industry average of 25x. This is a major red flag—the stock looks expensive.
- Risk Profile (3/5): It's in a tough neighborhood, facing intense competition and the threat of more regulation. A mild recession would likely slow its growth, though its strong balance sheet gives it a buffer.
- Personal Alignment (5/5): You're a long-term growth investor with a 20-year horizon. The company's focus on innovation fits your goals perfectly.
Your final scorecard clearly shows a fundamentally great company that fits your strategy but is priced for perfection. So, your thesis might sound something like this: "Innovate Corp. is a leader in its field with a strong competitive moat, but its current price leaves no room for error. I'm adding it to my watchlist and will wait for a market pullback that brings its valuation to a more reasonable level, ideally a P/E below 30x."
This systematic approach gives you a clear, documented decision, not an emotional reaction. It also establishes a clear entry point, turning you from a reactive gambler into a patient, strategic investor. This kind of discipline is what separates the consistently successful from the rest of the pack.
Remember to keep performance variability in mind, too. The S&P 500's long-term average annual return is about 8.55% since 1928, but the last 10 years saw an average of 11.01%. History also shows that U.S. and international stocks tend to take turns outperforming each other, often in 8-year cycles. Knowing this helps set realistic expectations. You can discover more insights about stock market return cycles on carry.com to get a better feel for these patterns.
Common Questions Answered
When you're building a solid investment framework, questions are a good sign. It means you're thinking critically. Here are some of the most common ones that come up, along with straight-to-the-point answers.
How Much Time Should I Really Spend Analyzing One Investment?
There's no magic number here. For a serious, long-term position, a thorough analysis can easily take several hours spread out over a few days or even weeks. This is deep work—you're reading annual reports, dissecting financial statements, and really getting to know the competitive landscape.
If you're just starting, it's far better to spend a lot of time on a few high-quality evaluations than to rush through a dozen. You'll get faster with experience, but don't ever sacrifice depth for speed.
If You Had to Pick One, What's the Most Important Thing to Look For?
While a full evaluation is a must, if I had to pick one thing, it would be a strong and durable competitive advantage. You'll often hear this called an "economic moat." It's what gives a company a unique, defendable edge over its rivals, protecting its long-term profits and market share.
A great business with a wide moat, bought at a fair price, is the bedrock of successful long-term investing. Things like valuation and market sentiment will always fluctuate, but a true competitive advantage is what creates real, lasting value.
Can I Just Use Financial Ratios to Evaluate a Company?
Absolutely not. Relying only on ratios is a classic—and costly—rookie mistake. They give you a great quantitative snapshot, a picture of a company's health in numbers, but they have zero context.
Ratios can't tell you about the quality of the leadership team, the power of its brand, or if a disruptive new competitor is about to eat its lunch. A solid evaluation always marries the quantitative (the numbers) with the qualitative (the story). The numbers show you what has happened; the story helps you figure out what's likely to happen next.
How Do I Deal With a Super Volatile Market?
This is where your evaluation framework becomes your best friend. In a volatile market, the key is to focus on long-term fundamentals, not the short-term noise and panic. Sharp downturns often create incredible opportunities to buy fantastic companies at a steep discount.
Your risk assessment should always stress-test how a company might hold up during a recession. Stick to your principles, follow your checklist, and don't let the market's fear or greed dictate your decisions.
Ready to stop guessing and start making data-driven decisions? The Fear Greed Tracker gives you real-time sentiment scores on over 50,000 assets, helping you spot opportunities others miss. See the market's mood instantly and turn fear into your advantage.