
Finding a truly undervalued stock—a great company selling for less than it’s worth—is the holy grail of investing. This is how long-term wealth gets built. The secret is to think like a business owner, not a speculator, zeroing in on a company's real health instead of getting distracted by short-term market noise.
Getting that mindset right is the real first step.
Adopting the Value Investing Mindset
Before you even think about financial ratios or stock screeners, you have to get your head in the right place. Value investing isn't about chasing hot tips or trying to perfectly time the market's swings.
It’s about patiently finding quality businesses that are just temporarily out of favor. This creates a gap between the market price (what it costs to buy a share) and its intrinsic value (what the business is actually worth).
Your entire goal is to find and exploit that gap. Think of it like a seasoned art collector who ignores auction hype. They're busy assessing the artist's skill, the piece's history, and its real cultural value. You need to do the same—look right past the daily stock chart and analyze the business itself.
To really nail this, we need to build our analysis on a few core pillars. These are the principles that guide your research and help you spot a genuine bargain while avoiding a "value trap"—a stock that's cheap for a very good reason.
Before we dive into the specific metrics and tools, let's lay out the foundation for our analysis. These three pillars are the bedrock of any solid value investing strategy.
Core Pillars of Undervalued Stock Analysis
| Analysis Pillar | What It Tells You | Key Metrics to Watch |
|---|---|---|
| Intrinsic Value | What a business is truly worth, separate from its stock price. | Discounted Cash Flow (DCF), Price-to-Earnings (P/E), Price-to-Book (P/B) |
| Margin of Safety | The discount you get when buying below intrinsic value—your buffer against error. | The percentage difference between your calculated value and the current market price. |
| Business Fundamentals | The company's long-term health and competitive strength. | Revenue Growth, Profit Margins, Return on Equity (ROE), Debt-to-Equity |
This framework isn't just theory; it keeps your decisions grounded in logic rather than emotion. Now, let's explore why this disciplined approach works so well over the long haul.
The core idea is simple: A stock is not just a ticker symbol; it is an ownership interest in an actual business, with an underlying value that does not depend on its share price.
This disciplined approach isn't just a feel-good strategy—it has a proven track record. Research covering the U.S. stock market from 1927 to 2022 shows that value stocks delivered an average annual excess return of about 4.4% over growth stocks.
You can dig into the historical trends and performance data yourself over at Dimensional Fund Advisors. That consistent, long-term outperformance is exactly why mastering this mindset is such a powerful tool for building real wealth.
Mastering the Key Valuation Metrics

Alright, with the right mindset locked in, it's time to get your hands dirty with the numbers. Financial metrics are your toolkit for figuring out a company's health and whether its stock is a genuine bargain.
Think of them like a doctor checking vital signs. No single number tells the whole story, but together, they paint a clear picture of a company's health—or distress.
The goal isn’t just to find low numbers. It’s about understanding the context behind them. A "good" P/E ratio in the tech world could look disastrous for a manufacturing company. That's why comparing a business to its direct competitors is always more insightful than stacking it up against the entire market.
Decoding the Price-to-Earnings Ratio
The Price-to-Earnings (P/E) ratio is usually the first stop for any value investor. It’s a simple calculation: just divide the company's stock price by its earnings per share (EPS). In plain English, it tells you how much you’re paying for every dollar the company earns.
A low P/E can be a huge red flag that a stock is trading at a discount. In September 2025, for instance, a few S&P 500 companies had P/E ratios way below the typical market average of 15-20. Comcast Corp (CMCSA) was sitting at a trailing P/E of just 5.24. Others like Charter Communications (7.14) and Devon Energy (7.81) were in a similar boat, as noted by NerdWallet.
But a low P/E is just a clue, not a conclusion. You have to ask why it's so low. Did the market just overreact to some short-term bad news? Or is the company in a fundamental nosedive?
Going Deeper with Book Value and Debt
The P/E ratio is a great starting point, but it's only one piece of the puzzle. To really see what's going on, you have to pop the hood and look at the balance sheet. Two other metrics are absolutely critical here:
- Price-to-Book (P/B) Ratio: This compares the company's market cap to its book value (what's left after you subtract all liabilities from assets). A P/B ratio under 1 means you could theoretically buy the company for less than its net assets are worth.
- Debt-to-Equity (D/E) Ratio: This shows you how much debt a company is using to finance its assets. A high D/E ratio can be a warning sign that a company is overleveraged and taking on too much risk.
A low P/E might catch your eye, but a strong balance sheet with low debt and a solid book value is what gives you the confidence to invest. It’s the difference between buying a cheap car and buying a quality car for a cheap price.
These numbers help you understand a company’s real worth, separate from the market's daily mood swings. Ready to take the next step? Our guide on how to calculate intrinsic value dives even deeper into these valuation techniques. By combining these different ratios, you build a much stronger case for whether a stock is a true hidden gem.
Using Market Sentiment to Your Advantage
Valuation metrics are crucial, but they only tell you part of the story. Let's be real: the stock market isn't just a spreadsheet. It's a chaotic mix of numbers and human emotion, and that's where market sentiment comes in. It can be an incredibly powerful contrarian tool for sniffing out undervalued gems.
Any seasoned investor will tell you that widespread fear often breeds the best buying opportunities. When panic grips the market, even fantastic, well-run companies get thrown out with the bathwater. Their stock prices get hammered down, far below what they're actually worth. The goal is to learn how to spot that moment of peak pessimism and act decisively when everyone else is running for the exits.
Reading the Market's Mood
So how do you get a read on the collective psyche of the market? One of the best tools I've found for this is the CNN Fear & Greed Index. It’s brilliant because it takes seven different indicators—things like market momentum, stock price strength, and put/call options—and boils them all down into one simple score, from 0 to 100.
A high score signals "Greed," which is a heads-up that the market might be overbought and due for a pullback. On the flip side, a low score points to "Fear" or even "Extreme Fear." For a value investor, that's the signal you've been waiting for—it often means assets are oversold and potentially undervalued.
Here’s a snapshot of the index. It gives you an instant visual on where things stand.
With just a glance, you know whether investors are feeling bullish or bearish. It’s your first clue to identifying those moments of maximum pessimism.
Turning Fear into Opportunity
Now, using sentiment as a contrarian indicator isn't about trying to time the market's absolute bottom—that's a fool's errand. Instead, it’s about recognizing when the odds have dramatically shifted in your favor.
When the Fear & Greed Index plunges into "Extreme Fear" territory (usually a score below 25), it's time to put on your detective hat and start hunting for bargains. This is the point where emotional, knee-jerk selling has likely dragged solid companies down to irrationally cheap prices.
As Warren Buffett famously said, "Be fearful when others are greedy and greedy when others are fearful." This isn't just a catchy phrase; it's a practical roadmap for finding those rare periods when high-quality stocks are essentially on sale.
By pairing this sentiment analysis with the fundamental metrics we've already covered, you can build a really compelling investment case. Think about this combination:
- The Sentiment Signal: The market is screaming "Extreme Fear."
- Your Fundamental Check: You've found a company with a low P/E ratio, a rock-solid balance sheet, and a healthy D/E ratio.
This one-two punch is the classic setup for a successful value investment. You're not just buying a statistically "cheap" stock; you're buying a quality business at a moment of maximum market panic.
If you want to get a better handle on this, check out our deep dive on using sentiment analysis for stocks to read market mood. Getting this skill down gives you a serious edge.
How to Use Stock Screeners to Find Hidden Gems
Trying to analyze thousands of stocks one by one is a surefire way to get overwhelmed. It’s an impossible task. That’s where stock screeners come into play. These are powerful tools that do the heavy lifting for you, filtering the entire market based on the exact criteria you care about.
Think of a screener as a highly specialized search engine for finding potentially undervalued stocks. Instead of drowning in an ocean of data, you can instantly narrow your focus to a manageable list of companies that actually fit your value investing framework. This saves an incredible amount of time and points your research efforts where they'll make a real difference.
Setting Up Your First Value Screen
Let's build a practical screen using criteria you can find on most free platforms, like Finviz or Yahoo Finance. The goal here is simple: find financially healthy companies that appear to be trading at a discount.
Here are the specific filters I like to start with to hunt for promising candidates:
- P/E Ratio: Set this to "Under 15." This immediately filters for companies that are cheaper relative to their earnings compared to the historical market average.
- Debt/Equity Ratio: Set this to "Under 0.5." This helps you find businesses that aren't drowning in debt, which points to greater financial stability and lower risk.
- Revenue Growth (Past 5 Years): Set this to "Positive." It's common sense—you want to see companies that are actually growing their sales over time, not shrinking.
- Market Capitalization: Set this to "Over $2 billion." This focuses the search on larger, more established companies and weeds out the smaller, more speculative businesses.
This combination of filters is designed to surface companies that are both cheap and fundamentally sound—that’s the sweet spot for a value investor. After running this screen, you won't have a final "buy" list, but you will have a high-quality list of prospects ready for a deeper dive.
A stock screener doesn't give you the answers, but it dramatically improves the quality of the questions you ask. It shifts your job from finding a needle in a haystack to simply examining a handful of needles.
Once you have your initial list, the real work begins. A deeper analysis, like a Discounted Cash Flow (DCF) model, is a great next step to estimate a company's intrinsic value. This model gives you a solid framework for figuring out a stock's actual worth based on its future earnings potential.
The infographic below breaks down the core steps of a DCF valuation.
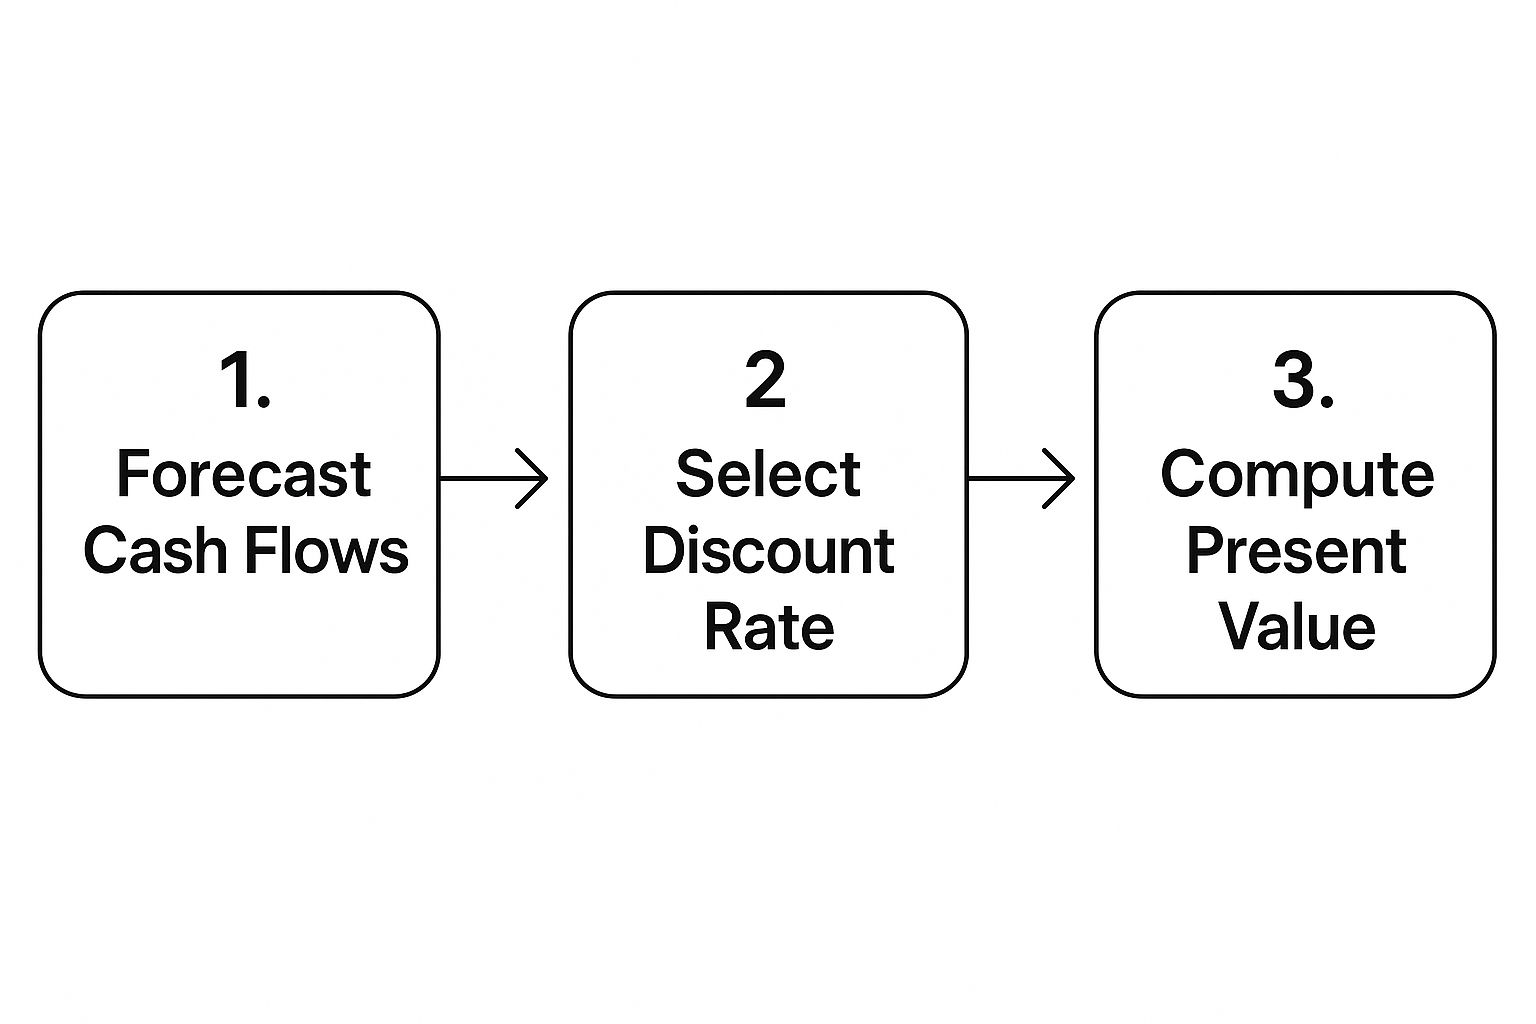
This process helps you move from a broad screen to a precise valuation, giving you a concrete estimate of what a stock should be worth.
There are many powerful tools out there that can help you perform this kind of detailed analysis. To see which platforms offer the best features, check out our guide on the 12 best free stock analysis software you can start using today. By combining a good screener with solid analytical software, you create a systematic process for consistently finding undervalued stocks.
Looking Beyond the Numbers to Avoid Value Traps
So you've run your screens. You’ve got a short list of stocks with tantalizingly low P/E ratios and what look like rock-solid balance sheets. All the numbers check out.
But this is exactly where so many aspiring investors stumble. They stop digging. A low stock price doesn't automatically mean you've found a bargain; sometimes, a stock is cheap for a very, very good reason. This is the classic value trap.
A value trap looks undervalued on paper, but in reality, it's a business in terminal decline. Maybe it’s losing market share, its technology is becoming obsolete, or it's saddled with incompetent management. To avoid these portfolio-killers, you have to get out of the spreadsheet and do some real qualitative analysis. It’s all about understanding the story behind the numbers.
Assessing the Competitive Moat
Your first job in qualitative analysis is to find the company's competitive advantage—what Warren Buffett famously calls its "moat." A moat is that durable edge that protects a company from rivals, allowing it to keep banking profits year after year.
What does a strong moat actually look like?
- Brand Strength: Just think of Coca-Cola. That brand is so powerful it lets them charge more and keeps customers fiercely loyal. It's incredibly hard for anyone else to make a dent.
- Network Effects: Companies like Meta Platforms (Facebook) or Visa get more valuable the more people use them. This creates a massive barrier for any newcomer trying to compete.
- Switching Costs: If it’s a huge pain for customers to leave, you’ve got a moat. Consider enterprise software from giants like Oracle or Microsoft; ripping out and replacing an entire corporate system is a costly nightmare.
- Cost Advantages: A company like Walmart can consistently offer lower prices because its massive scale and hyper-efficient supply chain give it an edge its rivals can't match.
If you can't explain a company's moat in a sentence or two, that’s a huge red flag. A business without a real protective advantage is vulnerable, making it a poor long-term bet no matter how cheap the stock looks today.
A truly undervalued stock belongs to a good company that is temporarily out of favor, not a bad company on its way to zero. Qualitative analysis is how you tell the difference.
Scrutinizing Leadership and Vision
A fantastic business can be driven straight into the ground by bad management. That's why evaluating the leadership team is non-negotiable. Don't just glance at their resumes; dig into their track record. How have they allocated capital in the past? Do they have a clear, coherent vision for where the company is headed?
The best place to start is the company's annual report (Form 10-K), specifically the "Management's Discussion and Analysis" (MD&A) section. Read it carefully. Is management upfront about challenges, or is the report filled with corporate jargon and excuses? Honest, transparent leadership is often a sign of a healthy company culture.
Market downturns are actually the perfect time for this kind of detective work. The stock market moves in cycles, and a historical look at the S&P 500 since 1957 shows six major bull and bear markets. During those bear markets, it’s not uncommon for the index to drop by 20% or more, creating widespread opportunities to buy great companies run by great leaders at a serious discount. You can see these trends for yourself over at Guggenheim Investments.
When you combine strong numbers with a deep understanding of a company’s moat and its leadership, you can confidently tell a true hidden gem from a dangerous value trap.
Got Questions About Value Investing? We've Got Answers
As you dive into value investing, you're going to have questions. It's only natural. This isn't just a numbers game; it requires a mix of sharp analysis and the right mindset. Clearing up the common hang-ups early on can save you a lot of money and give you the confidence to stick with it.
Let's get straight to it and tackle some of the biggest questions I hear from people learning how to find undervalued stocks. The goal here is simple: direct, no-fluff answers you can start using right away.
What’s the Biggest Mistake Beginners Make?
By far, the most common mistake is confusing a cheap stock with a good value. Just because a stock has a low price doesn't make it a bargain. More often than not, it's cheap for a reason—the business is a mess, drowning in debt, or getting steamrolled by competition. That’s what we call a "value trap."
To sidestep this trap, you have to look beyond the numbers. A low P/E ratio is a starting point, not the whole story. You need to ask yourself why it's cheap.
- Does this company have a real, lasting edge over its rivals?
- Is the leadership team actually good at what they do?
- Is the entire industry shrinking or stable?
A true bargain is a great company that's just having a bad month. A value trap is a bad company on a one-way trip to zero.
Remember this key distinction: A truly undervalued stock is a high-quality business on sale. A value trap is a low-quality business that deserves its low price.
How Long Should I Plan to Hold an Undervalued Stock?
Look, value investing is a marathon, not a sprint. It can easily take months—or even a few years—for the rest of the market to wake up and see the value you spotted.
There’s no magic number, but I’d say a holding period of 3-5 years is a solid baseline for a value play to pan out. The whole point is to hold on until the stock price finally reflects what the company is actually worth. Patience is non-negotiable. If you did your homework, you need the guts to wait out the market's mood swings without hitting the panic button.
Can You Find Undervalued Stocks in Any Kind of Market?
Absolutely, but where you look depends on how the market is feeling. It's a whole lot easier during a major downturn or a bear market. When everyone is panicking, they sell everything, including fantastic companies. Those are the moments when bargains are everywhere.
When the market is soaring in a bull run, finding a real deal is tougher. Valuations get stretched, and everything looks expensive. But even then, you can still find pockets of opportunity. An individual stock or an entire sector might get unfairly punished because of:
- A single bad earnings report that everyone overreacted to.
- Some temporary negative headlines.
- Analysts ignoring it because they're chasing the latest hot trend.
This is when stock screeners become your best friend, helping you uncover those hidden gems everyone else missed. The opportunities are always out there if you know how and where to look.
Ready to turn market fear into your strategic advantage? At Fear Greed Tracker, we provide real-time sentiment scores for over 50,000 assets, helping you identify moments of peak pessimism—often the best time to find undervalued stocks. Track sentiment, analyze fundamentals, and get alerts when the mood shifts for your favorite assets. Start making data-driven decisions today.