
The double top pattern is one of the most classic and reliable signals in a technical trader's toolkit. When you see it, it’s a big, flashing warning sign. It looks just like the letter 'M' on a price chart, and it tells a very specific story: an asset has tried to push higher, hit a ceiling, and failed. It tried again, hit the same ceiling, and failed again.
This repeated failure is a huge clue. It suggests the buying pressure that drove the price up is fizzling out. The momentum is shifting, and a downtrend might be just around the corner.
Decoding the Double Top Pattern

Think of it like an army trying to take a hill. The buyers are the army, and they’ve been charging uphill, creating a nice, strong uptrend. They reach a high point (the first peak) but are beaten back by a wall of sellers. They retreat to regroup in the valley below.
Feeling optimistic, they launch a second assault. But they run out of steam at the exact same high point as before. This second failure is critical. It shows the buyers have lost their nerve and their strength. Now, the sellers at the top of the hill have the advantage and are ready to push the price all the way back down.
This M-shaped pattern is so widely recognized because it visually captures this shift in market psychology. Understanding its pieces is the key to spotting these potential reversals before they fully play out.
The Four Core Components
A true double top isn't just any 'M' shape. It has four distinct parts that must be in place for the pattern to be valid.
The First Peak: This marks the highest point of the uptrend. After a strong run, buyers hit a wall of resistance, and the rally pauses.
The Valley (Trough): With the momentum stalled, some traders take profits, and sellers step in. This pushes the price down to a temporary low, forming the valley. This low point is incredibly important.
The Second Peak: The bulls give it one more shot. They try to push the price to new highs, but they just don't have the firepower. The price stalls out at or very close to the level of the first peak.
The Neckline: This is the make-or-break level. It's a horizontal line drawn right through the lowest point of the valley. Think of it as the last line of defense for the buyers.
Key Insight: A double top pattern is just a potential signal until one thing happens: the price has to break down and close below the neckline. That breakdown is your confirmation. It’s the market telling you the sellers have officially won the battle.
What the Pattern Signals to Traders
At its core, a double top screams one thing: uptrend exhaustion. The failure to make a new high on the second try is a massive sign of weakness. It shows that demand is drying up at that price, and the sellers are taking over.
So, what do you do with this information? If you're holding a long position, a forming double top is your cue to get defensive. It might be time to take some profits off the table or tighten your stop-loss.
For more aggressive traders, the breakdown below the neckline can be seen as a prime opportunity to open a short position, betting that the price has much further to fall.
Ultimately, spotting a double top gives you a real edge. Instead of just reacting to what the market does, you can start anticipating what it might do next, all based on the clear, visual evidence of a rally that has run out of gas.
The Psychology Driving the Double Top
Every chart pattern tells a story, and the double top pattern is a classic drama about market sentiment. It’s a visual tug-of-war between buyers (bulls) and sellers (bears), where greed slowly sours into doubt, and doubt eventually collapses into fear. If you want to master this pattern, you first have to understand the human emotions driving it.
The story starts in a strong, healthy uptrend. Confidence is high. Buyers are in total control, pushing prices to new highs with every session. This march upward creates the first peak, a point where the market is buzzing with excitement and optimism. But this is also where the first cracks start to show.
At this high point, some of the smarter, earlier investors decide it's a great time to cash in and take profits. Their selling is just enough to stall the rally, causing a temporary dip that forms the valley. This isn't a disaster—not yet. Most traders see it as a healthy correction, even a classic "buy the dip" opportunity.
The Second Push and the Wall of Doubt
This brief pullback is what sets the stage for the second act. The remaining bulls, joined by new buyers gripped by FOMO (fear of missing out), rally their forces for another push higher. Their one goal: smash through the previous high and get the party started again.
But as the price nears the first peak, something changes. This time, they hit a solid wall of sellers who are more determined than before. The failure to decisively break this resistance level is a huge psychological blow.
The inability to forge a new high plants a powerful seed of doubt. The question in every trader's mind flips from "How high can this thing go?" to "Wait, is this the top?" This is the moment bullish conviction starts to crumble.
This second failure is far more damaging than the first. It confirms that the resistance level is real and suggests the buying power that fueled the entire uptrend is finally running out of steam.
From Doubt to Widespread Fear
With the bulls now looking weak and exhausted, the balance of power shifts dramatically. Traders who bought near the second peak are suddenly underwater, their anxiety growing by the minute. Sideline traders who were waiting for a clear signal now see the emerging 'M' shape as a massive red flag. The market's mood becomes fragile, like a tinderbox waiting for a spark.
That spark is the neckline—the support level created by the valley. It’s the final line in the sand. When the price finally breaks below this critical support, all hell breaks loose.
This breakdown triggers a chain reaction:
- Stop-Loss Orders: A flood of automated sell orders from traders who set their stops just below the neckline get triggered, pouring fuel on the fire.
- Panic Selling: Traders holding long positions without stop-losses scramble to sell and cut their losses, accelerating the downward momentum.
- Bearish Entry: Short-sellers who were patiently waiting for confirmation now jump in, placing bets on a continued decline.
The narrative has come full circle, from unbridled greed to outright fear. The psychology of the crowd is an incredibly powerful force, and knowing how to read it is key. To get a better handle on how these emotions are measured across the entire market, take a look at a trader's guide to the Fear & Greed Index.
By recognizing the emotional story behind a double top, you’re no longer just seeing shapes on a chart—you’re understanding the human behavior that drives the markets.
How to Identify a Genuine Double Top
Spotting an M-shaped pattern on a chart is the easy part. The real challenge? Knowing if it’s a genuine double top — a true signal that the trend is about to reverse — or just random market noise.
Not every M-shape is a sell signal. Many are just brief pauses before the price continues its climb. To avoid getting faked out, you need a solid checklist to separate the real patterns from the imposters. It's about looking at the full context: the trend, the structure, and especially the trading volume.
The Anatomy of a Valid Pattern
First things first, a double top can't exist in a vacuum. It absolutely must follow a significant prior uptrend. Think about it—you can't have a reversal pattern if there's no trend to reverse. A double top appearing in a choppy, sideways market doesn't carry the same weight because the bullish exhaustion just isn't there.
Once you’ve confirmed the uptrend, it's time to dissect the pattern itself. A real double top has a few non-negotiable parts.
Here’s what to look for:
- Two Distinct Peaks: The chart needs two clear highs at roughly the same price. They don’t have to be perfect, but they should be close, usually within 1% of each other. If the second peak is way higher or lower, you're likely looking at a different setup entirely.
- A Meaningful Trough: The valley between the two peaks needs to be more than just a minor dip. As a rule of thumb, look for a pullback of at least 10% from the first peak's high. This shows the first rejection at that resistance level was serious.
- The Critical Neckline: This is the make-or-break element. Draw a horizontal line at the lowest point of the trough—that's your neckline. Until the price breaks decisively below this support level, the double top is just a potential pattern, not a confirmed one.
This quick visual breaks down the three steps to confirming the pattern.
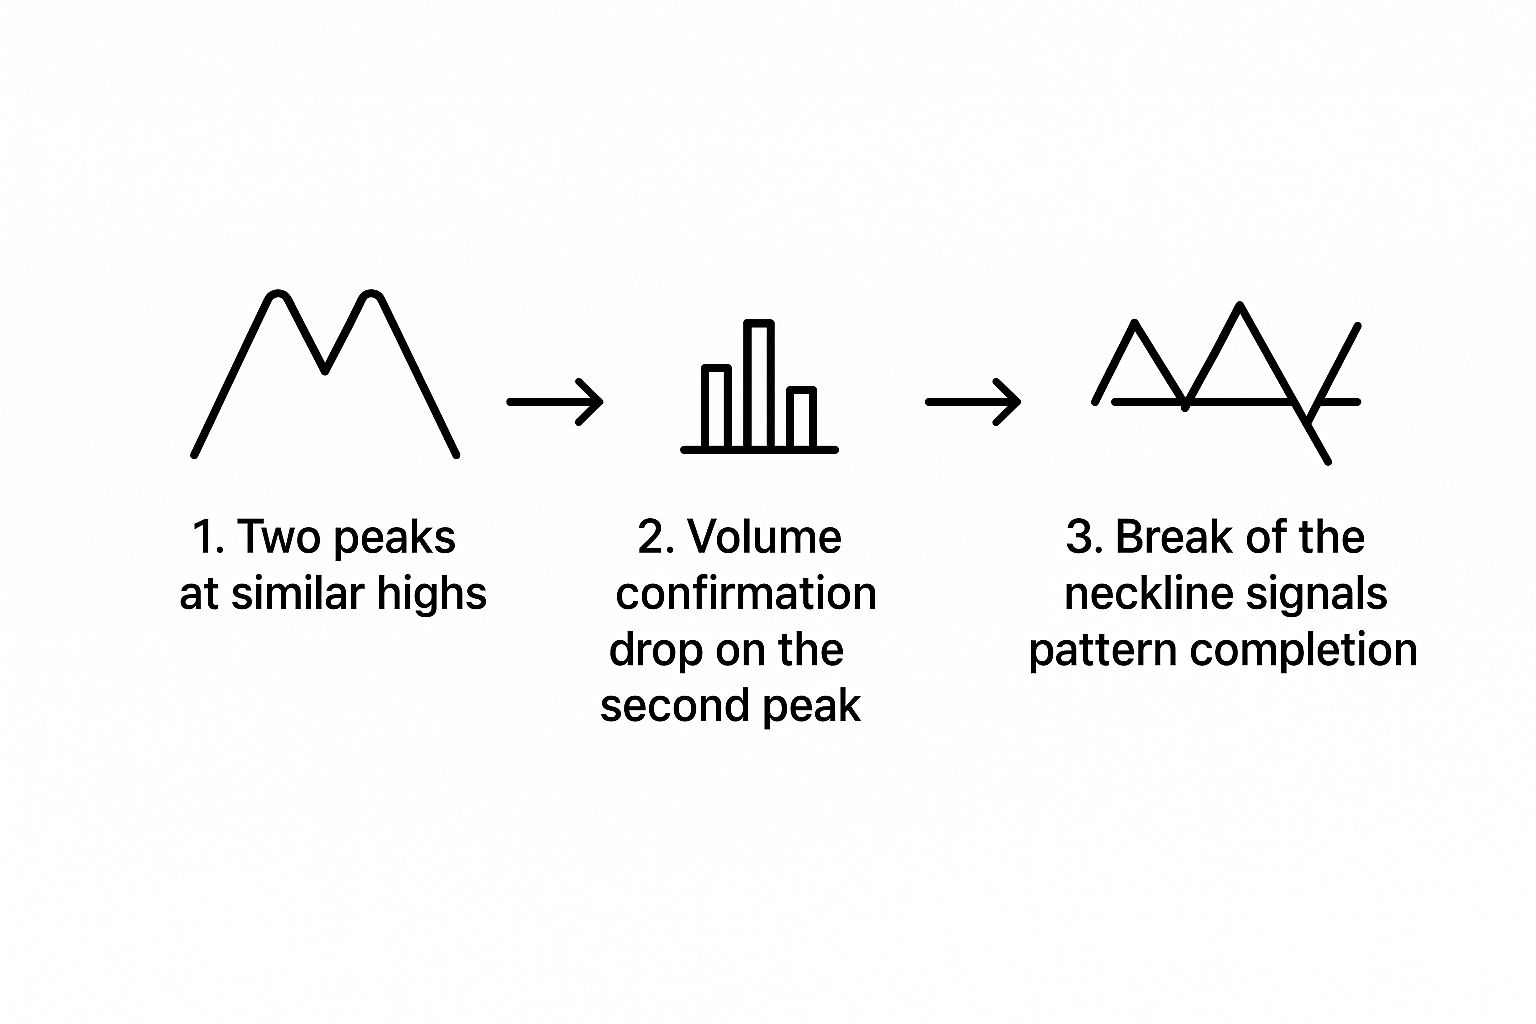
As you can see, that neckline break is the final, absolute confirmation you need before acting on the pattern.
Volume: The Ultimate Confirmation Tool
Price action tells you what's happening, but volume tells you why. It reveals the conviction—or lack thereof—behind the moves. For a classic double top, the volume signature is often the biggest giveaway.
Typically, the trading volume on the second peak should be noticeably lower than the volume on the first peak. This is a critical bearish signal. It suggests the buying pressure that drove the price to the first high has dried up, making the second attempt much weaker and more likely to fail.
Then, watch for a spike in volume as the price smashes through the neckline. This surge tells you that sellers are jumping in with force, adding fuel to the new downward trend. The combination of fading volume on the rally and rising volume on the breakdown gives you a much stronger reason to believe the reversal is real.
Statistical Reliability and Formation Time
The double top is a classic for a reason: it's proven to be pretty reliable over time. One large-scale study of 500 stocks found 454 instances of the pattern, with about 75% leading to a bearish reversal.
That same study found the average pattern took around 57 days to form, with the price difference between the two tops averaging about 1%. You can check out the full findings from the double top pattern study on QuantifiedStrategies.com.
What this data tells us is that these patterns aren't quick day-trading setups; they develop over weeks. Patience is key. If you're new to this, getting the fundamentals right is everything. To build a stronger foundation, our technical analysis for beginners a step by step guide is a great place to start. By combining these identification rules with a gut feel for market psychology, you’ll get much better at spotting high-probability reversals and sidestepping those costly false alarms.
Trading Strategies and Confirmation Signals

Spotting a potential double top pattern on a chart is the easy part. The real challenge—and where most traders slip up—is knowing exactly when to act on it. A pattern is just a possibility until the market gives you a clear, undeniable signal that the bears have seized control.
The make-or-break moment is the neckline break. This support level, drawn at the lowest point between the two peaks, is the bulls' last stand. When the price slices through it and closes below, it’s like a starting pistol for a new downtrend. That's your high-probability signal to get ready.
Choosing Your Entry Strategy
Once that neckline gives way, you have a decision to make. There are two classic ways to enter a short position, each with its own trade-offs. Your choice will likely come down to your personal trading style and how much risk you’re comfortable with.
The Aggressive Entry (Breakout Trading) This is for traders who want to get in on the action immediately. You enter a short trade the moment the price closes below the neckline. The big plus? You can catch the initial, powerful wave of selling as other traders' stop-loss orders get triggered. The downside is that you risk getting caught in a "bear trap"—a fake breakout where the price dips just long enough to fool you before snapping back up.
The Conservative Entry (Throwback Retest) Patience is the name of the game here. After the initial breakdown, it’s common for the price to rally back up and retest the neckline it just broke. This old support level now acts as a new ceiling, or resistance. Entering your short trade as the price gets rejected from this level is a much stronger confirmation that the trend has truly flipped. You might miss the first leg down, but your entry point is often much safer and provides a better risk-to-reward setup.
The pattern isn't officially confirmed until the price breaks below that critical neckline. While the textbook examples look clean, you have to be careful. Not every double top leads to a massive price drop. Some fizzle out into minor corrections or turn out to be false alarms. For a deeper dive, you can discover more insights about double top confirmation on bapital.com.
Projecting Profit Targets and Setting Stops
One of the best things about the double top is that it gives you a logical, built-in way to set your profit targets. This isn't just wishful thinking; it's a calculated move based on the pattern's own geometry.
To find your target, measure the height of the pattern—from the highest peak down to the neckline. Then, subtract that same distance from the point where the price broke through the neckline. This gives you a data-backed price level to aim for as your take-profit.
For instance, if a stock hits peaks at $100 and has a neckline at $90, the pattern's height is $10. Your minimum profit target would be $80 ($90 neckline minus the $10 height).
Just as crucial is knowing when to cut your losses. A logical place for your stop-loss is just above the second peak. This is the safest spot because a price move above that point completely invalidates the pattern. For those who want a tighter stop, placing it just above the retested neckline after a throwback entry is also a popular choice.
To put it all together, here’s a quick-reference table summarizing the key components of a solid double top trading plan.
Double Top Trading Strategy Components
This table breaks down the core elements you need to consider when trading this classic reversal pattern.
| Component | Description | Best Practice |
|---|---|---|
| Identification | Recognizing the two distinct peaks and the intervening trough (neckline). | Look for two rounded peaks at a similar price level. |
| Confirmation | The signal that validates the pattern and triggers a trade entry. | Wait for a decisive price close below the neckline support. |
| Entry Point | The price at which you open a short (sell) position. | Choose between an aggressive breakout or a conservative retest of the neckline. |
| Stop-Loss | A pre-defined price level to exit the trade if it moves against you. | Place it just above the second peak (conservative) or above the retest (tighter). |
| Profit Target | The price level where you plan to take profits. | Measure the pattern's height and project it downward from the breakout point. |
Following these steps provides a structured, disciplined approach that can help take the emotion out of your trading decisions.
Adding an Extra Layer of Confidence with RSI
To really stack the odds in your favor, savvy traders rarely rely on a chart pattern alone. They look for confluence—multiple signals pointing in the same direction. One of the most effective tools to pair with a double top is the Relative Strength Index (RSI).
What you’re hunting for is something called bearish divergence. This is a powerful red flag that occurs when the price chart makes a second peak at or near the same level as the first, but the RSI indicator makes a lower high.
This divergence is a huge tell. It shows that even though the price is still high, the upward momentum is running out of steam. When you spot a bearish RSI divergence lining up with a double top pattern, it’s a much stronger signal to sell. It gives you that extra conviction to pull the trigger when the neckline finally breaks.
Common Mistakes Traders Make
Knowing how to spot a double top pattern is one thing. Knowing how to not lose money on it is something else entirely. True mastery comes from understanding the common pitfalls that can turn a beautiful "M" formation into a costly mistake.
The road to consistent trading is paved with disciplined risk management, and avoiding these frequent errors is your first line of defense.
The single biggest mistake? Impatience. Eager traders see that second peak form and practically trip over themselves to short the asset. They're acting on pure anticipation, not confirmation.
Remember, until the price breaks and closes below the neckline, the double top is just a potential setup. It's not a guarantee. The bulls could easily roar back to life, pushing the price to new highs and leaving those early sellers with a painful loss.
Confusing Consolidation with a Reversal
Another classic blunder is mistaking a simple sideways grind for a true reversal pattern. Markets don't always move in straight lines; they often need to pause and catch their breath. During these lulls, the price can bounce between a support and resistance level, creating a shape that vaguely resembles an 'M'.
The difference is all about context. A real double top must form after a significant uptrend—it’s a signal of bullish exhaustion. A similar shape that shows up in a choppy, trendless market is just noise. It lacks that critical backstory and is far less reliable.
It's also worth noting the statistics. The double top isn't as reliable as its bullish cousin, the double bottom. Research shows that only about 39% of double tops actually hit their projected price target, a stark contrast to the double bottom's 68% success rate. This doesn't mean you should ignore the pattern, but it does mean confirmation and solid risk control are non-negotiable. You can read the full research about these pattern statistics on QuantifiedStrategies.com.
Poor Stop-Loss Placement
Your stop-loss is your safety net, but if you place it wrong, it’s useless. Many traders set their stops way too tight, often just a few ticks below their entry. They end up getting "stopped out" by normal market noise right before the real move happens.
A much smarter approach is to place your stop-loss at a logical point that would completely invalidate the pattern.
- Conservative Placement: Put your stop just above the high of the second peak. If the price breaks that level, your bearish idea is officially wrong.
- Tighter Placement: If you enter on a throwback retest of the neckline, you can place a stop just above that new resistance level.
Key Takeaway: A well-placed stop-loss isn't just about limiting losses; it's about giving your trade enough room to breathe without invalidating the very reason you entered it.
At the end of the day, no chart pattern is foolproof. False signals are just part of the game. The only way to protect your capital is with an ironclad risk management plan. Recognizing these common mistakes is the first step toward building a more resilient and disciplined trading approach. For a deeper dive, check out our guide on mastering risk management in trading.
Frequently Asked Questions

Even after you’ve got a handle on the double top pattern, you're bound to run into some specific questions. This section tackles the most common ones to help you clear up the finer points.
Think of this as your go-to guide for those "what if" moments that pop up when you're watching the charts live. Nailing these details can make all the difference between a winning trade and a painful mistake.
How Does a Double Top Differ From a Triple Top?
While they're both strong bearish reversal patterns, the key difference is how many times buyers get rejected at a resistance level. A double top, with its classic 'M' shape, shows that buyers failed twice to push the price higher.
A triple top pattern, on the other hand, involves three failed attempts to break that resistance. It looks just like you’d imagine—three peaks sitting at roughly the same price. Because the bulls were shut down three times instead of just two, many traders see the triple top as an even more reliable signal that a downtrend is coming.
It basically tells a more drawn-out story of buying exhaustion. The repeated failures to break through show a much more determined group of sellers at that price, which can lead to a more significant drop.
Does This Pattern Work on All Timeframes?
Absolutely. The double top is a universal pattern you'll spot on everything from the fast-paced 5-minute charts that day traders live on to the weekly charts that long-term investors prefer. The core psychology—fading buying pressure at a key level—is the same no matter the duration.
However, the timeframe definitely changes how much weight the pattern carries.
- Longer Timeframes (Daily, Weekly): A double top on a weekly chart is a big deal. It represents months of price action, and a breakdown from there often signals a major, long-term trend reversal.
- Shorter Timeframes (Intraday): On a 5-minute chart, a double top might just signal a small pullback that lasts a few hours. You'll see them more often, but they can be less reliable because of all the market noise.
A core principle in trading is that the longer the timeframe, the stronger the signal. A weekly double top is a much more serious warning than one you spot on a 15-minute chart.
How Reliable Is the Double Top Pattern?
This is the million-dollar question, isn't it? The double top is a classic for a reason: it has a long history of working. When you spot it correctly and get confirmation from other signals, it can be a highly reliable sign of a potential trend change.
But let's be realistic—no chart pattern is a magic bullet. The market will throw false signals, where a pattern looks like it's forming but then falls apart. Some studies suggest that while around 75% of identified double tops lead to some kind of bearish move, not all of them hit their full projected price targets.
This brings us to two non-negotiable rules:
- Confirmation: Never jump the gun. Wait for the price to break and close below the neckline before you even think about trading it.
- Risk Management: Always use a stop-loss. This protects your capital if the pattern fails and the price screams back up against you.
Think of the pattern as a high-probability setup that puts the odds in your favor, not as a guarantee.
What Happens if the Price Breaks Above the Peaks?
If the price smashes through and closes above the resistance formed by the two peaks, the double top pattern is officially dead. This is a huge deal to understand because it flips the signal from bearish to bullish in a heartbeat.
A breakout like this tells you the buyers weren't tired after all. In fact, they absorbed all the selling pressure at that resistance, regrouped, and found the strength to push the price to a new high.
This is a clear signal that the uptrend isn't over—it's likely about to continue with even more force. If you were thinking about shorting, this is your cue to stand down. And if you were already long, it’s a great confirmation that you made the right call.
Ready to stop guessing and start measuring market sentiment? The Fear Greed Tracker uses a powerful algorithm to give you a real-time score on over 50,000 assets, turning market emotion into your strategic advantage. Make data-driven decisions and track sentiment shifts for your favorite stocks and cryptocurrencies before they happen. Learn more at https://feargreedtracker.com