
Think of an equity research report template as your master blueprint for analyzing a company. It's a structured framework that brings consistency to how you break down a publicly traded company's story, from its business model all the way to a final investment recommendation. Having a solid template ensures every report you produce is thorough, logical, and easy to follow.
Laying The Foundation Of Your Report

Before you ever start plugging numbers into a financial model, you need to think like an architect. A great equity research report isn't just a jumble of data points and charts; it's a compelling narrative that builds a case for an investment decision. This foundational step is all about creating that logical structure.
Without a clear blueprint, your analysis—no matter how brilliant—will get lost. Your goal is to create a flow that tells a clear story, starting with the high-level investment case and then systematically drilling down into the evidence that supports it.
Start With The One-Page Summary
This is, without a doubt, the most critical piece of your entire report. Often called a "tear sheet" or investment summary, it’s the first thing anyone reads, and for many time-crunched portfolio managers, it might be the only thing they read in depth.
Your template must dedicate the very first page to this summary. It needs to be punchy and get straight to the point.
- Recommendation: A definitive Buy, Hold, or Sell rating.
- Price Target: Your 12-month target price for the stock.
- Investment Thesis: The core argument in just 2-4 sentences. Why should someone act on your recommendation?
- Key Financials: A snapshot table with vitals like current price, market cap, EPS, and key valuation multiples (P/E, EV/EBITDA).
This exercise forces you to sharpen your thinking. If you can't make a compelling case on a single page, the rest of your report probably won't either.
A strong one-page summary is the cornerstone of any effective report. It anchors your entire analysis, immediately communicating your conclusion and inviting the reader to dig deeper into the details that follow.
Mapping The Report's Logical Flow
After the summary, your template needs to guide the reader on a logical journey. Every section should build on the one before it, creating a cohesive argument that leads directly to your conclusion. This structure is what makes your analysis persuasive and builds trust with your audience.
Before diving in, it's worth understanding the broader context. For a deeper look into the evaluation process itself, our comprehensive guide offers practical insights on how to evaluate investment opportunities.
The value of this structured analysis is undeniable. The global equity research services market was valued at around $9.5 billion in 2023 and is on track to hit $15.6 billion by 2030, according to Magistral Consulting. This growth highlights just how critical clear, well-reasoned research is in today's financial markets.
Here’s a breakdown of the essential sections every quality equity research report should have.
Core Components of an Equity Research Report
This table outlines the standard sections you'll find in a professional report. Think of it as the chapter list for the story you're telling about the company.
| Section Name | Primary Purpose | Key Information Included |
|---|---|---|
| Investment Summary | To provide a concise overview of the entire report and recommendation on a single page. | Recommendation (Buy/Sell/Hold), Price Target, Investment Thesis, Key Financials. |
| Company & Industry | To provide context on the business and its operating environment. | Business model, products/services, competitive landscape, market size, industry trends. |
| Financial Analysis | To present historical performance and forecast future results. | Income Statement, Balance Sheet, Cash Flow analysis, key ratios, and forward-looking projections. |
| Valuation | To justify the price target using multiple financial methodologies. | Discounted Cash Flow (DCF), comparable company analysis (Comps), precedent transactions. |
| Investment Risks | To outline potential threats that could invalidate the investment thesis. | Company-specific risks, macroeconomic threats, competitive pressures, regulatory changes. |
| Final Recommendation | To conclude the report by reiterating the core argument and final call to action. | A summary of the investment thesis and a clear restatement of the rating and price target. |
Each part plays a distinct role, and together, they form a complete and defensible investment case. Your template's job is to ensure you never miss a piece of the puzzle.
Weaving the Company and Industry Narrative
The best equity research reports I’ve seen do more than just throw numbers at you—they tell a compelling story. This is the part of your template where you build the qualitative case for your investment. It’s where you step away from the spreadsheets to explain why a company is set up to win or lose. Think of this narrative as the essential context for the financial model that comes next.
A great story always starts with the main character, in this case, the company itself. You simply can't value what you don't understand. Your template needs a dedicated space to unpack the company's core identity, answering the fundamental questions every investor is going to ask.
Nailing Down the Company's Identity
First things first, you have to break down the business model. How does this company actually make money? Is it a subscription game like Netflix? A classic transactional model like a retailer? Or is it all about ads, like Google? Clearly defining this is step one.
From there, you’ve got to get into its products or services. List out the core offerings and, more importantly, pinpoint what's actually driving the revenue. For a company like Apple, for instance, you wouldn't just list the iPhone; you’d also dig into the growing importance of its high-margin services segment.
The final piece of this puzzle is the company’s competitive moat. This is the secret sauce—the sustainable advantage that keeps competitors at bay.
- Brand Strength: Does it have a powerhouse brand that commands pricing power, like Coca-Cola?
- Network Effects: Does the service get better as more people jump on board, like the ecosystem Meta has built?
- Switching Costs: Is it a huge pain for customers to leave? Think about enterprise software from companies like Salesforce.
- Intangible Assets: Does the company hold valuable patents, licenses, or regulatory approvals that basically put up a "Do Not Enter" sign for newcomers?
Building these prompts into your template forces you to consistently and thoroughly analyze a company's real strengths every single time.
Sizing Up the Broader Industry Landscape
Remember, no company exists in a bubble. After you've defined the business, your template should guide you to zoom out and look at the industry it’s playing in. The health of that industry and the intensity of the competition will have a massive say in the company's future profits.
Using a structured framework here is a game-changer. While you can always customize it, carving out a section for a Porter's Five Forces analysis is a fantastic place to start. This classic model helps you map out the competitive pressures that define an industry.
| Competitive Force | The Core Question to Answer | Real-World Example |
|---|---|---|
| Threat of New Entrants | How easy is it for new players to enter this market? | High capital costs in aerospace make it tough for new entrants, protecting giants like Boeing and Airbus. |
| Bargaining Power of Buyers | How much power do customers have to push prices down? | In the grocery business, customers have huge power. There are tons of options and switching is easy. |
| Bargaining Power of Suppliers | How much power can suppliers wield to raise their prices? | A company like Intel historically had massive bargaining power over PC makers who needed its chips. |
| Threat of Substitute Products | How likely are customers to find another way to get the job done? | Video conferencing services like Zoom are direct substitutes for business travel, hitting airlines and hotels hard. |
| Rivalry Among Competitors | How fierce is the fight between the existing players? | The smartphone market is a bloodbath of intense rivalry, which forces constant innovation and puts pressure on prices. |
Running through this analysis forces you to think critically about the external winds a company is sailing into. It helps you see if the company has a nice tailwind at its back or if it's battling some serious structural headwinds.
Your industry analysis needs to end with a clear verdict: Is this an attractive industry to be in? A great company in a terrible industry is often a bad investment. Your template should make you answer this question head-on.
Finally, think about the big trends and potential disruptions on the horizon. Are there regulatory changes coming? Is new tech threatening to make the company’s products obsolete? The rise of electric vehicles, for example, is a massive disruption for traditional automakers. A truly useful equity research template must have placeholders to address these forward-looking factors. This is how you turn a simple analysis into an insightful story that actually helps someone make a smart investment decision.
Building a Robust Financial Modeling Engine

This is where your investment thesis gets real. The financial model is the quantitative heart of your report, the place where you translate the company’s story and industry dynamics into cold, hard numbers. A well-built model isn't just a spreadsheet; it's a dynamic tool you can use to stress-test your assumptions and, ultimately, drive your valuation.
Every solid equity research report template needs a dedicated, fully-linked three-statement model. That means your Income Statement, Balance Sheet, and Cash Flow Statement must be interconnected, so a change in one automatically flows through the others. This is non-negotiable. Without it, your forecast will be unreliable and internally inconsistent.
Architecting the Three-Statement Model
At its core, your model is a bridge between historical performance and future projections. The first thing you'll do is populate your template with historical financials. I always recommend pulling at least three to five years of data directly from the company's SEC filings to build a solid foundation. This history is crucial for understanding past performance and gives you a baseline for what's to come.
With the historicals locked in, you can start building out your forecast, typically for the next five years. The secret to a clean, transparent model is to create a dedicated "assumptions" or "drivers" tab. This is where you'll centralize all your key inputs—revenue growth rates, gross margins, SG&A as a percentage of sales, you name it. This makes your model so much easier to audit and adjust on the fly.
A simple but incredibly effective trick I learned years ago is to use color-coding to keep things straight.
- Black Font: Use for historical data pulled from filings.
- Blue Font: For all formulas and calculations within the model.
- Red Font: Reserved for hard-coded assumptions and manual inputs.
This visual system makes your model auditable at a glance. Anyone (including your future self) can instantly trace the logic and see exactly which inputs are driving the forecast.
Developing Defensible Assumptions
A model is only as good as the assumptions you feed it. Pulling numbers out of thin air is the quickest way to lose credibility. Your template should force you to ground every single assumption in solid evidence, blending historical trends with a clear-eyed view of the future.
When it comes to revenue growth, don't just drag the past forward. Your forecast needs to be a direct reflection of the narrative you've already built. If your thesis is that the company is entering new markets or launching a game-changing product, your revenue assumptions have to quantify that story. For example, if a software company is launching a new subscription tier, you should model its adoption rate and price point to build a bottom-up revenue forecast.
For margins, look at historical trends, but then layer on your analysis of future pressures. Will rising input costs squeeze gross margins? Can the company finally gain some operating leverage as it scales, leading to higher EBITDA margins? Remember, documenting your why for each assumption is just as important as the number itself.
Your financial model is the ultimate test of your investment thesis. If your qualitative story doesn't translate into a plausible set of financial projections, it's a major red flag that you need to revisit your core arguments.
Incorporating Scenario Analysis
A single forecast represents just one possible version of the future. To give a truly complete picture, a great equity research report template has to include scenario analysis. At a minimum, this means creating and modeling three distinct cases for your forecast.
Doing this provides a valuation range, which is infinitely more useful than a single, static price target. It shows you've thought deeply about risk and acknowledged that the future is anything but certain.
| Scenario Type | Common Assumptions | Potential Outcome |
|---|---|---|
| Base Case | This is your most likely path, reflecting management guidance and your core thesis. | Represents your official price target and is the foundation of your investment recommendation. |
| Bull Case | Here you model optimistic outcomes—faster market share gains, smash-hit product launches, or unexpected margin expansion. | Shows the potential upside if everything goes right, helping to define the best-possible return. |
| Bear Case | This scenario models the pessimistic outcomes, like increased competition, an economic downturn, or operational stumbles. | Highlights the potential downside risk and helps investors understand what they truly stand to lose. |
The hallmark of a professional-grade model is building a toggle or switch in your template that lets a user seamlessly flip between these scenarios. It makes your analysis dynamic and proves you’ve considered the full spectrum of possibilities. This one feature adds a layer of depth that separates great research from merely average work, turning a static report into a powerful decision-making tool.
Integrating Valuation and Price Targets
Once you've wrestled with the financial model, it's time to translate all those projections into a tangible valuation. This is where the rubber meets the road—where your analysis culminates in a defensible price target. Your final recommendation is only as good as the valuation backing it up, which is why any serious equity research report template needs a robust, flexible section for multiple valuation methods.
Relying on a single valuation technique is a classic rookie mistake. The real goal is to triangulate a value. By approaching the company's worth from several different angles, you can see where the estimates converge and build a far more credible investment case.
The chart below gives a great visual of how financial data feeds into this story. It shows revenue trends, profit margins, and earnings per share—all key inputs for your valuation.
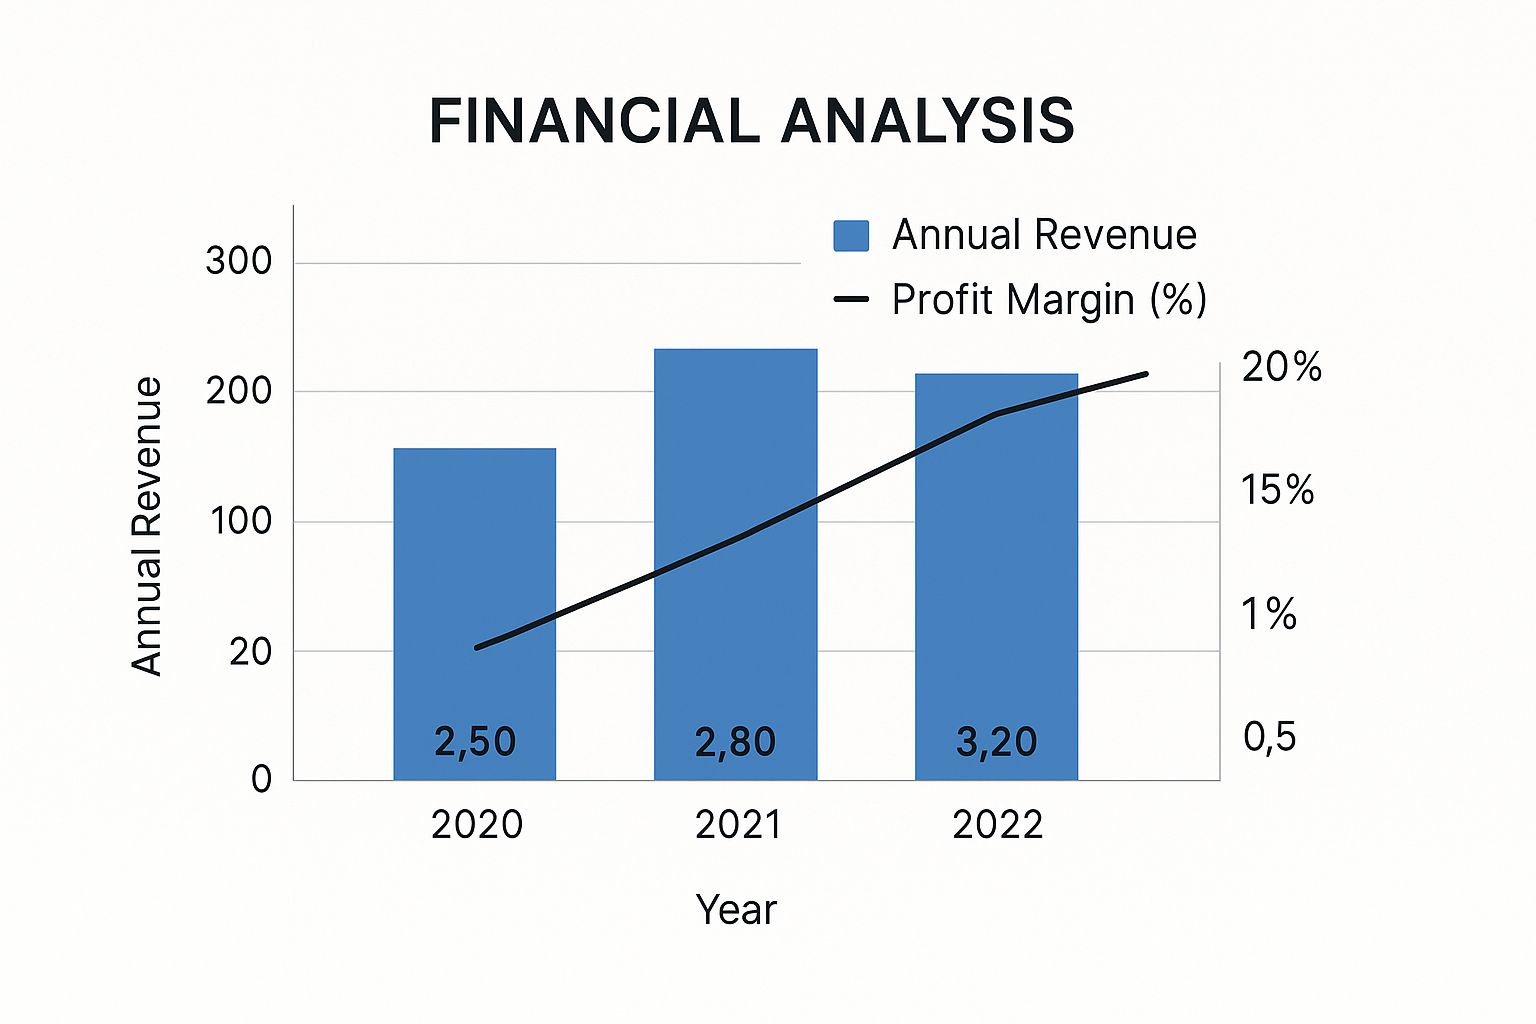
Here, you can see steady revenue growth, but notice the slight squeeze on profit margins. That could hint at cost pressures, a critical detail you'll need to factor into your valuation assumptions.
Anchoring with Discounted Cash Flow (DCF) Analysis
For many analysts, the Discounted Cash Flow (DCF) analysis is the gold standard of intrinsic valuation. Why? Because it values a company based on the present value of the actual cash it's expected to generate in the future. Your template absolutely needs a dedicated DCF section that pulls numbers directly from your three-statement model.
A good DCF module needs to be built around a few core components:
- Free Cash Flow to the Firm (FCFF): This calculation should flow automatically from your financial statements. It starts with operating profit, adjusts for taxes, adds back non-cash charges (like D&A), and then subtracts investments in working capital and capex.
- Weighted Average Cost of Capital (WACC): This is your discount rate. Your template needs clear inputs for the cost of equity (often found using the Capital Asset Pricing Model or CAPM) and the cost of debt.
- Terminal Value: You can't forecast cash flows to infinity, so you have to estimate the company's value beyond your explicit forecast period. The two most common ways to do this are the Perpetuity Growth Method and the Exit Multiple Method.
Building a solid DCF requires a genuine understanding of the business. For a more detailed walkthrough, our guide on how to calculate intrinsic value is a great resource. Getting the DCF right provides a solid anchor for your entire valuation.
Grounding in Market-Based Valuation
While a DCF tells you what a company should be worth in a perfect world, market-based methods tell you what similar companies are actually worth in the real world today. This provides a crucial reality check. Your template should have sections for at least two types of relative valuation.
Comparable Company Analysis (CCA), or "comps," is the first. This means finding a group of publicly traded peers with similar business models, size, and growth profiles. For each one, you'll calculate key valuation multiples like EV/EBITDA, P/E, and P/S. Your template should then let you apply the average or median multiple from that peer group to your target company's numbers.
The secret to good comps is picking the right peers. A lazy peer group can torpedo your entire valuation.
A common mistake is choosing peers based only on industry. A high-growth SaaS company and a legacy on-premise software provider might be in the same "industry" but have completely different valuation profiles. Your peer selection must be more nuanced.
Precedent Transaction Analysis is the second method. Instead of looking at public market values, this analysis looks at what acquirers have recently paid for similar companies in M&A deals. Valuations here are often higher because they include a "control premium"—the extra amount a buyer pays to gain full control of a business. It’s an excellent data point for gauging a company's potential M&A value.
Comparison of Key Valuation Methodologies
To keep these methods straight, it helps to see them side-by-side. Each has its place, and understanding their strengths and weaknesses is key to applying them correctly.
| Valuation Method | Primary Use Case | Pros | Cons |
|---|---|---|---|
| Discounted Cash Flow (DCF) | Determining intrinsic value based on future cash generation. | Theoretically sound; not influenced by market sentiment; forces detailed fundamental analysis. | Highly sensitive to assumptions (growth rate, WACC); difficult for early-stage or unpredictable companies. |
| Comparable Company Analysis (CCA) | Valuing a company relative to its publicly traded peers. | Reflects current market sentiment; easy to understand and calculate with available data. | Can be misleading if the market is over/undervalued; finding true comparables is often difficult. |
| Precedent Transaction Analysis | Estimating value in an M&A context, including control premiums. | Based on actual prices paid for entire companies; useful for strategic or M&A scenarios. | Past transactions may not reflect current market conditions; data can be scarce or inconsistent. |
Ultimately, a good analyst doesn't just run the numbers for each method; they understand why the results might differ and can build a narrative that explains those differences.
Summarizing with a Football Field Chart
After running your DCF, comps, and precedent transactions, you'll have a range of different values. The best way to present this is with a valuation summary, often called a "football field" chart.
This is just a simple bar chart that visually displays the valuation range implied by each methodology. It lets everyone see the big picture at a glance—where the valuation ranges overlap and what a reasonable overall value might be. Building this summary chart into your template is the perfect way to wrap up your valuation section and present a clear, comprehensive, and defensible price target.
Articulating Risks and Final Recommendations

No credible investment thesis is a one-way street. After you've built a strong case for a company’s future, you have to turn the tables and ask the hard question: "What could go wrong?"
A dedicated risk section isn't just about covering your bases legally. It’s where you prove your analysis is balanced and build real trust with the reader. Honestly, an equity research report template that just skims over the risks feels incomplete and, frankly, amateur.
This is where you stress-test your own argument. It shows you've thought through the counterpoints and aren't just a cheerleader for the stock. You're a clear-eyed analyst.
Systematically Categorizing Investment Risks
Throwing a random list of problems at your reader is just confusing. A far more professional approach is to structure your risk analysis by grouping threats, usually starting from the company-specific and moving outward. This method ensures you cover all the angles and helps the reader understand the nature of each risk.
Your template should have placeholders for at least three distinct categories of risk.
- Company-Specific Risks: These are the internal threats or operational hurdles unique to the business. Think about a botched product launch, the departure of a key executive, or being too dependent on a single huge client. For a biotech firm, the classic example is a negative FDA ruling on its blockbuster drug candidate.
- Industry-Wide Risks: Now we're looking at threats that impact everyone in the sector. This could be a disruptive new technology, a major shift in what consumers want, or new regulations coming down the pipeline. Just think about how streaming services became a massive industry-wide risk for traditional cable companies.
- Macroeconomic Risks: These are the big, top-down threats tied to the economy as a whole. We're talking about rising interest rates, a potential recession, geopolitical tensions, or wild currency swings. These can hit almost any company, but some are definitely more exposed than others.
A truly thorough analysis goes beyond just naming the risk. You have to explain how it could actually affect your financial forecast. If supply chain disruption is a risk, what does that do to the gross margins in your model? Connecting the risk to the numbers is crucial. For a deeper dive, exploring the 9 best practices for risk management can give you a more robust framework to work with.
Synthesizing Your Final Recommendation
Alright, after laying out the potential downsides, it's time to bring it all home. The final section of your report is your closing argument. This is where you pull together your entire analysis—the company story, the financial model, the valuation, and the risks—into a single, decisive conclusion.
This is your last chance to make an impact, so you need to be clear and confident. Your template should guide you to wrap up with three key elements.
Your conclusion is no place for new information. It should be a crisp, confident summary of everything you've already presented, tying the entire narrative together into a clear and actionable final verdict.
First, reiterate your investment thesis in its most potent form. Remind the reader of the core reason this investment makes sense, tying it directly back to your valuation. For instance, you could say the market is completely missing the company's successful pivot to a high-margin subscription model.
Second, state your final rating and price target without hesitation. This needs to be crystal clear: a definitive Buy, Hold, or Sell call, paired with your 12-month price target. This is the call to action that all your work has been leading up to.
Finally, place your call in the broader market context. Equity research is vital for understanding sector trends. For example, sectors like Technology and Communication Services have been on a tear, posting year-to-date returns of 38.2% and 39.2% respectively. They've earned 'Overweight' ratings thanks to drivers like AI and cloud computing. You can learn more about the U.S. equity market outlook from CFRA Research. Framing your recommendation within this bigger picture adds another layer of sophistication, making your report a relevant piece of the larger investment puzzle.
Answering Common Questions About Report Templates
Even with a great structure mapped out, you're bound to run into some practical questions when you start building and using your equity research template. Let's tackle some of the most common ones I've seen over the years. Getting these right is the difference between a template that just looks good and one that actually works in the real world.
One of the first questions that always comes up is about length. My rule of thumb is simple: a report should be just long enough to make your case convincingly, and not a word more.
How Long Should a Report Be?
Honestly, there's no single right answer. It all depends on the context. If you're writing a full initiation report on a company you've never covered before, you're looking at a pretty hefty document, maybe 20-50 pages. You have to build the entire investment story from scratch, explaining the business model, the industry, management, and your detailed valuation.
On the other hand, a quarterly update for a company already under coverage might only be 2-5 pages. Your readers already know the backstory. They just need the latest results, your take on what's changed, and whether it affects your investment thesis.
A truly effective template is modular. It lets you pull in the deep-dive sections for an initiation but also has a stripped-down version for quick updates. The goal is always to be thorough enough to justify your conclusion without burying your reader in unnecessary detail.
What Are the Biggest Template Mistakes to Avoid?
I see a few common pitfalls all the time. The biggest is probably making the template too rigid. Every company is different. You can't analyze a high-growth SaaS business with the same lens you'd use for a stable industrial manufacturer. Your template needs to be a flexible framework, not a rigid cage.
Another huge mistake is getting lost in the financial model and forgetting about the narrative. The story is what makes the numbers meaningful and persuades your reader. Your model is just the evidence; it's not the argument itself.
A beautifully complex financial model is useless if it’s not connected to a clear and convincing story. The best analysts are great storytellers who use numbers as evidence, not as the story itself.
Finally, don't overcomplicate the formatting. The whole point is to communicate clearly. Your charts need to be instantly understandable, your assumptions should be easy to find, and your recommendation must be crystal clear. Fancy formatting often just gets in the way. Simplicity is your best friend.
How Often Should I Update My Template?
Think of your template as a living document. It's not something you build once and then use forever. I recommend revisiting and refining it at least once a year. Markets change, standards evolve, and your own skills improve. Your tools need to keep up.
Here are a few triggers that should prompt an update:
- Evolving Standards: Accounting rules change. New disclosure requirements, especially around things like ESG, become mainstream.
- New Methods: Different valuation techniques come in and out of favor depending on the market cycle. You might want to add a new methodology or adjust the weighting of existing ones.
- Personal Improvement: As you get more experience and receive feedback, you'll naturally find better ways to structure an argument or visualize a piece of data.
Keeping your template fresh ensures your analysis stays relevant, incorporates best practices, and remains a powerful tool for communicating your best ideas.
At Fear Greed Tracker, we believe that understanding market sentiment is just as critical as fundamental analysis. Our platform provides real-time Fear & Greed scores for over 50,000 assets, giving you the data-driven edge you need to make smarter investment decisions. See how sentiment is shaping the market today by checking out our tracker.