
Lagging indicators are like the rearview mirror of your financial analysis—they show you exactly where you’ve been. They are metrics that confirm a trend after it’s already underway.
Think of it this way: lagging indicators give you historical proof of what just happened in the market or the economy, painting a clear picture of past events.
What Lagging Indicators Really Do
Imagine a leading indicator is the weather forecast predicting a storm. A lagging indicator, on the other hand, is the official report that comes out the next day confirming exactly how much rain fell. It doesn't predict the future; it gives you concrete, factual evidence about the past.
Their main job is confirmation. The stock and crypto markets are full of "noise"—small, meaningless price jumps and dips that don't signal a real trend. Lagging indicators help you cut through that noise by waiting for a genuine pattern to form before giving you the thumbs-up. That delay is a feature, not a bug, because it stops you from jumping on false signals.
By providing historical context, lagging indicators help traders and investors validate trends, avoid market noise, and make decisions based on confirmed patterns rather than speculation.
Why Confirmation Often Beats Speed
The real power of these indicators is their reliability. Since they’re built on past data, the signals they generate are often far more dependable than predictive tools that are just making an educated guess.
A classic example from economics is Gross Domestic Product (GDP). It measures a country's economic output, but the final numbers are released long after the quarter has ended. It doesn't tell us where the economy is headed, but it confirms with high accuracy where it’s been. This is explained further in IG's guide on what are leading and lagging indicators.
For traders, this kind of confirmation is priceless. Take a simple tool like a moving average, which calculates the average price over a set period. It can only signal an uptrend after prices have already been climbing for a while. This simple delay can save you from buying into a brief price spike that immediately fizzles out. You can learn more about this in our trader's guide on how to use moving averages.
By waiting for that solid confirmation, you trade with more certainty.
Leading vs Lagging Indicators Explained
To really get what lagging indicators are, it helps to put them side-by-side with their counterparts: leading indicators. The difference is simple but powerful.
Think of a leading indicator as a weather forecast. It tries to predict what’s coming, giving you a heads-up to grab an umbrella. But, as we all know, forecasts can be wrong.
A lagging indicator, on the other hand, is the official weather report from the day after the storm. It tells you exactly how many inches of rain fell with 100% accuracy.
One predicts, the other confirms. Leading indicators are speculative, designed to get you ahead of a potential market move. For instance, a sudden spike in new building permits might signal that the economy is about to heat up. Traders use these clues to spot opportunities before everyone else does.
Lagging indicators are all about facts. They’re based on what has already happened, confirming that a trend is real and not just a momentary blip on the radar. This confirmation is absolutely crucial for managing risk and helps you avoid getting faked out by false signals. It gives you the confidence to put your capital to work only when a trend has proven it has legs.
Predictive Guesses vs Historical Facts
At its core, the difference boils down to timing and purpose. A leading indicator asks, "What might happen next?" A lagging indicator answers, "What just happened?"
- Leading indicators are predictive. They use current data to try and forecast future trends. Their biggest advantage is speed, but their weakness is that they can be flat-out wrong.
- Lagging indicators are confirmative. They sift through past data to confirm a trend is already underway. Their strength is reliability, but the trade-off is that you get the signal a bit late.
This infographic breaks down how different lagging indicators are used to measure business performance that has already occurred.
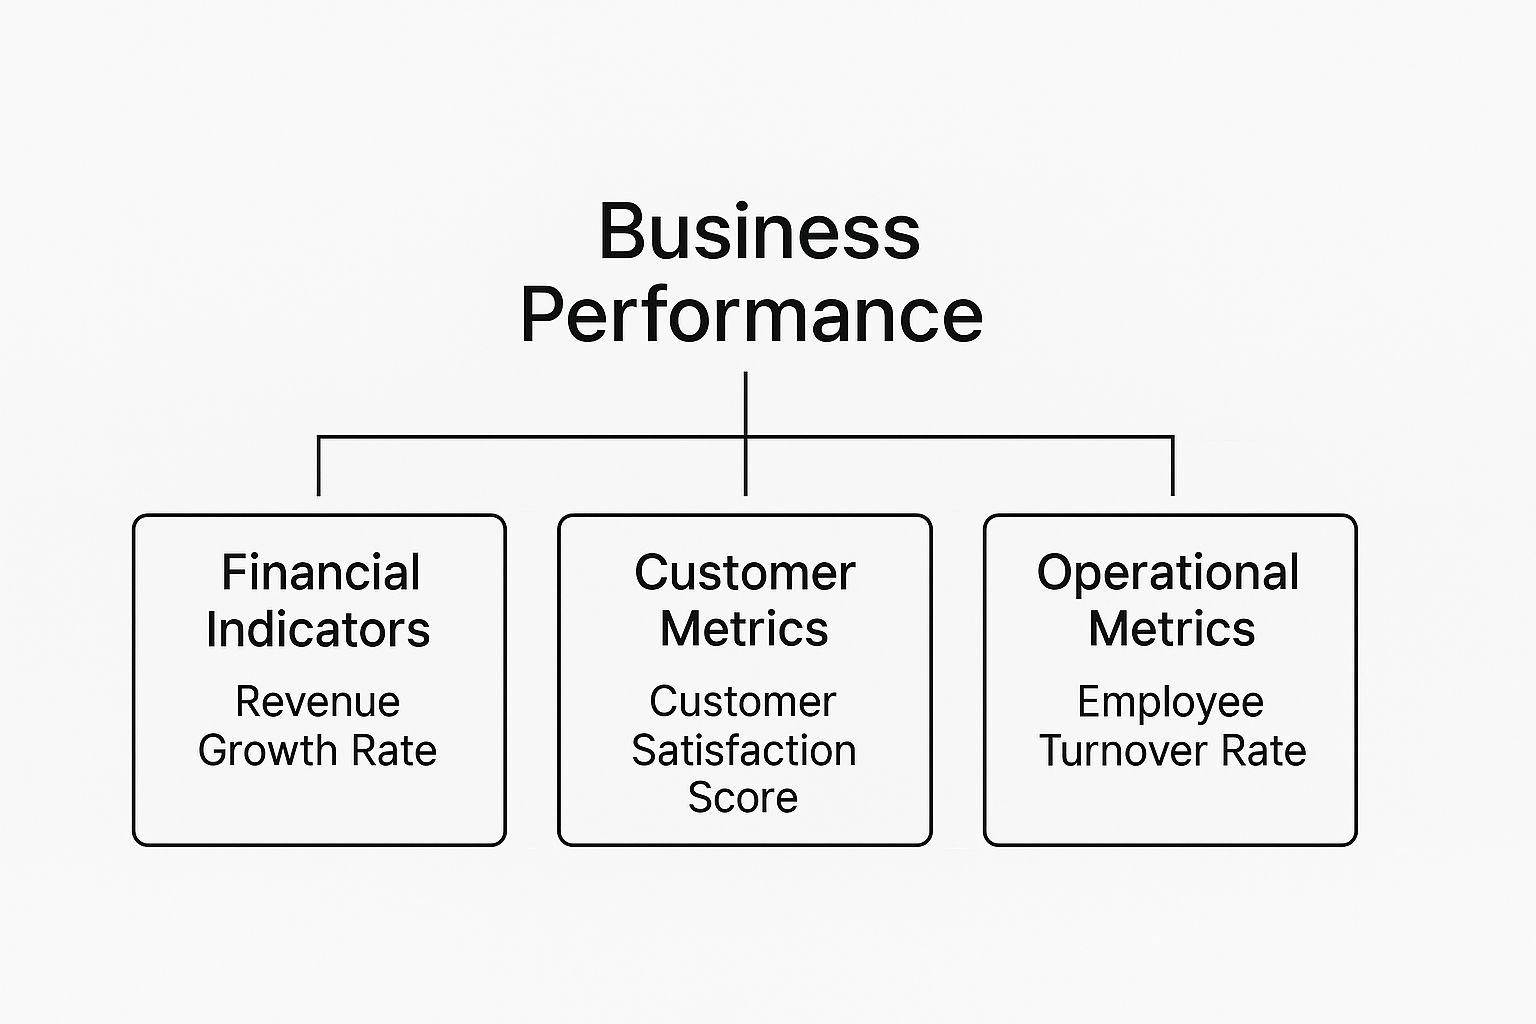
As you can see, things like revenue growth and employee turnover are all lagging indicators because they measure outcomes after the fact.
To make this crystal clear, here’s a quick table breaking down the key differences.
Leading vs Lagging Indicators at a Glance
This table offers a quick comparison of the fundamental differences between leading and lagging indicators to help you decide which to use for your analysis.
| Attribute | Leading Indicators | Lagging Indicators |
|---|---|---|
| Purpose | To predict future market movements | To confirm past trends or events |
| Timing | Forward-looking | Backward-looking |
| Data Source | Current economic or market data | Historical price and volume data |
| Advantage | Early signals for potential opportunities | High reliability, fewer false signals |
| Disadvantage | Prone to inaccuracy and false signals | Delayed signals, potential missed profits |
| Best For | Speculative or short-term trading | Trend-following and long-term investing |
Ultimately, both have a place in a well-rounded strategy, but they serve very different roles.
Finding the Right Balance for Your Strategy
So, which one is better? Neither. They simply do different jobs.
Relying only on leading indicators is like driving a car while only looking through the windshield—you might see what’s coming up, but you have no clue if you’re staying in your lane.
On the flip side, using only lagging indicators is like driving by looking exclusively in the rearview mirror. You'll know exactly where you’ve been, but you won't see that sharp turn right in front of you.
A successful strategy doesn't choose between leading and lagging indicators; it combines them. Use leading indicators to scout for potential opportunities and lagging indicators to confirm the intelligence before taking action.
Here’s how that works in the real world. A trader might spot a leading indicator suggesting a stock is oversold and could be due for a rebound. Instead of jumping in right away, they wait for a lagging indicator—like a moving average starting to curve upward—to confirm that a new uptrend has actually begun.
This balanced approach filters out all the market noise and dramatically increases your odds of making a sound, evidence-based decision. By blending foresight with hindsight, you create a much more robust and reliable framework for analyzing the markets.
How Traders Use Lagging Indicators in the Stock Market

In the real world of stock trading, lagging indicators aren't just a textbook concept. They're practical tools traders use every single day to make sense of price movements and double-check their strategies.
Their real strength? They cut through the market’s constant noise. By giving you clear, fact-based signals about what’s already happened, they help you avoid jumping the gun on a whim or getting faked out by a sudden price spike that goes nowhere.
Instead of trying to predict the future—a fool's errand—traders use these tools to confirm that a trend is the real deal and has some momentum behind it. It's an approach built on patience and proof. You wait for the market to show its hand before you put your capital on the line.
Confirming Trends with Moving Averages
Moving Averages (MAs) are easily one of the most common lagging indicators you'll see on a chart. They work by smoothing out all the choppy price data into a single, easy-to-read line, making the trend's direction obvious.
Because they’re built using past prices, they will always lag behind what’s happening right now. For instance, a 50-day Simple Moving Average (SMA) is just the average closing price over the last 50 days. It can only start to move up after the price has already been climbing for a while.
This delay is a feature, not a bug. It helps traders confirm a trend has truly taken hold, separating it from short-term noise. This simple confirmation is crucial for avoiding false breakouts and making smarter calls.
A classic signal traders watch for is the "golden cross." This happens when a shorter-term MA (like the 50-day) crosses above a longer-term one (like the 200-day). It’s a powerful—though delayed—signal that a new bull market might be starting. It only appears after the price has already been rising, giving you solid evidence of an uptrend.
On the flip side, a "death cross" (when the 50-day MA drops below the 200-day) confirms a new bear market is likely underway.
Popular Lagging Indicators for Stock Traders
Moving Averages are just the beginning. Traders have a whole toolbox of lagging indicators, each offering a different angle on price action and momentum. To get a handle on more of these, check out our guide on the 9 essential day trading indicators for 2025.
Here are a few other popular ones:
- Relative Strength Index (RSI): This tool measures the speed and change of price moves. Its main job is to confirm when a stock is overbought (usually a reading over 70) or oversold (below 30), signaling that a recent trend might be running out of steam.
- Bollinger Bands: These are made of a middle moving average line and two outer bands. When the price moves outside the bands, it shows high volatility. But traders often wait for the price to move back inside the bands to confirm that a trend is stabilizing or reversing.
- Moving Average Convergence Divergence (MACD): This indicator shows the relationship between two different moving averages. When the MACD line crosses its signal line, it's a classic lagging signal used to confirm a new trend's direction.
By using these tools, traders shift from guessing what might happen to reacting to what is happening. The goal is not to catch the exact bottom or top but to capture the majority of a confirmed trend with higher confidence.
Applying Lagging Indicators in the Wild West of Crypto
The crypto market is a 24/7 beast, with a kind of volatility that makes the traditional stock market seem downright sleepy. In this relentless environment, confirming a trend isn’t just a nice-to-have—it’s a survival skill. Lagging indicators become your anchor in the storm, offering a dose of reality when hype takes over.
Assets like Bitcoin and Ethereum are famous for their vicious, out-of-nowhere reversals. Jumping the gun on a price move can wipe you out. A sudden surge might be the start of a legendary bull run, or it could be a classic "bull trap" right before the floor falls out. Lagging indicators make you pause and wait for proof.
This disciplined approach is your best defense against the market’s deafening noise. It helps you sidestep emotional trades driven by pure fear or greed. If you want to dig deeper into how market psychology drives price, our guide on the crypto fear and greed index is a must-read.
Using MACD to Confirm Crypto Momentum
One of the most battle-tested lagging indicators for crypto traders is the Moving Average Convergence Divergence (MACD). It’s built to show you changes in the strength, direction, and momentum of a trend. The MACD has two main components: the MACD line and the signal line.
The magic happens at the crossover. When the MACD line crosses above the signal line, it’s a bullish sign confirming that upward momentum is building. And when it crosses below the signal line, it confirms the bears are taking control.
Because it’s built on moving averages of past prices, the MACD crossover always shows up after a price move has already begun. This "lag" is exactly what makes it so valuable in crypto. It stops you from getting suckered into a brief spike that collapses moments later.
In a market notorious for its violent swings, the MACD crossover acts as a reliable, albeit delayed, confirmation that a new trend has enough gas in the tank to be taken seriously.
Let's say Bitcoin suddenly pumps 5% in one hour. Instead of FOMO-buying, a smart trader waits. They might look for the MACD to flash a bullish crossover on the 4-hour chart. Sure, they might miss the first few percentage points, but this confirmation dramatically boosts the odds that the move has legs.
Tracking Volume with On-Balance Volume (OBV)
Price alone doesn’t tell the full story. The On-Balance Volume (OBV) indicator adds a crucial layer of context by tracking the flow of money—the buying and selling pressure. It's essentially a running tally, adding volume on green days and subtracting it on red days.
OBV is a fantastic lagging tool for confirming what the price is doing:
- A rising OBV confirms an uptrend. It shows that more volume is flooding in on days the price goes up, suggesting strong conviction from buyers.
- A falling OBV confirms a downtrend. It means volume is heavier on days the price drops, showing that sellers are firmly in the driver's seat.
If you see a coin’s price climbing but the OBV is flat or even falling, that’s a massive red flag. This "divergence" screams that the rally is hollow and lacks real buying power. It's a house of cards waiting to tumble. By waiting for the OBV to move in sync with the price, you can dodge these traps and trade with far more confidence.
How to Combine Indicators for a Stronger Trading Strategy
The smartest traders I know all share a secret: you don’t have to pick a side between leading and lagging indicators. The real magic happens when you use them together, creating a powerful system of checks and balances for every trade you consider.
Think of it like a military operation. Leading indicators are your scouts, sent ahead to scope out potential opportunities or dangers on the horizon. Lagging indicators are your generals, who wait for solid confirmation from the scouts before committing the main force. One gives you foresight; the other gives you proof.
It’s all about stacking the odds in your favor. A leading indicator might flash an exciting signal, but acting on that alone is pure speculation. By waiting for a lagging indicator to confirm that signal, you move from guesswork to a decision backed by real data.
Creating a Two-Step Verification System
Putting this into practice is surprisingly straightforward. You simply use the leading indicator to spark an idea, and the lagging indicator to prove it’s worth acting on. This simple filter cuts through a ton of market noise and saves you from jumping on false signals—a common trap with purely predictive tools.
For example, a trader might use a leading indicator like the Stochastic Oscillator to spot a potential oversold condition, hinting at a possible price reversal. But they won't pull the trigger just yet. Instead, they'll wait for a lagging indicator, like the Moving Average Convergence Divergence (MACD), to back it up.
If the Stochastic shows an oversold reading and then the MACD line crosses above its signal line, that double confirmation creates a much stronger buy signal. This method dramatically boosts the probability of a successful trade. You can learn more about this synergy in this handy guide on leading and lagging indicators from Babypips.com.
This two-step process turns a simple observation into a concrete, actionable strategy with risk management baked right in.
Practical Examples of Indicator Synergy
Let's walk through how this plays out in the real world. Imagine you're eyeing a stock that's been stuck in a long, painful downtrend.
The Scout's Report (Leading Indicator): You notice the Relative Strength Index (RSI), a classic leading indicator, has dipped below 30. This is your initial alert that the stock is potentially oversold and could be due for a bounce.
The General's Confirmation (Lagging Indicator): Rather than buying immediately, you stay patient. You watch and wait for the price to cross back above its 20-period Simple Moving Average (SMA), a reliable lagging indicator.
That SMA crossover is the proof you were waiting for. It confirms that the downward momentum hasn't just stalled—it has actually started to shift upward. Sure, you might not catch the absolute bottom tick of the move, but you enter the trade with far greater confidence that a genuine trend reversal is underway.
By layering your signals—using one to form a hypothesis and the other to confirm it—you build a resilient strategy that can withstand market volatility. This disciplined approach is what separates consistently profitable traders from those who just get lucky.
Lagging Indicators on a Macro Scale
It's not all about chart patterns. Lagging indicators also work on a much grander scale, giving us the big picture of the entire economy. Think of these macroeconomic indicators as the official scorekeepers—they confirm the health of a nation's economy long after the game has been played. This is the hard data that governments and central banks use to make major policy decisions.
Unlike the split-second signals on a trading chart, these indicators move at a snail's pace. They're like the final, audited financial report for a country. Corporate profits, for instance, are a classic lagging indicator. A company only reports its earnings after a fantastic quarter has already happened, confirming that an economic recovery was, in fact, underway.
How Economic Data Confirms What Already Happened
The unemployment rate is another textbook example. This number almost always trails economic shifts because businesses are naturally slow to hire or fire people. During a recession, companies will often hold off on layoffs for as long as possible, which is why unemployment often peaks months after the economy has already started to turn around.
Take the 2008 financial crisis. The US unemployment rate didn't hit its peak of 10% until October 2009. That was almost a year after the recession was officially declared over in June 2009. This delay is exactly what makes the data so valuable—it provides undeniable proof of an economic trend, confirming the true severity of the downturn long after the worst was over. You can dive deeper into how various economic indicators work on youaccel.com.
This backward-looking view is absolutely critical for long-term investors and policymakers. It helps them measure the real impact of economic cycles and see if recovery efforts are actually working.
Macroeconomic lagging indicators provide the official, data-backed narrative of economic performance, confirming trends that were already in motion and guiding future policy with the clarity of hindsight.
By keeping an eye on these broad measures, you get a much more complete picture of the market. They might not help you nail a short-term trade, but they offer invaluable context about the economic climate you're investing in. That kind of knowledge is crucial for building a resilient portfolio that can actually withstand the inevitable ups and downs of the economy.
Common Questions About Lagging Indicators

Even after you get the hang of lagging indicators, a few questions always seem to come up when traders start putting them into practice. Let's clear up some of the most common points so you can use these tools with confidence.
What Is the Main Drawback of Relying Only on Lagging Indicators?
The biggest pitfall is simply missed opportunity. Since these indicators only flash a signal after a trend is already in motion, you’re always playing catch-up.
By the time you get confirmation, you may have already missed a huge chunk of the initial price move. That’s why it's a mistake to use them for prediction; they’re built for confirmation, plain and simple.
Can Lagging Indicators Be Used for Short-Term Trading?
Absolutely, but you have to adjust your settings. Day traders and scalpers often use lagging indicators, but they apply them to much shorter time frames, like 1-minute or 5-minute charts.
A 20-period moving average on a 5-minute chart is still a lagging indicator, for instance. But it reacts way faster to price action than a 200-day moving average on a daily chart, making it a perfectly good tool for short-term trend analysis.
The secret is matching the indicator's settings to your trading timeline. A shorter horizon needs a more responsive tool—one that still lags, but just enough to give you reliable confirmation.
Which Lagging Indicator Is Best for a Beginner?
If you're new to technical analysis, start with Simple Moving Averages (SMAs). They’re the easiest to understand and see on a chart, and they do a fantastic job of showing you the main direction of a trend.
A great way to get started is to add a 50-day and a 200-day SMA to your charts. Watch how they interact with each other and with the price—it’s one of the most fundamental concepts in trading.
Stop guessing and start confirming your trading decisions. With Fear Greed Tracker, you can access real-time market sentiment scores and technical analysis for over 50,000 assets, turning complex data into actionable insights. Take control of your strategy at https://feargreedtracker.com.