
Think of the stock market Fear & Greed Index as a market mood ring. It’s a powerful, yet simple, tool that cuts through the noise of financial news and tells you one thing: are investors making decisions based on cold, hard facts or are they being swept away by emotion?
It translates the complex, often chaotic, feelings of millions of investors into a single, easy-to-understand number.
What Is the Stock Market's Mood Ring?
If you could take the emotional temperature of the entire market at any given moment, what would it say? That’s exactly what the Fear & Greed Index does. It’s not a crystal ball, and it won't predict exact price movements. Instead, it provides crucial context on the psychological forces pulling the strings behind the scenes.
The index is built to gauge whether fear (panic selling, caution) or greed (euphoria, chasing returns) is the dominant emotion in the driver's seat. By putting a number on sentiment, it helps you spot when the crowd might be getting a little too carried away.
Understanding the Core Concept
The whole idea behind the index is a nod to one of the most famous pieces of investment wisdom from Warren Buffett: "Be fearful when others are greedy and greedy when others are fearful."
The index gives you a data-driven way to actually put that advice into practice. When the dial swings toward Extreme Fear, it signals that investors are dumping stocks, sometimes without thinking. This panic can create incredible buying opportunities in solid companies that got tossed out with the bathwater. On the flip side, when it shows Extreme Greed, it’s a warning sign that the market might be getting frothy and is due for a pullback.
The index operates on a simple 0 to 100 scale, where different ranges correspond to different emotional states. It has a knack for capturing the market's mood during major events. For example, during the 2008 financial crisis, it plummeted below 10, perfectly reflecting the intense panic of that time. You can dig into more of these historical moments and see how they played out by checking out resources on Axiory.com.
To make it even clearer, here’s a simple breakdown of the scale and what each level typically means for the market.
Fear & Greed Index Scale At a Glance
| Index Reading | Sentiment Level | What It Typically Means for the Market |
|---|---|---|
| 0-24 | Extreme Fear | Investors are in panic mode, potentially leading to indiscriminate selling and undervalued assets. |
| 25-49 | Fear | Caution is the prevailing mood. Investors are more risk-averse, and the market may be seeing sell-offs. |
| 50-74 | Greed | Optimism is growing. Investors are actively buying, pushing stock prices higher. |
| 75-100 | Extreme Greed | Euphoria has taken over. Investors are chasing high returns, which can lead to overvalued markets. |
This table gives you a quick reference for interpreting the daily reading and understanding the psychological backdrop of the market.
Visualizing Market Sentiment
One of the best things about the index is how easy it is to read. A quick look at the visual dial, like the one famously provided by CNN, tells you everything you need to know in a second.
The gauge gives you an immediate snapshot of today’s sentiment. But it also shows you where the needle was yesterday, last week, last month, and last year. This historical context is gold—it helps you see whether the current feeling is a sudden blip or part of a bigger trend.
Learning to read this index is a game-changer. It’s about more than just numbers; it’s about understanding the why behind market movements. When you can see past the daily chatter, you can turn market psychology from a source of anxiety into a genuine strategic edge.
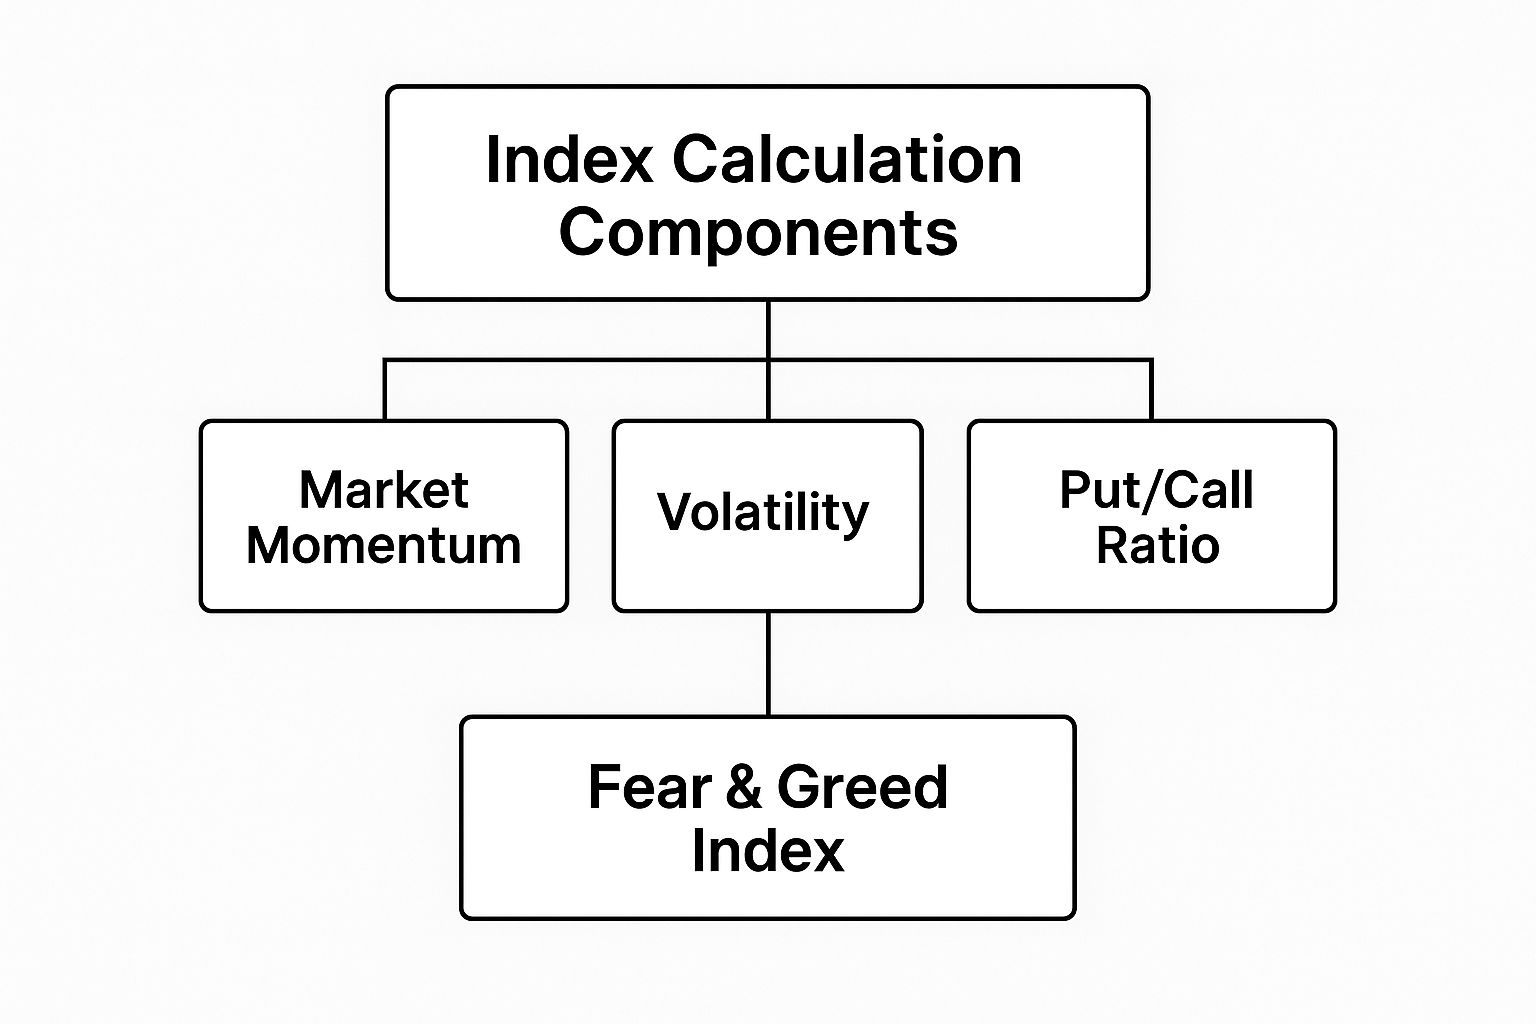
Decoding the Seven Factors Behind the Index
The Fear & Greed Index isn't just a number pulled from thin air. It’s a carefully crafted score built from seven distinct market indicators. Think of it like a symphony where each instrument plays a critical part in the final piece. By understanding each component, you get a much richer sense of how the index captures the complex emotions driving the market.
Each of these seven factors is weighted equally, contributing one-seventh to the final score. Let’s pull back the curtain on each one.
Stock Price Momentum
First up is stock price momentum. This factor simply looks at where the S&P 500 is trading compared to its 125-day moving average. A moving average smooths out the daily noise, giving us a clearer view of the underlying trend.
When the S&P 500 is soaring high above this average, it’s a classic sign of greed. Investors are optimistic and aggressively pushing prices higher. But if the index slips below its 125-day average, it's a signal that fear is creeping in, with bearish sentiment starting to take control.
Stock Price Strength
Next, we look at stock price strength. This indicator counts the number of stocks on the New York Stock Exchange (NYSE) hitting 52-week highs versus those hitting 52-week lows. It’s a fantastic way to measure the conviction behind a market move.
When a large number of stocks are hitting new highs, it points to widespread optimism—a clear sign of greed. On the other hand, if more stocks are tumbling to new lows, it reveals a hidden weakness and growing fear, even if the major indexes look steady on the surface.
Stock Price Breadth
Stock price breadth digs into the trading volume behind rising stocks versus falling ones. In simple terms, it asks: are the winners seeing more action than the losers?
This is measured using the McClellan Volume Summation Index. When the volume of advancing stocks far outweighs the volume of declining stocks, it shows bullish enthusiasm is strong (greed). When declining volume takes over, it means sellers are more motivated than buyers, pointing to increasing fear across the market.
Put and Call Options
The put/call ratio is a classic sentiment gauge straight from the options market. Here’s the breakdown:
- Put options are bets that an asset's price will fall.
- Call options are bets that its price will rise.
This indicator compares the trading volume of bearish put options to bullish call options. When the ratio rises, it means traders are snapping up more puts, hedging against a potential downturn. This is a clear indicator of growing fear. A low ratio, however, suggests investors are getting complacent and expect prices to keep climbing—a tell-tale sign of greed.
Junk Bond Demand
What does the bond market have to do with stocks? A whole lot, it turns out. Junk bond demand measures the difference in yield (known as the spread) between risky, lower-quality corporate bonds and safe, investment-grade corporate bonds.
When investors are feeling greedy, they're happy to take on more risk for a higher return. This drives up demand for junk bonds, causing the yield spread to shrink. But when fear takes hold, investors dump risky assets and flee to safety, causing the spread to widen. It's a powerful reflection of the market's overall appetite for risk. You can check out our guide for more details on what the fear and greed index is and how it provides these crucial key market sentiment insights.
Market Volatility
Often called the market's "fear gauge," the Volatility Index (VIX) is a vital component. The VIX measures the market's expectation of volatility over the next 30 days based on S&P 500 option prices.
A low VIX reading suggests a calm, even complacent, market where investors aren't expecting big price swings—a sign of greed. But when the VIX is high and rising, it signals that fear and uncertainty are spreading as traders brace for turbulence.
Safe Haven Demand
Finally, safe haven demand compares the performance of stocks versus Treasury bonds over the last 20 trading days. In times of stress, investors have a classic move: pull money out of stocks and park it in the perceived safety of government bonds.
When stocks are outperforming bonds, it shows investors have a healthy appetite for risk (greed). But when bonds start doing better than stocks, it’s a clear sign that fear is driving a flight to safety.
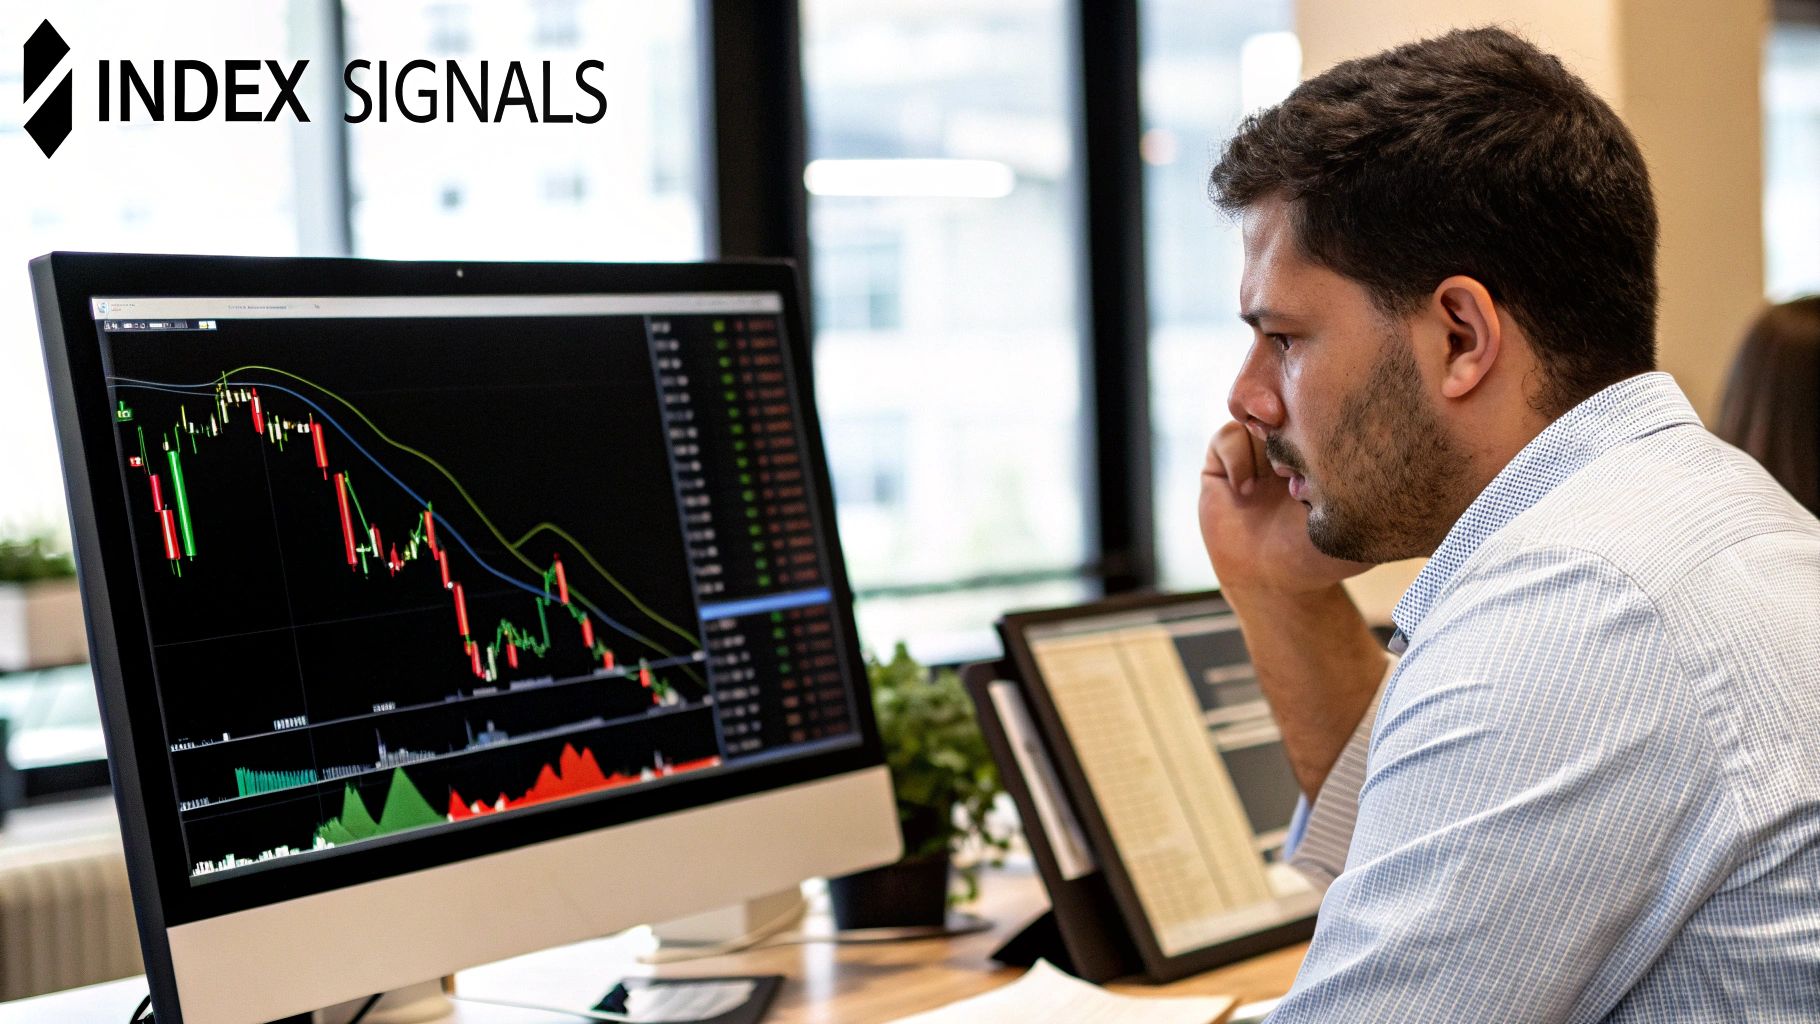
How the Index Has Performed Throughout Market History
Understanding the seven components of the stock market fear and greed index is one thing, but watching it in action during a real market meltdown? That’s where you see its true power. A quick trip through recent history shows how the index consistently acts as a barometer for market psychology, often pinpointing moments of maximum risk or prime opportunity.
If you look back, a clear pattern emerges. When panic takes over and fear sends investors running for the exits, the index dives. This often signals a point of what legendary investors call "maximum financial opportunity." On the flip side, when everyone gets a little too giddy and irrational exuberance is the mood of the day, the index soars—waving a big red flag that a correction could be just around the corner.
This isn't just an interesting metric; it's a lens for viewing the emotional tides that truly move the markets. It gives us clues that are so often drowned out by the daily noise of financial news.
The Dot-Com Bubble Warning Signs
Remember the late 1990s? It was a wild time of unchecked optimism, especially for tech stocks. Everyone was piling into any company with a ".com" in its name, completely ignoring old-school metrics like profitability. This was the dot-com bubble, a textbook example of market-wide greed.
At the peak of this frenzy in late 1999 and early 2000, the Fear & Greed Index would have been screaming Extreme Greed, regularly spiking above 90. The reading perfectly captured the euphoria and reckless risk-taking that had gripped Wall Street.
Of course, we know how that story ended. The bubble burst in March 2000, and the tech-heavy NASDAQ began a brutal slide, eventually shedding nearly 78% of its value. An estimated $5 trillion in market value evaporated. For anyone paying attention to the index, the warning signs were flashing long before the crash.
The 2008 Financial Crisis Capitulation
The 2008 global financial crisis was a masterclass in market panic. As the subprime mortgage house of cards collapsed, fear completely paralyzed investors. Major banks were on the verge of going under, and it felt like the entire system was about to implode.
As the crisis deepened, the Fear & Greed Index cratered to its lowest possible levels. It spent long stretches hovering near 0, a reading that signaled absolute, indiscriminate terror. Investors weren't just selling—they were liquidating everything in a desperate dash for cash.
This wave of extreme fear dragged the S&P 500 down nearly 57% from its 2007 high to its bottom in March 2009. But for contrarian investors who understood that this level of panic was unsustainable, those rock-bottom index readings were a historic signal. It was the ultimate "buy when there's blood in the streets" moment, and it set the stage for one of the longest bull markets in history. If you want to explore the emotional dynamics behind these moves, our guide to stock market sentiment analysis is a great place to start.
The COVID-19 Pandemic Panic and Rebound
More recently, the start of the COVID-19 pandemic in early 2020 triggered one of the fastest bear markets we've ever seen. The world went into lockdown, uncertainty was off the charts, and the market reacted with pure, unadulterated panic.
In March 2020, the Fear & Greed Index once again hit the floor, dropping into single digits. This signaled a level of fear we hadn't seen since the depths of 2008 and triggered a sharp, painful market crash.
But just like in 2008, that moment of maximum fear marked the exact market bottom. Investors who used the index to go against the herd were perfectly positioned for the stunningly fast recovery that followed. The index has proven itself in other high-stress moments, too, like during periods of escalating trade tensions. On one particularly bad day, the index fell to a value of 3, its lowest point since the early pandemic lows in March 2020, when it hit 8.
Applying the Index to Your Trading Strategy
Alright, let's get practical. Knowing the theory behind the stock market fear and greed index is one thing, but making it work for you is where the real value lies. Think of the index as an emotional compass for the market. It doesn't tell you exactly which stocks to buy or sell, but it gives you a crucial read on the overall mood, helping you navigate with more confidence.
It's not about blindly following a number. The goal is to use the index to gut-check your own analysis and avoid getting swept up in widespread panic or irrational hype. It helps you answer the big question: "Is now a smart time to be buying, or is the market getting dangerously overheated?"
Using Fear as a Buying Signal
Here's where the index really shines for contrarian investors. It’s based on a simple, timeless truth: the best deals often pop up when everyone else is running for the exits.
When the index drops into Extreme Fear territory—usually a reading below 25—it means panic has taken over. People are dumping assets without much thought, often pushing the prices of great companies way below what they're actually worth. For a savvy investor, this is a massive green light to start hunting for bargains.
Let's say the index hits a grim 15. This might be your cue to:
- Pull up your watchlist of solid companies you've been waiting to own at the right price.
- Start nibbling on small positions instead of diving in headfirst.
- Look for confirmation from other technical signals, like a price chart showing signs of a bottom.
The secret is to reframe Extreme Fear. It's not a stop sign; it's a "sale" sign. Think of it as the market’s version of a Black Friday blowout—quality assets are suddenly available at a huge discount, but only if you have the nerve to go shopping while others are hiding.
Using Greed as a Risk Management Tool
Now, flip the coin. When the index climbs into Extreme Greed—typically above 75—it’s time to pay attention. This is a clear warning that investors are getting complacent, chasing quick wins, and ignoring risk. That kind of euphoria is often what inflates market bubbles just before they pop.
Seeing sustained Extreme Greed is your signal to shift from offense to defense. This doesn’t mean you should dump all your holdings immediately; markets can stay irrationally overbought for a while.
Instead, a high Greed reading should prompt you to:
- Review your portfolio and think about cashing in some profits on your biggest winners.
- Tighten up your stop-losses to protect your gains if the market suddenly turns south.
- Consider rebalancing by trimming some of your high-flying growth stocks and moving into more stable, defensive areas.
Actionable Strategies Based on Index Levels
How you use the index will ultimately depend on your own style and how much risk you're comfortable with. There's no single right way. To explore this further, our dedicated guide for traders offers a much deeper look into how the stock market fear and greed index can be applied.
The table below gives you a quick snapshot of how you might think about different index levels, whether you're a contrarian or a trend-follower.
| Index Level | Market Psychology | Potential Contrarian Strategy | Potential Trend-Following Strategy |
|---|---|---|---|
| Extreme Fear | Widespread panic | Begin researching and buying undervalued assets. | Wait for confirmation of a trend reversal before entering. |
| Fear | General caution | Look for opportunities in oversold stocks. | Stay on the sidelines or hold defensive positions. |
| Greed | Growing optimism | Be cautious and avoid chasing over-extended rallies. | Ride the upward momentum while managing risk. |
| Extreme Greed | Euphoria and complacency | Consider taking profits and reducing exposure to high-risk assets. | Continue riding the trend but with tighter stop-losses in place. |
Ultimately, the Fear & Greed Index is a tool for keeping your own emotions in check. It gives you an objective snapshot of market sentiment, helping you sidestep the two classic blunders: buying into the hype at the top and selling in a panic at the bottom.
Common Pitfalls and How to Avoid Them
The stock market fear and greed index is a brilliant tool for getting a read on market psychology, but it’s not a magic eight-ball. Smart investors know its limits and sidestep the common mistakes that can turn a useful insight into a costly error. The fastest way to get into trouble? Treating the index as anything more than a single piece of the puzzle.
The single biggest trap is thinking the index can predict the future. It can’t. The index is a snapshot of current sentiment, not a forecast of what’s coming tomorrow. It simply tells you how investors are feeling right now, based on what just happened in the market.
An "Extreme Greed" reading doesn't mean a crash is around the corner, and "Extreme Fear" isn't a guaranteed signal that a rally is about to kick off. The index is reactive, not predictive.
The Danger of Acting in Isolation
Another classic blunder is using the index as your only reason to make a trade. Markets can stay irrational a lot longer than you can stay solvent. Just because the index is screaming "Extreme Fear" doesn't mean prices can't sink even lower.
Think of the index as one dial on your dashboard. You still need to check the others:
- Fundamental Analysis: Is the company you’re eyeing financially sound? Does it have real growth prospects?
- Technical Analysis: Do chart patterns, moving averages, or other indicators back up your move?
- Macroeconomic Trends: What are interest rates and inflation doing? What’s the bigger economic picture?
Relying only on the Fear & Greed Index is like trying to navigate a ship with just a compass. It tells you which direction you’re headed, but it won’t warn you about the iceberg dead ahead. You need all your navigational tools to make the journey safely.
Take the 2008 financial crisis. The index was stuck on "Extreme Fear" for months. Anyone who jumped in too early based on that signal alone still lost a lot of money before the market finally hit bottom in March 2009. The signal was right about the fear, but it couldn’t nail the timing.
Understanding Its Broad Market Focus
It's also critical to remember what the index actually measures. It’s built to gauge sentiment for the broad market—mostly the S&P 500. While that’s a great barometer for the overall mood of US large-cap stocks, it might tell you next to nothing about a specific niche you’re invested in.
A single sector, like biotech or renewable energy, could be riding a wave of greed while the rest of the market is nervous. On the flip side, a specific industry might be drowning in fear from bad regulatory news, even while the S&P 500 is hitting new highs.
Here’s how to avoid this pitfall:
- Acknowledge its purpose: Use the index for what it is—a look at the big-picture emotional backdrop.
- Drill down further: Always follow up with sector-specific research.
- Know your assets: Understand what makes your individual investments tick, independent of what the S&P 500 is doing.
By seeing the stock market fear and greed index as a powerful but imperfect tool, you can use it intelligently. Don’t treat it like a crystal ball, don't let it be your only guide, and don't misapply its broad focus. This approach lets you tap into its real strength: adding invaluable emotional context to your own, well-rounded investment strategy.
Of course. Here is the rewritten section, crafted to sound like an experienced human expert and match the provided examples.
Using a Fear Greed Tracker for Deeper Insights
So, you know the daily Fear & Greed number. That’s a good start, but it's like checking the weather by looking out the window for five seconds. To really understand what’s coming, you need a full forecast. This is where a dedicated Fear Greed Tracker comes in, turning a simple number into a powerful analytical tool.
Instead of just getting today's sentiment, a good tracker lets you travel back in time. With interactive charts, you can see precisely how the index reacted during past market meltdowns, epic rallies, and everything in between. It gives the index context, transforming it from a static snapshot into a story of market behavior.
Dissecting the Market's Mood
The real power of a tracker lies in its ability to look "under the hood" of the market. It breaks down the headline number into its seven individual components, giving you a much clearer picture of what’s actually driving the emotion. Is the market scared because of a spike in volatility, or is everyone suddenly buying put options?
A solid tracker lays this all out for you, showing exactly how much each metric is contributing. This lets you answer the important questions:
- Is this a broad-based fear affecting all indicators, or is it just one or two components acting up?
- Is the greed coming from genuine bullish momentum, or is it just a temporary dip in demand for safe-haven bonds?
This is how you move from just reacting to the index to truly understanding it.
The historical data paints a fascinating picture. Crunching the numbers on the CNN Fear and Greed Index over 3,600 trading days shows some clear patterns. While the average reading was a neutral 49.09, the market rarely stayed there. With a standard deviation of 21.16, it constantly swung from one extreme to the other, hitting rock bottom at 0 and soaring to a peak of 97. You can dig deeper into these historical Fear and Greed Index patterns on Finhacker.
Visualizing Real-Time Data
Let's be honest, nobody wants to sift through spreadsheets. The best platforms present this data visually, so you can absorb it all in a single glance.
Here’s what a clean, effective dashboard looks like.
This kind of layout instantly gives you the current score, where it sits historically, and a clear breakdown of each indicator. It’s all about getting the information you need, fast.
Think of a Fear Greed Tracker as your diagnostic tool for the market. It lets you pop the hood on market sentiment, giving you the detailed insights you need to make smarter, more strategic decisions.
Common Questions Answered
Even after getting the hang of the stock market fear and greed index, a few questions tend to pop up. Let's tackle them head-on to clear up any confusion and make sure you're ready to use this tool effectively.
How Often Is the Index Updated?
The stock market Fear & Greed Index is a snapshot of the day's emotions, so it gets a refresh once every trading day, right after the market closes. This ensures the final reading captures the sentiment from the entire session.
Think of it like getting the market's emotional temperature at the end of each day. This daily update helps you track how sentiment is shifting, keeping you in tune with the psychological undercurrents of Wall Street.
Can I Use This Index for Cryptocurrencies?
Not this specific one. The index we've been discussing is built exclusively for the stock market. Its seven indicators are all fine-tuned for equities.
But don't worry, the concept was so useful that a separate Crypto Fear & Greed Index was created. It measures sentiment in the wild world of digital assets, but it uses different inputs like social media trends and Bitcoin's market dominance to get a proper reading for that unique market.
Does a Neutral Reading Mean the Market Will Go Up?
Not at all. A neutral reading, which sits around the 50 mark, doesn't point to a future direction. It simply means fear and greed are in a tug-of-war, and neither side is winning.
A neutral score tells you the market is balanced and less emotional. Investors are likely making more measured, thoughtful decisions instead of acting out of panic or euphoria. It's a "wait and see" moment, not a clear buy or sell signal.
What Is the Biggest Mistake Traders Make?
Hands down, the biggest mistake is treating the index as a crystal ball. Relying on it as a sole indicator for buying or selling is a recipe for disaster.
Just because the index screams "Extreme Fear" doesn't mean you should blindly buy, and "Extreme Greed" isn't an automatic signal to dump your portfolio. The smartest investors use the index as a gut check—a tool to confirm or question a decision they've already researched. Always pair it with solid fundamental and technical analysis to build a complete picture.
Ready to move beyond the daily number and get a deeper understanding of market sentiment? Fear Greed Tracker gives you real-time scores, historical data, and component breakdowns for over 50,000 assets. Start making more data-driven decisions today at https://feargreedtracker.com.