
Implied volatility is a bit of a tricky concept because you can't just look it up like a stock price. Instead, it’s calculated by working backward from an option's current market price using a pricing model like the famous Black-Scholes.
Unlike historical volatility, which is all about what a stock has done, implied volatility (IV) is a forward-looking guess. It's the market's collective bet on how much a stock's price will swing in the future. In fact, it's the one missing puzzle piece that makes a theoretical option pricing model spit out the exact price an option is trading for in the real world.
What Implied Volatility Really Tells You

At its heart, implied volatility is all about quantifying market expectations. It’s not a crystal ball telling you if a stock is going up or down. Instead, it tells you the potential size of the move.
A high IV suggests traders are bracing for big swings, usually because something is on the horizon—an earnings report, a new product launch, or a big Fed announcement. On the flip side, a low IV signals that the market is expecting a period of calm.
Think of it as the price tag on uncertainty. When traders don't know what's going to happen next, they demand higher premiums on options to cover that extra risk. That higher option price gets plugged into the model and results in a higher IV figure.
The Market's Fear Gauge
This is why IV has earned its reputation as the market's "fear gauge." It tends to shoot up when panic sets in and drift lower when markets are stable and bullish. Getting a handle on this relationship is the first step to using IV to make smarter trades. Our guide to stock market sentiment indicators digs deeper into how these metrics all fit together.
The idea became so central to trading that entire indices were built to track it. The Chicago Board Options Exchange (CBOE) launched the VIX index back in 1993 to measure the market's implied volatility on S&P 500 options.
While the VIX typically hangs out around 20-22%, it has famously rocketed above 80% during market meltdowns like the 2008 financial crisis. You can learn more about how these volatility indices work by checking out resources from data providers like Intrinio.
Key Takeaway: When implied volatility rises, options get more expensive, signaling that bigger price swings are expected. When IV falls, options get cheaper, suggesting the market foresees a calmer road ahead.
Ultimately, understanding how implied volatility is calculated helps you see beyond a stock's price chart. It lets you:
- Price options more accurately: Know why an option costs what it does.
- Manage portfolio risk: Use IV as an early warning for potential market turbulence.
- Spot trading opportunities: Identify when options might be relatively cheap or expensive.
The Engine Behind the Calculation: The Black-Scholes Model

To really get how implied volatility is calculated, you have to look under the hood at the machine doing all the heavy lifting: the Black-Scholes model.
Developed back in the 1970s, this Nobel Prize-winning formula quickly became the gold standard for figuring out the fair price of European-style options. It’s the mathematical bedrock for pretty much all modern option pricing.
The whole point of the model is to spit out a theoretical option price. It does this by taking a few key pieces of known information and running them through its formula. You don’t need to be a math whiz to get the big picture, but you do need to know the ingredients it uses.
The Known Ingredients for the Formula
The Black-Scholes model needs five inputs to work its magic. The beautiful part is that four of these are staring you right in the face on any trading screen.
Here’s what the model needs to know:
- Current Stock Price: The live market price of the underlying asset. Simple enough.
- Option Strike Price: The price where the option can be exercised.
- Time to Expiration: How many days are left until the option expires, but expressed in years.
- Risk-Free Interest Rate: This is usually the yield on a short-term government bond that has a similar lifespan to the option.
The fifth and final piece of the puzzle is volatility. Normally, a trader would plug in their own forecast for volatility to find an option’s theoretical value. But here's where the script flips when we're calculating implied volatility. We already know the option's real-world price from the market.
The Big Idea: When you know an option's market price, volatility stops being an input. It becomes the only unknown variable left to solve for. This is the entire concept behind calculating implied volatility.
Solving for the Missing Piece
This shift in perspective is what makes the Black-Scholes model so perfect for our goal. We aren't trying to price an option—the market already did that for us. What we’re trying to do is figure out what level of future volatility would justify that market price.
So, how do we actually calculate it? It’s not a simple one-and-done calculation. You can’t just rearrange the formula to get volatility (the Greek letter sigma, σ) by itself. It's way too complex for that.
Instead, trading platforms use a sophisticated process of trial and error, often called iteration. The software makes an initial guess for volatility, plugs it into the Black-Scholes formula, and sees if the theoretical price it gets matches the actual market price.
If it doesn't match, it adjusts the volatility guess and tries again. It repeats this loop thousands of times in milliseconds until the model's output price is a perfect match for the option's real price.
The volatility number that finally makes the equation balance out? That’s the implied volatility. It's the market's collective opinion on future price swings, baked right into the option's price.
The Hunt for Implied Volatility
So, here’s the thing about the famous Black-Scholes formula: you can't just rearrange it to solve for volatility. It's not like a simple algebra problem. This means we can't just plug in the numbers and get a clean answer. Instead, calculating implied volatility is more like a high-speed hunt—an automated search for the one volatility number that forces the model's price to match the option's real-world market price.
This isn't a one-and-done calculation. It's an iterative process. Think of it as a sophisticated game of "hot or cold." A system makes an initial guess for volatility, plugs it into the Black-Scholes model, and sees what option price pops out. If the calculated price is too high, the volatility guess was too high. Too low? The guess was also too low. The system then makes a smarter, more precise guess and does it all over again, closing in on the answer with incredible speed.
This is the high-level flow, from raw market data to the final IV figure you see on your screen.
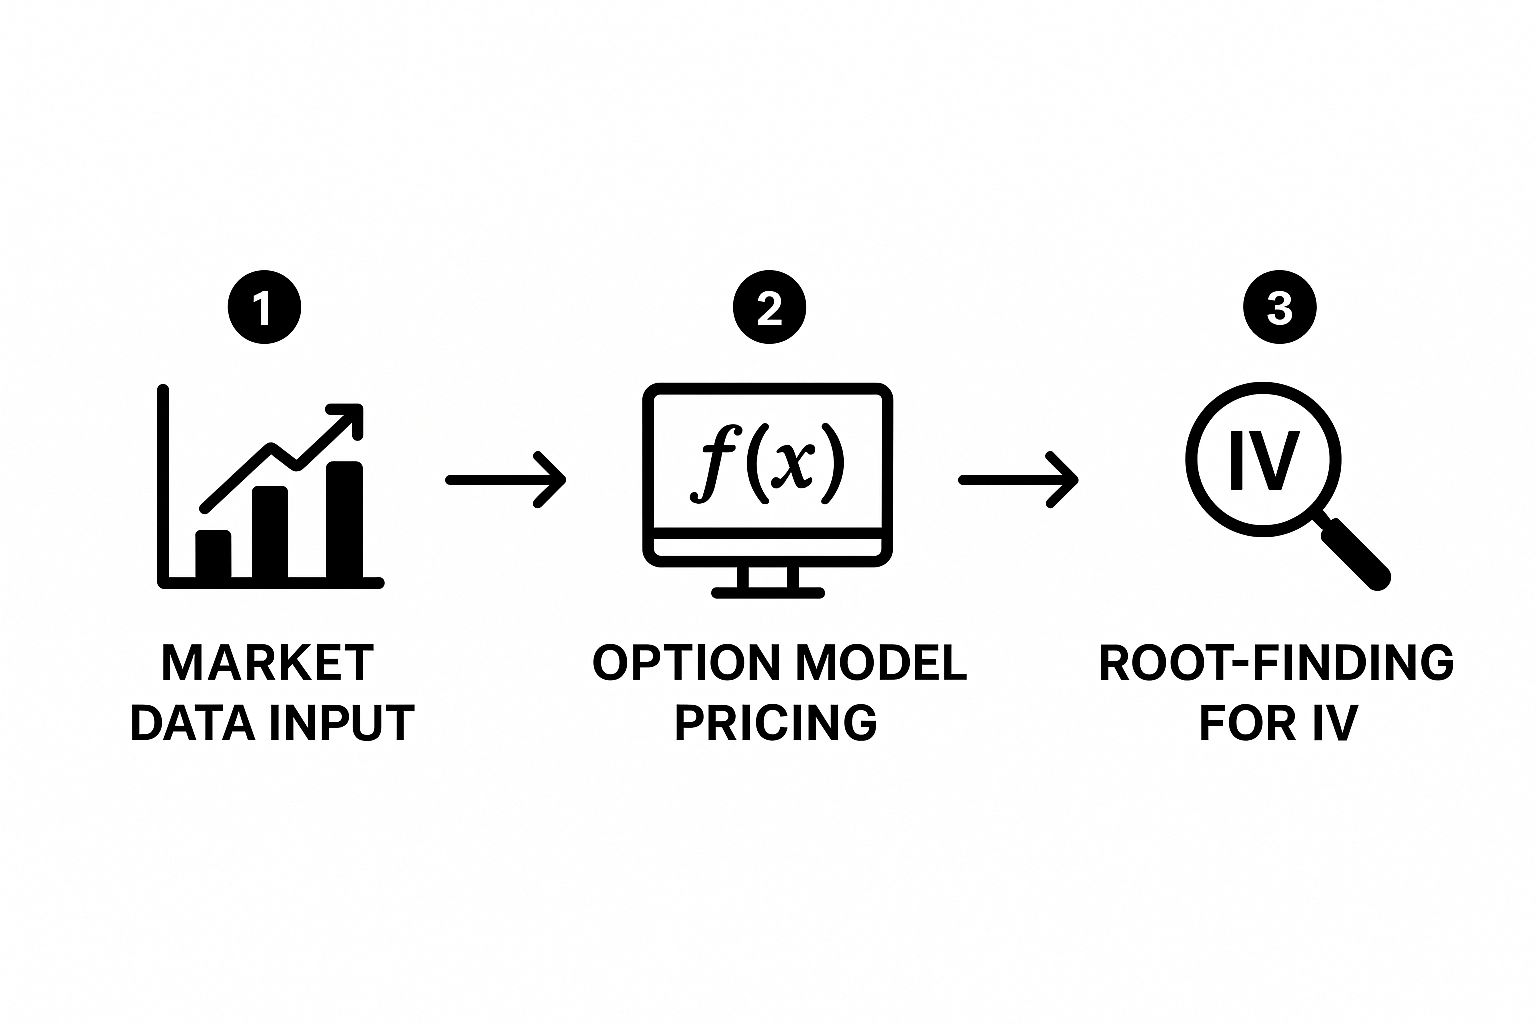
As you can see, the process boils down to three core stages. The real magic happens in the middle, where root-finding algorithms connect the theoretical pricing model with the live market.
Root-Finding Methods: The Brains Behind the Operation
This iterative search isn’t just random guesswork. It’s driven by powerful numerical methods called root-finding algorithms. Their entire job is to find the "root" of the problem—the specific volatility input that makes the difference between the model price and the market price exactly zero.
Two main methods get the job done:
- The Newton-Raphson Method: This is the workhorse—fast, efficient, and the most common approach you'll find. It starts with an initial guess and uses a bit of calculus (specifically, the option's "vega") to make a very educated next guess. It closes in on the correct value extremely quickly.
- The Bisection Method: This one is a bit slower but is incredibly reliable. It works by setting an upper and lower boundary for volatility (say, 0% and 200%) and then systematically slicing the range in half with each attempt. It traps the correct value in a smaller and smaller window until it's found.
In the real world, a trading platform might start with an initial volatility guess of around 50%. From there, the Newton-Raphson method takes over, rapidly adjusting until it finds the correct implied volatility, often in just 4 to 5 iterations. The bisection method, while a solid backup, might take 15 to 20 iterations to get there. You can always explore these numerical approaches to see the efficiency trade-offs for yourself.
Key Insight: Your trading platform isn't solving a simple equation. It's running a high-speed algorithm that relentlessly refines volatility guesses until the model's theoretical price perfectly matches what someone just paid for that option on the exchange.
Let’s Calculate IV for a Real Stock Option
All this theory is great, but let's see how it works with a real-world example. Things click into place much faster when you use a stock you already know. We'll walk through the process using a hypothetical Apple (AAPL) option to tie everything together.
Before any algorithm can work its magic, it needs to pull together a few key pieces of data. The good news? All of it is publicly available.
Rounding Up the Inputs for an AAPL Option
To get started with the Black-Scholes model, we need the raw ingredients. Let's imagine the market looks like this for a specific AAPL call option:
- AAPL's Current Stock Price (S): $195.00
- The Option's Strike Price (X): $200.00 (this is an out-of-the-money call)
- Time to Expiration (t): 30 days left, which we need to express as a slice of a year (30/365 ≈ 0.0822)
- Risk-Free Interest Rate (r): We'll peg this to the U.S. Treasury bill yield, which we’ll say is 5.0% (or 0.05)
- Actual Market Price of the Option: $4.50
That last number—the option's live market price of $4.50—is our target. It’s the answer we're trying to reverse-engineer. The whole point of this exercise is to find the one volatility figure that forces the Black-Scholes formula to spit out a theoretical value of exactly $4.50.
For traders curious about how historical price action shapes these market expectations, diving into a guide to historical stock prices for investors can offer some valuable context.
The Search in Action: How an Algorithm Finds IV
With our inputs locked in, the iterative search kicks off. You can't just plug these numbers into a simple formula and get IV directly. Instead, the system has to start guessing.
An algorithm, like Newton-Raphson, will make an initial educated guess for volatility. A common starting point is something like 50% (0.50). It plugs this guess into the Black-Scholes model along with all our other AAPL data. In this first run, the model might calculate a theoretical option price of $5.10.
That’s too high. We're aiming for $4.50. The algorithm now knows its volatility guess was too aggressive and adjusts.
Based on its internal logic, it makes a new, lower guess—maybe 42%. It runs the calculation again. This time, the model spits out $4.35. Now the result is too low, but we're getting much closer. The algorithm has successfully "bracketed" the correct value between its first two attempts.
This back-and-forth guessing game continues at lightning speed. The system refines its volatility input with each loop—43%, 43.5%, 43.8%—homing in on the target until the model’s output price perfectly matches the $4.50 live market price.
Once the calculated price and the market price are in sync, the hunt is over. The final volatility input it used—let's say it landed on 43.6%—is the implied volatility for that specific AAPL option. That number is the market's consensus forecast for Apple's future price swings over the next 30 days, all derived from what traders were actually willing to pay for the option.
Newton-Raphson vs Bisection Method
When it comes to the "how" of this iterative search, two methods dominate: Newton-Raphson and Bisection. Both get you to the same answer, but they take different paths. Think of it as speed versus stability.
| Feature | Newton-Raphson Method | Bisection Method |
|---|---|---|
| Speed | Very Fast. It often finds the answer in just a few iterations. | Slower. It takes more steps because it methodically halves the search range. |
| Approach | Uses calculus (derivatives) to make intelligent, targeted guesses. | A simpler "divide and conquer" approach. |
| Reliability | Less Stable. Can sometimes fail or produce errors if the initial guess is way off. | Extremely Reliable. It's guaranteed to find a solution if one exists in the range. |
| Best For | High-frequency trading systems where every microsecond counts. | Situations where getting a correct answer is more important than speed. |
Ultimately, most modern platforms lean on Newton-Raphson for its sheer speed, but often have the Bisection method as a reliable fallback in case the first approach stumbles.
Putting Implied Volatility into Context with IV Rank
So, you've run the numbers through an option pricing model and it spits out an implied volatility figure—say, 35% or 50%. But what does that actually mean? A raw number like that is pretty useless on its own.
Think about it. Is 35% IV high? For a sleepy utility stock, that could be a signal of massive uncertainty. But for a biotech company waiting on FDA approval, 35% might just be another Tuesday.
This is where the real art of trading comes in. Instead of getting fixated on a single number, you need context. That's exactly what Implied Volatility Rank (IVR) gives you.
IVR is a simple but powerful tool that tells you whether an option's current IV is high or low relative to its own history. It scores the current IV on a scale of 0% to 100% based on its 52-week range, instantly showing you if options are historically cheap or expensive right now.
Decoding IV Rank for Smarter Trades
The whole point of IVR is to put today's volatility into perspective. Is it inflated, or is it sitting on the floor? Calculating it is dead simple.
Most platforms use this formula:
(Current IV - 52-week Low IV) / (52-week High IV - 52-week Low IV)
Multiply that result by 100, and you have your rank. It’s a clean, 0-to-100 scale that shows where the current IV sits compared to its highs and lows over the last year.
Let’s use Apple (AAPL) as an example. Say its current IV is 32.5%, with a 52-week low of 18% and a 52-week high of 34%. Plug those into the formula, and you get an IVR of 90.6%. That number tells you everything. It screams that Apple's options are trading near the absolute peak of their annual volatility range, making their premiums historically expensive.
If you want to dig deeper into the mechanics, you can find guides that explore how these volatility metrics are calculated in more detail.
Turning IVR into an Actionable Strategy
This single percentage can completely reshape your trading strategy. A high IVR is a green light for sellers, while a low IVR is a gift for buyers.
Here’s how to think about it:
- High IVR (Above 50%, especially 80%+): This means options are expensive. It's prime time for option sellers who want to collect those fat premiums. Strategies like covered calls and cash-secured puts become much more appealing because you're getting paid a premium to take on risk.
- Low IVR (Below 50%, especially 20% or less): Options are cheap. This is a buyer's market. If you’re expecting a big move, buying calls or puts is less costly, which can seriously improve your risk-reward profile.
Using IVR transforms implied volatility from an abstract concept into a practical tool. It helps you quickly decide whether you should be buying or selling options, all based on how the asset has behaved in the past.
Digging a Little Deeper: Your IV Questions Answered
Once you get the hang of the mechanics, a few practical questions almost always come up. I've heard these from traders for years. Getting these straightened out can make a huge difference in how you actually use implied volatility in your own trading.
Let's walk through some of the most common ones so you can move forward with confidence.
Can I Calculate Implied Volatility Without Black-Scholes?
You absolutely can. While Black-Scholes is the industry workhorse for standard, European-style options, it's not the only tool in the shed. Other models, like the Binomial options pricing model, can also be used to back-solve for implied volatility.
The core idea is always the same, no matter which model you use. You take the option's real market price and then work backward, plugging in different volatility numbers until the model's theoretical price matches the market price. More sophisticated models exist for exotic options, but that iterative "hunt" for the right volatility input is a constant.
Why Is Implied Volatility Different for Calls and Puts?
Ever noticed that for the same stock and expiration, an out-of-the-money put often has a higher IV than an out-of-the-money call? This isn't an error; it's a well-known market feature called the volatility skew (or sometimes the "volatility smirk").
This skew exists because traders, especially big institutions, routinely buy put options as a form of portfolio insurance. They are consistently willing to pay a premium to protect their holdings from sudden, sharp market drops. This perpetual demand for downside protection inflates the price of puts, which in turn pumps up their implied volatility.
It’s a direct reflection of market psychology. People simply fear a sudden crash more than they anticipate a slow, steady climb. If you're curious about how investor psychology shapes market behavior, check out our deep dive on risk aversion in our detailed guide.
Expert Insight: Think of the volatility skew as the market pricing in a higher probability of a swift, painful drop than a rapid, euphoric rally. It’s a permanent feature you'll see in just about every equity market.
Is High Implied Volatility a Good or Bad Thing?
This is probably the most important question of all, and the answer isn't a simple yes or no. The truth is, it depends entirely on your strategy. High IV is just a market condition, not an inherently "good" or "bad" signal. It's a situation you can either use to your advantage or get burned by.
Here's the right way to think about it:
- For an option seller, high IV is an opportunity. It means the premiums you collect for selling options (like in a covered call or cash-secured put) are much richer. You're simply getting paid more to take on risk when the market expects a big move.
- For an option buyer, high IV is a major headwind. It makes buying calls and puts significantly more expensive. This raises your break-even point and increases the amount of capital you have to risk on the trade. It’s like buying a plane ticket during the holidays—the price is inflated because of high demand and uncertainty.
Ultimately, implied volatility is just a measure of expected movement and cost. Viewing it as a simple "good" or "bad" signal is a classic rookie mistake that can lead to some really poor trading decisions.
At Fear Greed Tracker, we provide real-time market sentiment data to help you navigate these exact conditions. Our tools are designed to show you when fear (and high volatility) is peaking, helping you spot opportunities to sell premium or know when it's better to stay cautious. Make data-driven decisions by exploring our platform at https://feargreedtracker.com.