
Think of leading economic indicators as the economy's early warning system. These are key data points that shift before the overall economy changes direction, giving you a sneak peek into future booms or busts.
They’re like a weather forecast for your portfolio. Instead of just reacting to the storm, you get a heads-up that it’s coming.
The Economy’s Canary in the Coal Mine
If you were sailing a ship, you wouldn't just stare at the waves crashing against your hull to know what's next. You’d be checking the barometer, watching the clouds, and feeling the wind shift. Those are the signs of what’s on the horizon.
That’s exactly what leading economic indicators do for investors, business owners, and policymakers. They are the financial world’s version of a falling barometer, offering invaluable clues that help you anticipate what’s ahead instead of just reacting to it.
By keeping an eye on these signals, you can make smarter decisions—whether that means tweaking your investment strategy, delaying a major business expansion, or adjusting economic policy.
The Three Flavors of Economic Indicators
To really get why leading indicators are so powerful, it helps to see how they stack up against the other types. Generally, we can bucket economic indicators into three categories based on when they move relative to the economy.
Let's break down the timing of these indicators to see how they fit together.
A Quick Guide to Economic Indicator Types
| Indicator Type | Timing of Change | Example |
|---|---|---|
| Leading | Changes before the economy | Stock market performance |
| Lagging | Changes after the economy | Unemployment rates |
| Coincident | Moves with the economy | Personal income levels |
As you can see, each one gives you a different piece of the puzzle. Lagging indicators confirm what already happened, and coincident indicators tell you what's happening right now. But only leading indicators give you a glimpse into the future.
This visual shows how some of the most reliable leading indicators are tied directly to the core drivers of the economy—what businesses and consumers are actually doing.
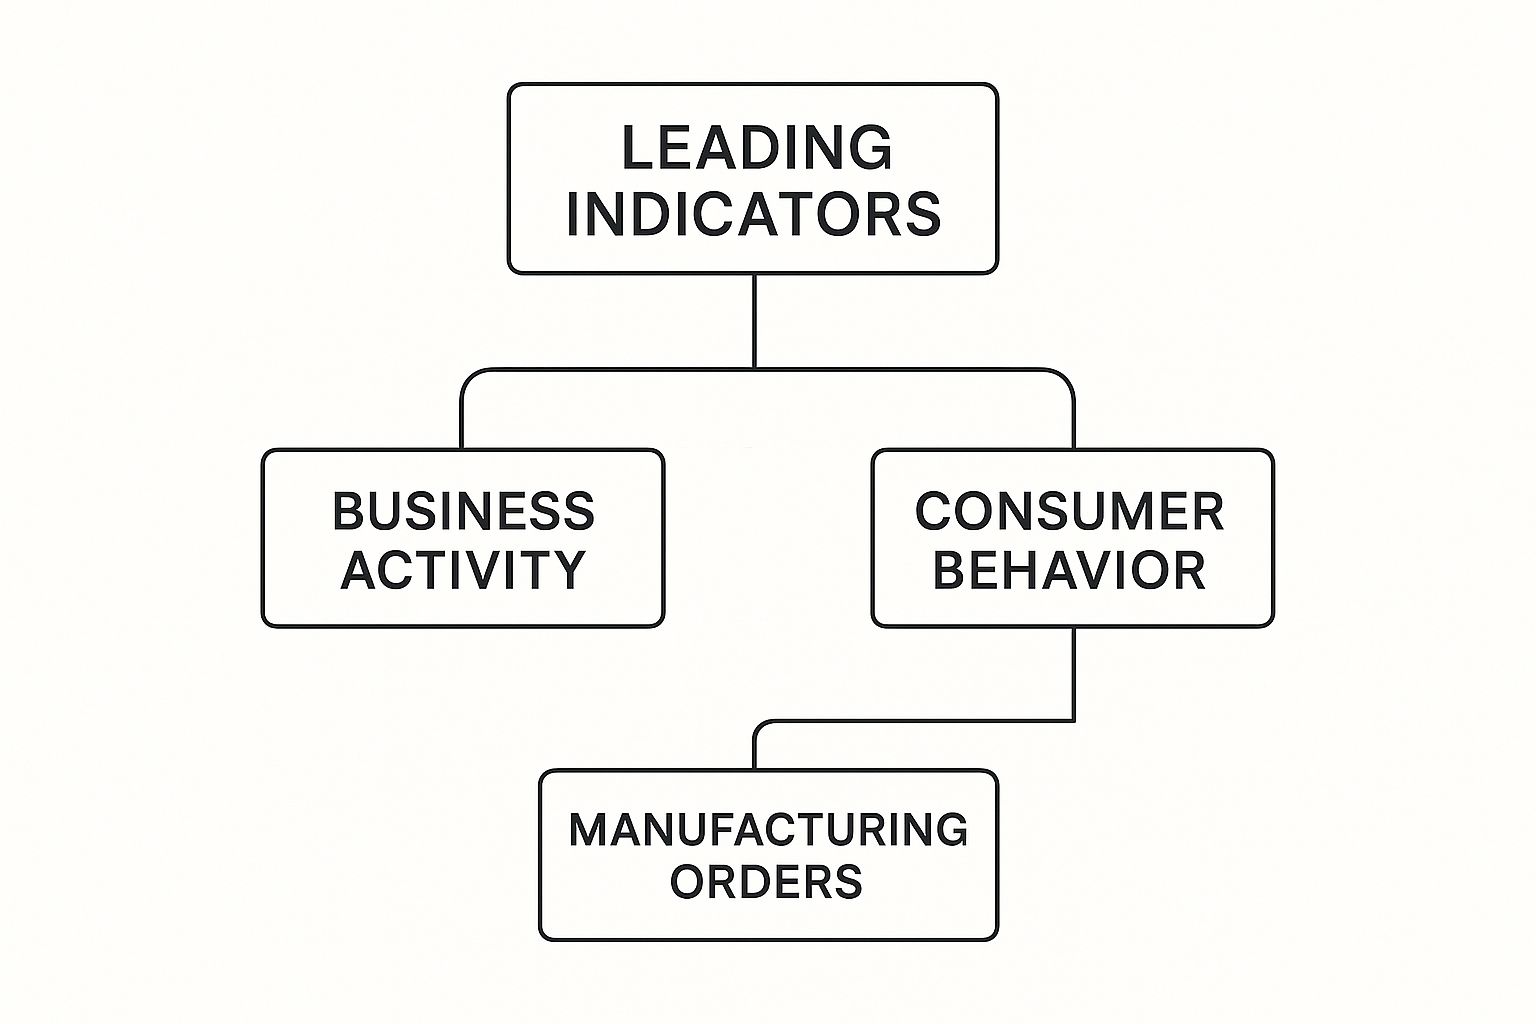
Something as fundamental as new orders for manufactured goods is a powerful signal. When businesses start ordering more stuff, it’s a good bet that broader economic activity is about to pick up.
Key Takeaway: The real magic of a leading indicator is its predictive power. While others confirm the past or describe the present, leading indicators are all about forecasting what's next.
This forward-looking ability makes them an absolute cornerstone of market analysis. Monitoring these metrics gives you a massive strategic edge.
If you’re interested in how these economic signals tie into market psychology, our a guide to stock market sentiment indicators is a great next step. Ultimately, understanding leading indicators is the first move toward anticipating market shifts instead of just being surprised by them.
Why These Economic Forecasts Matter for Your Decisions

Getting a handle on leading economic indicators isn't just an academic exercise—it's about giving yourself a real, strategic edge in your financial life. These forward-looking signals act as a bridge, connecting abstract economic data to the tangible decisions you make every single day.
Think of them as a roadmap for the economic terrain ahead, whether you're an investor, a business owner, or just planning for your family's future.
For an investor, these forecasts are gold. Seeing a steady drop in manufacturing orders alongside fewer building permits could be the whisper of a coming recession. An investor who’s paying attention can rebalance their portfolio before the market takes a nosedive, maybe shifting from high-growth stocks into more defensive assets.
It's the same story for a small business owner. If consumer confidence is on the rise and jobless claims are falling, that could be the green light to invest in new equipment or hire more staff to meet the demand that’s likely just around the corner. On the flip side, negative trends serve as an early warning to tighten the belt, conserve cash, and put major expansion plans on hold.
From Data Points to Real-Life Plans
The real magic happens when you see how these indicators apply to your own personal finances. Let's say you’re thinking about buying your first home. Keeping an eye on building permits can give you clues about the future housing supply in your area, which directly impacts price trends.
Even a recent grad just starting their career can use this stuff. Watching the weekly initial jobless claims gives you a real-time pulse on the job market's health, helping you figure out your negotiating power and what your career prospects actually look like.
These indicators aren't just numbers on a screen; they are reflections of future economic reality. By learning to read them, you can anticipate change and position yourself to benefit from it rather than being caught off guard.
One of the most powerful tools out there is The Leading Economic Index (LEI) from The Conference Board, which cleverly bundles ten individual indicators into a single, comprehensive forecast.
For example, as of July 2025, the LEI dipped by 0.1%, right after a 0.3% decline in June. Even more telling, the index contracted by 2.7% in the six months between January and July 2025. That's a much steeper drop than the 1.0% dip in the previous six-month period—a clear signal of potential weakness ahead.
A Smarter Decision-Making Framework
At the end of the day, leading economic indicators give you the context you need to be proactive instead of reactive with your finances. They empower you to make moves based on where the economy is probably headed, not just where it’s been.
This is a cornerstone of building a truly resilient financial strategy. By weaving these forward-looking insights into your thinking, you can get much smarter about how you approach both risk and opportunity.
To take it a step further, check out our guide to master the investment decision-making process for smarter investing. Plugging these economic signals into a solid framework is how you turn raw data into actionable wisdom for your portfolio.
The Most Important Leading Indicators to Follow
 Now that we're clear on why these forecasts are so valuable, let's get our hands dirty. It’s time to build a watchlist of the most important leading economic indicators you should follow. Think of it as your own personal economic dashboard.
Each metric tells a unique story about a specific corner of the economy. When you put them all together, they paint a surprisingly clear picture of what’s just around the corner.
By keeping an eye on just a handful of these key signals, you can stop reacting to market news and start anticipating what's coming next. These are the exact data points that top economists and professional investors watch like hawks, and for a good reason—they have an uncanny track record of calling the economy’s next move.
The Stock Market (S&P 500)
There's a reason people say the stock market is the ultimate leading indicator. It’s not just a bunch of numbers; it's the collective wisdom—and future bets—of millions of investors. A rising S&P 500 is a giant vote of confidence, suggesting that investors are optimistic about future corporate profits and the economy as a whole.
On the flip side, a sustained downturn can be a serious red flag, signaling that the smart money is bracing for impact. The market is always looking ahead, pricing stocks based on what investors think companies will earn in the future, not what they earned last quarter.
Manufacturing Activity (PMI)
The Purchasing Managers' Index (PMI) is one of the best real-time snapshots of the manufacturing sector's health. It’s not a government report bogged down by revisions; it's a monthly survey asking purchasing managers on the ground one simple question: "How's business?"
The magic number is 50. A reading above 50 means the manufacturing sector is growing. Below 50, it's shrinking. Because manufacturing sits at the very start of the supply chain, a slowdown in new orders here is often the first domino to fall before a wider economic slump.
Building Permits (New Private Housing Units)
Few things scream "future economic activity" louder than construction. Before a single shovel can hit the dirt for a new home or apartment building, a building permit has to be issued. It’s a literal license to grow.
This makes the number of new building permits a direct forecast of future construction spending, jobs for skilled tradespeople, and a wave of consumer spending on everything from refrigerators to couches. A sudden drop in permits is one of the earliest and most reliable warnings of an economic chill.
Why It Matters: Building permits are a blueprint for future economic activity. A surge in permits today means more construction jobs and consumer spending tomorrow, while a slump signals that the construction pipeline is drying up.
The Yield Curve
The yield curve might sound intimidating, but it’s one of the most famous and reliable recession predictors we have. It simply compares the interest rates (or yields) on short-term government bonds to long-term ones. Normally, you get paid more to lock your money up for longer, so long-term bonds have higher yields.
But every so often, that relationship flips upside down—and short-term bonds start paying more than long-term ones. This is called an inverted yield curve, a rare event that has come before nearly every U.S. recession in the last 50 years. It’s a huge sign of pessimism, showing that investors are so worried about the near future that they’re piling into long-term bonds for safety, even at a lower payout.
Consumer Confidence and Spending
In the U.S. economy, the consumer is king. Since consumer spending accounts for the vast majority of economic activity, how people feel about their financial situation is a really big deal. The Consumer Confidence Index (CCI) measures exactly that—public sentiment about jobs, finances, and the economy.
Here are the key consumer-related numbers to watch:
- Initial Jobless Claims: This weekly report counts how many people filed for unemployment for the first time. A steady rise is a clear sign of weakness in the job market.
- Retail Sales: This measures the total sales from all retail stores. It's a direct pulse on whether people are actually opening their wallets.
When confidence is high and jobless claims are low, people feel secure enough to make big purchases, which fuels the entire economy. But when confidence starts to crack, it’s an early warning that this powerful engine might be about to stall.
How to Read the Signals the Economy Is Sending
Knowing which leading economic indicators to watch is just the first step. The real skill is learning to interpret what they're saying together, like a detective connecting clues to solve a case.
No single indicator tells the whole story. Their true power comes from the collective message they send when you line them up.
Think of it as seeking a second, third, and even fourth opinion before making a big decision. This helps you spot a credible, underlying trend instead of just reacting to a single month of noisy data.
A strong trend is one where multiple, unrelated indicators start pointing in the same direction. For instance, if the S&P 500 is climbing, building permits are up, and initial jobless claims are falling all at once—that's a powerful and consistent signal that good times are likely ahead.
Weighing Conflicting Signals
But what happens when the signals clash? This is where the real analysis begins.
Imagine a scenario where manufacturing new orders are rising—a traditionally bullish sign—but the Consumer Confidence Index takes a sharp nosedive. This is a classic tug-of-war between the business and consumer sides of the economy.
Here’s how you might break it down:
- Rising Manufacturing Orders: This suggests businesses are optimistic about future demand and are stocking up. It’s a good sign for production and jobs down the line.
- Falling Consumer Confidence: This tells you households are getting worried about their finances, which could lead them to cut back on spending. Since consumer spending is a massive driver of the economy, this is a major red flag.
In this situation, you can’t just ignore one signal. The manufacturing data might hint at near-term strength, but the slump in confidence is a serious warning about whether that strength can last. It's why you have to see the bigger picture. Understanding how to analyze market trends for smarter investing is essential for connecting these dots.
The goal isn't to find an indicator that's always right, but to build a mosaic of data that gives you a probable forecast. Conflicting signals often mean the economy is at an inflection point, where caution is the best approach.
Magnitude and Duration Matter
Finally, always consider the magnitude of the change and the duration of the trend.
A tiny 0.1% dip in an index for one month is probably just noise. But a steep 3% drop that continues for three consecutive months? That's a clear, actionable signal.
Looking at broader data provides critical context. For example, in June 2025, the U.S. trade deficit fell to $60.2 billion, personal income rose by 0.3%, and consumer spending also ticked up. This resilience, coupled with a real GDP growth jump to a 3.0% annual rate in Q2 2025, paints a much more robust picture than any single indicator could alone. You can find more of these insights directly from the Bureau of Economic Analysis on BEA.gov.
Here's a quick cheat sheet for interpreting what these trends might mean.
Decoding Indicator Trends
| Indicator | What a Rising Trend Suggests | What a Falling Trend Suggests |
|---|---|---|
| S&P 500 | Investor optimism, potential for economic growth. | Investor pessimism, potential for a slowdown or recession. |
| Building Permits | Confidence in the housing market and future construction. | Weakening housing market and reduced construction activity. |
| Initial Jobless Claims | A strengthening labor market with fewer layoffs. | A weakening labor market with increasing layoffs. |
| Consumer Confidence | Households are optimistic and more likely to spend. | Households are worried and may cut back on spending. |
| Manufacturing New Orders | Businesses anticipate higher demand and are ramping up. | Businesses expect lower demand and are scaling back. |
This table simplifies the signals, but remember to always view them as part of a larger story.
By looking for confirmation, weighing conflicts, and paying attention to the size and length of a trend, you can move beyond simple data points and start building a truly reliable economic forecast.
Taking a Global View of Economic Indicators

In today’s hyper-connected world, no economy is an island. A factory slowdown in one country can trigger supply chain chaos and stock market jitters thousands of miles away. It’s a ripple effect we can't ignore.
This is why looking only at domestic data gives you half the story. To build a truly solid forecast, you have to zoom out and look at the health of the entire global economy. A dip in China’s manufacturing PMI, for instance, isn’t just a local problem—it can signal weaker demand for US tech components or raw materials from South America.
Connecting Global Economic Dots
This is where big international organizations like the Organisation for Economic Co-operation and Development (OECD) and the International Monetary Fund (IMF) come in handy. They compile what are known as composite leading indicators (CLIs), which bundle data from multiple countries to give you a big-picture forecast for entire regions, like the Eurozone or all emerging markets combined.
These global indicators help answer the kind of questions that keep investors and business leaders up at night:
- Will European consumer confidence affect American exports? If people overseas feel good about spending, that could mean stronger sales for US companies.
- How will a slowdown in Southeast Asia impact global shipping costs? Weaker production often means less demand for cargo space, which can drive down prices.
- Are emerging markets a source of growth or risk right now? Their performance can sway everything from global commodity prices to overall investor mood.
A global perspective isn't just a nice-to-have anymore; it's essential. What happens in one economy rarely stays in that economy.
Why Emerging Markets Are Key
On a global scale, leading indicators are crucial for spotting growth trends and potential downturns across the world's major economies. For example, the IMF's World Economic Outlook from April 2025 projects that emerging market economies are set to grow their real GDP by 3.7% in 2025.
That number might not sound huge on its own, but it's more than double the 1.4% average growth forecast for advanced economies. This matters because emerging markets now account for a whopping 60.64% of the world's GDP (measured by purchasing power parity). Their influence on global economic activity is massive and still growing. You can dig into the numbers yourself in the IMF's World Economic Outlook reports.
Ultimately, analyzing international data adds that final, crucial layer of context. It turns your forecast from a regional snapshot into a panoramic view of the forces shaping global markets, giving you a much smarter, more complete foundation for your decisions.
Your Top Questions About Economic Indicators, Answered
Alright, we've covered a lot of ground. Think of leading indicators as the economy's early warning system. But how does this all work in practice? Let's tackle some of the most common questions that pop up when you're first getting the hang of these signals.
Getting these details straight is the final piece of the puzzle. It helps you move from knowing the concepts to confidently using them in your own analysis.
What Is the Single Most Reliable Leading Economic Indicator?
Everyone wants to know if there's one magic signal that gets it right every time. The honest answer? Not really. The real power comes from seeing a chorus of indicators all singing the same tune. You're building a case, not betting the farm on a single piece of data.
That said, if I had to pick, a couple of indicators have a ridiculously strong track record that most economists respect.
Key Insight: While nothing is foolproof, the inverted yield curve and The Conference Board's Leading Economic Index (LEI) are two of the most historically accurate predictors of a coming recession.
An inverted yield curve—where short-term bonds start paying more than long-term ones—has been an almost perfect recession predictor for the last 50 years. Likewise, the LEI is a beast because it bundles ten different indicators into one score, giving you a much broader and more reliable view.
How Far in Advance Can These Indicators Predict a Recession?
This is where leading indicators really shine. They give you a heads-up long before the storm actually hits, giving you precious time to adjust your financial or business plans.
Typically, you can get a warning anywhere from 6 to 18 months in advance. The exact timing changes with each economic cycle and which indicator you're watching. For example, a yield curve inversion has historically given a heads-up about 12 to 18 months before a recession officially began.
Think of it less like a precise countdown and more like the economy putting up storm warning flags on the horizon.
Where Can I Find Reliable Data on These Indicators?
When it comes to economic data, your source is everything. Sticking to official, unbiased sources means you're working with clean information, not someone's hot take. The good news is that all the primary data is free and publicly available.
Here are the go-to places to get the same data the pros use:
- Bureau of Economic Analysis (BEA): Your main stop for GDP, personal income, and trade data.
- Bureau of Labor Statistics (BLS): This is where you'll find the all-important jobs data, like weekly jobless claims.
- The Conference Board: A non-profit that publishes the composite Leading Economic Index (LEI) and the Consumer Confidence Index (CCI).
- Institute for Supply Management (ISM): The official source for the Purchasing Managers' Index (PMI), a critical health check on the manufacturing sector.
By using these primary sources, you can see the raw numbers for yourself and start drawing your own conclusions about what the economy is trying to tell you.
Navigating market sentiment is complex, but with the right tools, you can turn economic signals into a strategic advantage. Fear Greed Tracker provides real-time sentiment scores for over 50,000 assets, helping you understand the market's mood and make data-driven decisions. Take control of your investment strategy by visiting https://feargreedtracker.com today.