
Fundamental analysis is all about figuring out what a company is really worth. Forget the daily stock market noise for a second. This is about being a business detective, popping the hood to see if the company is a well-oiled machine or a clunker about to break down.
It’s the difference between gambling on a stock ticker and investing in an actual business.
Decoding a Company's True Worth
Think of it like buying a house. You wouldn't just look at the asking price and sign the papers. You'd get an inspection, check the foundation, look at the neighborhood, and review property taxes. You’re trying to determine its real value, separate from what the seller is asking.
Fundamental analysis is that home inspection, but for a company. It's a deep dive into the business itself, looking at everything that makes it tick.
The Investor's Toolkit
So, what exactly are you looking for under the hood? It boils down to a few key areas:
- Financial Health: This is non-negotiable. You have to comb through the financial statements—the income statement, balance sheet, and cash flow statement—to see if the company is genuinely profitable and stable.
- Management Quality: Who's running the show? A great business can be ruined by bad leadership. You want to see an experienced, visionary team with a solid track record.
- Competitive Advantage: What makes this company special? This is its "economic moat"—that unique edge that keeps competitors at bay, like a strong brand, proprietary technology, or network effects.
- Industry Conditions: Even a great company can struggle in a dying industry. You need to understand the bigger picture—the economic trends and industry shifts that could help or hurt its future.
The entire point is to calculate a company's intrinsic value. If the stock is trading on the market for a price far below your calculated value, you’ve likely found an undervalued gem—a potential buying opportunity.
To get a clearer picture of where this method fits, let's quickly compare it to its main rival, technical analysis.
Fundamental Analysis vs Technical Analysis Key Differences
This table breaks down the core differences between the two main schools of thought in investing. It helps you see why fundamental analysis is focused on the why behind a stock's value, not just the what of its price movements.
| Aspect | Fundamental Analysis | Technical Analysis |
|---|---|---|
| Core Focus | A company's intrinsic value and financial health. | Historical price charts, patterns, and trading volume. |
| Time Horizon | Long-term investing (months to years). | Short-term trading (days to weeks). |
| Key Question | "Is this a good business to own?" | "When is the right time to buy or sell?" |
| Primary Tools | Financial statements, economic data, industry reports. | Stock charts, indicators (like RSI, MACD), trend lines. |
| Goal | Buy undervalued assets and hold for long-term growth. | Profit from short-term price fluctuations. |
While technical analysis can be useful for timing trades, fundamental analysis is the bedrock for making solid, long-term investment decisions based on a business's actual performance and potential.
A Time-Tested Strategy
This isn't some new-fangled idea. The principles were laid down by the godfathers of value investing, Benjamin Graham and David Dodd, in their legendary 1934 book, Security Analysis.
They taught generations of investors—including Warren Buffett—to think of stocks as ownership stakes in real businesses, not just blips on a screen.
The game plan is simple but powerful: find great companies, and buy them when they're on sale. To do that, you first need a reliable way to figure out what they're actually worth, which means learning how to calculate its intrinsic value.
By focusing on these deep-rooted business fundamentals, you can build the confidence to ignore the market's manic swings and invest for the long haul. After all, quality eventually gets noticed.
The Science and Art of Evaluating a Business

Getting fundamental analysis right isn't just about crunching numbers. It’s a delicate dance between objective data and subjective judgment.
Think of it like being a detective. You need the hard evidence—the financial statements and sales figures—but you also have to understand the people, the motives, and the story behind the company.
This process breaks down into two equally important parts: quantitative and qualitative analysis. Getting a feel for both is what separates a good investor from a great one. It's how you build a complete picture of what a company is truly worth.
The Science: Quantitative Analysis
This is the "science" part of the equation. It’s all about measurable, verifiable data that you can sink your teeth into. We’re talking about digging into a company's financial statements—the balance sheet, income statement, and cash flow statement—to get a concrete read on its health and performance.
Quantitative analysis is objective. The numbers don't lie.
Here are the core elements you’ll be looking at:
- Revenue and Profit Growth: Is the company making more money over time? You want to see healthy, steady growth. It’s a powerful sign of a strong business.
- Profit Margins: For every dollar in sales, how much does the company actually keep as profit? High or improving margins point to efficiency and pricing power.
- Debt Levels: How much debt is the company carrying compared to its assets or equity? Too much debt is a red flag, especially when the economy gets rocky.
- Return on Equity (ROE): This is a big one. It shows you how well the company is using shareholder money to make more money.
This data tells a clear story about what the business has done. For example, when a company like Lockheed Martin reports that 74.2% of its Q3 2024 sales came from the U.S. government, that's a hard number. It tells you exactly how much it relies on public sector contracts.
Quantitative analysis gives you the cold, hard facts. It’s an unbiased look at a company's financial foundation, making it the essential starting point for any serious investigation.
The Art: Qualitative Analysis
While the numbers give you a snapshot of the past, qualitative analysis helps you see into the future. This is the "art" of the process. It involves looking at all the intangible stuff that doesn't show up on a balance sheet but can absolutely make or break a company.
These factors are subjective. They require good judgment, industry knowledge, and a bit of intuition.
Key qualitative factors include:
- Management Quality: Who’s running the show? You want an experienced, honest, and visionary leadership team. A great CEO can steer a company through anything.
- Brand Strength: Does the company have a powerful, trusted brand? Think of the loyalty that Apple or Coca-Cola commands. That's worth a fortune.
- Competitive Advantage: What’s the company’s "economic moat"? This is the special something—unique tech, a powerful network, or cost advantages—that keeps competitors at bay.
- Corporate Governance: Are the company’s internal practices fair and transparent? Good governance builds trust with investors and reduces nasty surprises down the road.
A company with amazing earnings (quantitative) becomes an even better bet when it's also run by a brilliant CEO with a rock-solid brand (qualitative). When you combine these two approaches, you get a robust, 3D view of a business and its true, long-term potential.
Financial Metrics That Tell the Real Story

Cracking open a company's financial report can feel like trying to read a map in a foreign language. The numbers are all there, but what do they actually mean? To get to the truth of a company's health, you have to cut through the noise and focus on a few key metrics that tell the real story.
These ratios are the vital signs of a business. They help you answer the big questions: Is it profitable? How efficiently is it run? Is it drowning in debt? Getting comfortable with these numbers is a non-negotiable skill in fundamental analysis.
Earnings Per Share (EPS)
Let's start with the most direct measure of profitability: Earnings Per Share (EPS). Think of it as your personal slice of the company’s profit pie. You calculate it by taking the company’s total profit and dividing it by the number of outstanding shares. Simple.
A higher EPS is usually a good thing, but the real magic is in the trend. An EPS that consistently climbs year after year is a huge green flag, signaling that the business is getting more profitable over time. It’s the foundation for figuring out a company's earning power on a per-share basis.
Price-to-Earnings (P/E) Ratio
So, if EPS tells you what a company earns, the Price-to-Earnings (P/E) Ratio tells you what you're paying for those earnings. It’s a straightforward comparison of the company's stock price to its earnings per share.
Imagine you want to buy a coffee shop that makes $50,000 in profit each year. If the asking price is $500,000, you’re paying 10 times its annual earnings. That gives it a P/E of 10. This little ratio is your go-to for figuring out if a stock is cheap or expensive compared to its profit.
A high P/E might mean the market is betting on massive future growth. A low P/E, on the other hand, could be a sign of a potential bargain just waiting to be found.
Debt-to-Equity (D/E) Ratio
Next up, you have to check the company’s financial stability. For that, the Debt-to-Equity (D/E) Ratio is your best friend. This metric stacks up the company’s total debt against the total shareholder equity. Basically, it shows you how much a company relies on borrowing money to keep the lights on.
A high D/E ratio—anything over 1.0 is often a warning sign—means the company is leaning more on debt than its own funds. That can get risky, fast, especially when the economy takes a nosedive. A low D/E points to a more stable, conservative financial setup.
Key Takeaway: No single metric tells the whole story. A company might have a fantastic EPS but a terrifyingly high D/E ratio. You have to look at these numbers together to build a complete, balanced picture of the company's health.
Return on Equity (ROE)
Finally, there’s Return on Equity (ROE). This one tells you how good the management team is at using investors' money to make more money. It measures net income as a percentage of shareholder equity. A company with a consistently high ROE is often a sign of a well-oiled machine with a solid competitive advantage.
To really put these metrics into perspective, you need to look back. Tracking a company’s performance over several years lets you see how ratios like P/E, ROE, and D/E hold up through different economic cycles. This context is what separates a good guess from a great investment. To see how analysts get this historical data, you can discover more insights about using data for fundamental analysis on daloopa.com.
Choosing Your Analytical Approach
Once you have a handle on the key metrics, the real work begins: deciding where to start your search. Investors usually lean on one of two strategic frameworks to hunt for opportunities. Think of them as different ways to use a map to find hidden treasure—one starts with a bird's-eye view of the whole world, while the other begins with a specific spot on the ground.
These two methods are the top-down and bottom-up approaches. Neither is necessarily better, but one will likely feel more natural for your personal investment style and goals. Getting to know both is crucial for building a flexible and effective analytical process.
Top-Down Analysis: The Telescope View
The top-down approach is like using a telescope to scan the night sky. You start with the biggest picture possible and slowly zoom in. An investor using this method first looks at the overall economy (macroeconomics), keeping an eye on broad trends like GDP growth, inflation, and interest rates.
From there, they pinpoint which sectors are most likely to thrive in that economic climate. For example, if interest rates are expected to fall, the housing and construction sectors might suddenly look very attractive. Only after finding a strong sector do they start digging for the best-performing individual companies within it.
- Step 1: Analyze the overall economy (both global and national).
- Step 2: Identify promising industries or sectors based on those big-picture trends.
- Step 3: Zero in on the most financially sound and undervalued companies within those sectors.
This method is perfect for investors who believe that broad economic tides lift (or sink) all boats.
Bottom-Up Analysis: The Microscope View
On the flip side, the bottom-up approach is more like using a microscope. You ignore the big picture at first and focus intensely on one specific thing—an individual company. This strategy is built on the idea that a truly exceptional business can succeed no matter what the broader economy or its industry is doing.
An investor using this strategy hunts for great companies first, focusing on their unique strengths like incredible management, a dominant brand, or rock-solid financials. Legendary investor Warren Buffett is a famous champion of this style, always looking for "wonderful companies at fair prices." The health of the overall economy is a distant, secondary thought.
The core belief of bottom-up investing is that a high-quality company will outperform its peers and the market over the long term, making it the primary focus of the analysis.
While these two approaches guide where you look, they both rely on the same core valuation techniques to figure out what a company is truly worth. The infographic below outlines the three main models used to calculate that all-important intrinsic value.
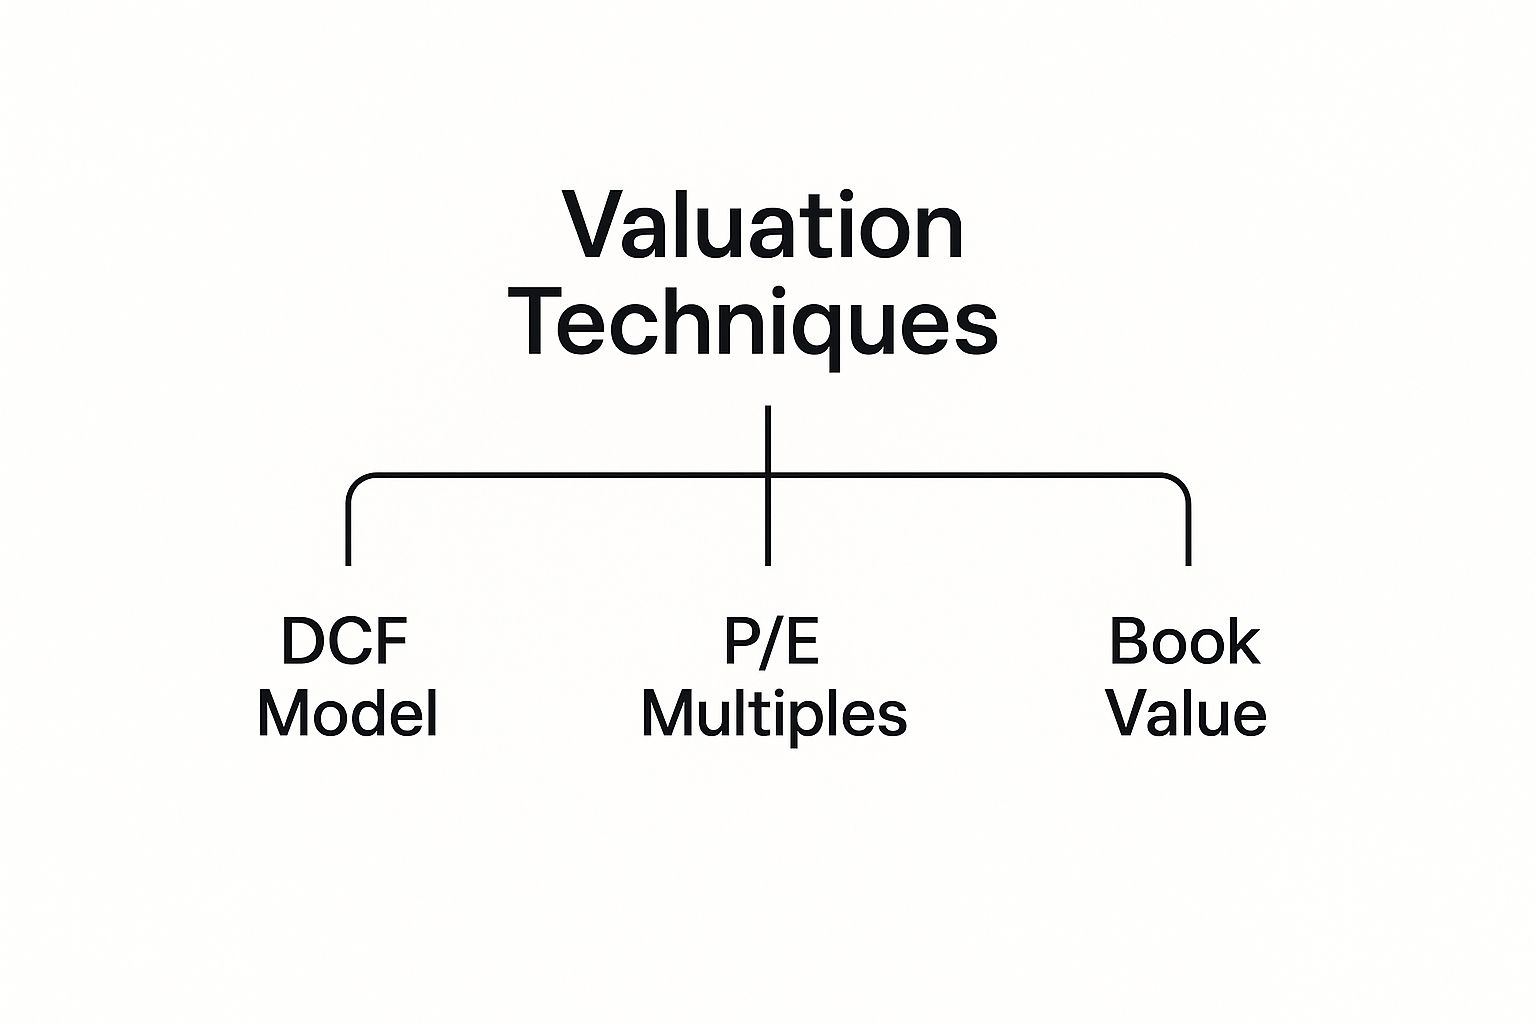
Whether you start from the top or the bottom, you'll eventually use methods like DCF models or P/E multiples to make your final call. Fundamental analysis is its own distinct discipline, completely separate from its counterpart which focuses on market charts and price patterns. To learn more about that other major school of thought, check out our beginner’s guide to technical analysis.
Putting Fundamental Analysis Into Action

Theory is great, but what does this look like on the ground? Let's walk through a quick, practical example with a fictional company—we'll call it "InnovateTech Inc."—to see how these ideas come together.
This is where abstract numbers start telling a real story, helping you form a solid investment thesis.
Our goal is simple: figure out if InnovateTech is a good buy by looking at its financials and its place in the market. Think of it as a repeatable checklist you can use for your own research.
Step 1: Digging Into the Numbers (The Quantitative Story)
First up, we pull InnovateTech's latest financial reports. We're not just grabbing numbers; we're hunting for clues about the company's health and momentum.
Here’s what we find:
- Earnings Per Share (EPS): InnovateTech is reporting an EPS of $5.00. Even better, its EPS has been growing at an average clip of 15% every year for the last five years. That’s a clear sign of consistent, strong profitability.
- Price-to-Earnings (P/E) Ratio: The stock is trading at $100 per share. With a $5.00 EPS, that gives us a P/E ratio of 20 (100 divided by 5). The industry average is 22, so this suggests the stock might be reasonably priced, not overhyped.
- Debt-to-Equity (D/E) Ratio: The company’s D/E ratio is a low 0.4. This is a great sign. It tells us InnovateTech isn’t drowning in debt and relies more on its own money to grow.
Just from these three metrics, InnovateTech is starting to look like a financially solid, growing business. Now for the other half of the story.
Step 2: Sizing Up the Intangibles (The Qualitative Strengths)
A great company is always more than its spreadsheet. Qualitative factors are what give a business staying power and an edge for the future.
For InnovateTech, a few things stand out that you'd never find in a financial report. It has a visionary CEO known for killer product instincts and a brand that customers absolutely love.
On top of that, the company has a strong "economic moat"—its software ecosystem is so sticky that it's a huge pain for customers to even think about switching to a competitor. This mix of leadership, loyalty, and lock-in is a powerful competitive advantage.
By combining the "what" (the numbers) with the "why" (the qualitative strengths), we build a much stronger investment case. The positive financials are reinforced by a business that is built to last.
Step 3: Building the Investment Thesis
Okay, let's connect the dots.
We have a profitable, financially healthy company in InnovateTech. It also boasts a powerful brand, fantastic leadership, and a protective moat that keeps rivals at bay. To top it off, its P/E ratio suggests we aren't being asked to overpay for the stock.
Our investment thesis writes itself: InnovateTech is a high-quality company trading at a fair price. Its strong numbers and durable business advantages point to solid long-term growth potential.
This is the heart of fundamental analysis—blending hard data with strategic insight. It's the exact process you need to master when you want to find undervalued stocks for your portfolio. Follow these steps, and you’re no longer just watching the market; you’re making informed decisions.
Got Questions About Fundamental Analysis? We've Got Answers
Diving into fundamental analysis always sparks a few questions. Once you move past the theory and start trying to apply it, the practical side of things can feel a little tricky. Let's tackle the most common questions investors ask to help you get started on the right foot.
How Long Does This Actually Take for One Company?
Honestly, there’s no single answer. The time you put in can swing wildly depending on how deep you want to go.
A quick first pass might only take an hour. In that time, you can scan the key financial ratios and get the gist of the business model. That’s often enough to decide if a company is even worth a second look.
But a full-blown analysis for a serious investment? That could easily stretch into several days, or even weeks. You’d be poring over annual reports, listening to earnings calls, and digging into the competition. For now, just focus on learning the process, not rushing it. Speed comes with practice.
Is Fundamental Analysis Just for Long-Term Investors?
For the most part, yes. The whole point of fundamental analysis is to figure out what a company is truly worth—its intrinsic value. That's a long-term game. You’re making a bet that, eventually, the market will wise up and recognize the company's real value. This can take months, but more often, it takes years.
It's the polar opposite of short-term trading. Traders working on a daily or weekly timeline usually lean on technical analysis, which is all about predicting immediate price moves based on chart patterns and market buzz.
Key Insight: Fundamental analysis isn't about timing the market; it's about owning a piece of a great business and having the patience to watch it grow. Think of it as an investing strategy, not a trading tactic.
Can I Do This If I’m Not a Math Whiz?
Absolutely. While you’ll definitely be looking at numbers, the math involved is pretty basic—think addition, subtraction, multiplication, and division. You won't need to dust off your old calculus textbook to evaluate a stock.
The real skill here is interpretation. Calculating a P/E ratio is easy. The hard part is understanding what that number means for this specific company, in this particular industry, right now. Plus, most financial websites and brokerage platforms do the number-crunching for you, so the key data is always at your fingertips.
What’s the Biggest Downside to Fundamental Analysis?
Its greatest weakness is that it relies on past data to make educated guesses about the future—and sometimes, those guesses are flat-out wrong. An analyst might project fantastic earnings, only for a surprise competitor or a market downturn to throw a wrench in the works.
There’s also the classic problem of the market staying "irrational" longer than you can stay solvent. A stock you’ve correctly identified as a bargain could keep getting cheaper for a long, long time before anyone else notices. This is exactly why patience isn't just a virtue in fundamental analysis; it's a necessity.
Ready to pair your fundamental analysis with powerful market sentiment data? Fear Greed Tracker provides real-time Fear & Greed scores for over 50,000 assets, giving you a unique edge in understanding market psychology. Visit us to see how sentiment analysis can sharpen your investment decisions.