
When you hear the term market volatility, what comes to mind? For many, it’s a word loaded with a sense of risk and uncertainty. But what does it actually mean?
Put simply, volatility is all about the speed and size of price changes in the market. It’s a measure of how dramatically an asset’s price swings up and down over a period of time. A market with high volatility is like a roller coaster, with huge peaks and valleys. In contrast, a low-volatility market is more like a gentle, rolling hill—stable and predictable.
Decoding Market Volatility
I like to think of market volatility as the financial world's weather forecast. Some days are calm and predictable, with minimal price changes. That’s your low volatility. Then you have the stormy days, where prices are all over the place, swinging wildly from one moment to the next. That’s high volatility.
It's a completely natural part of investing, something you can't avoid. These swings are just the market reacting to a constant stream of new information, economic data, and shifts in what investors are feeling.
Getting a handle on volatility is crucial because it has a direct line to your investment risk and potential returns. While it often gets a bad rap, volatility isn't inherently evil. It's a double-edged sword. Sure, it brings risk, but it also carves out opportunities. A volatile downturn, for instance, can be the perfect time to buy into solid assets at a discount, setting you up for stronger returns when things bounce back.
This infographic really nails the core ingredients that cook up market volatility.
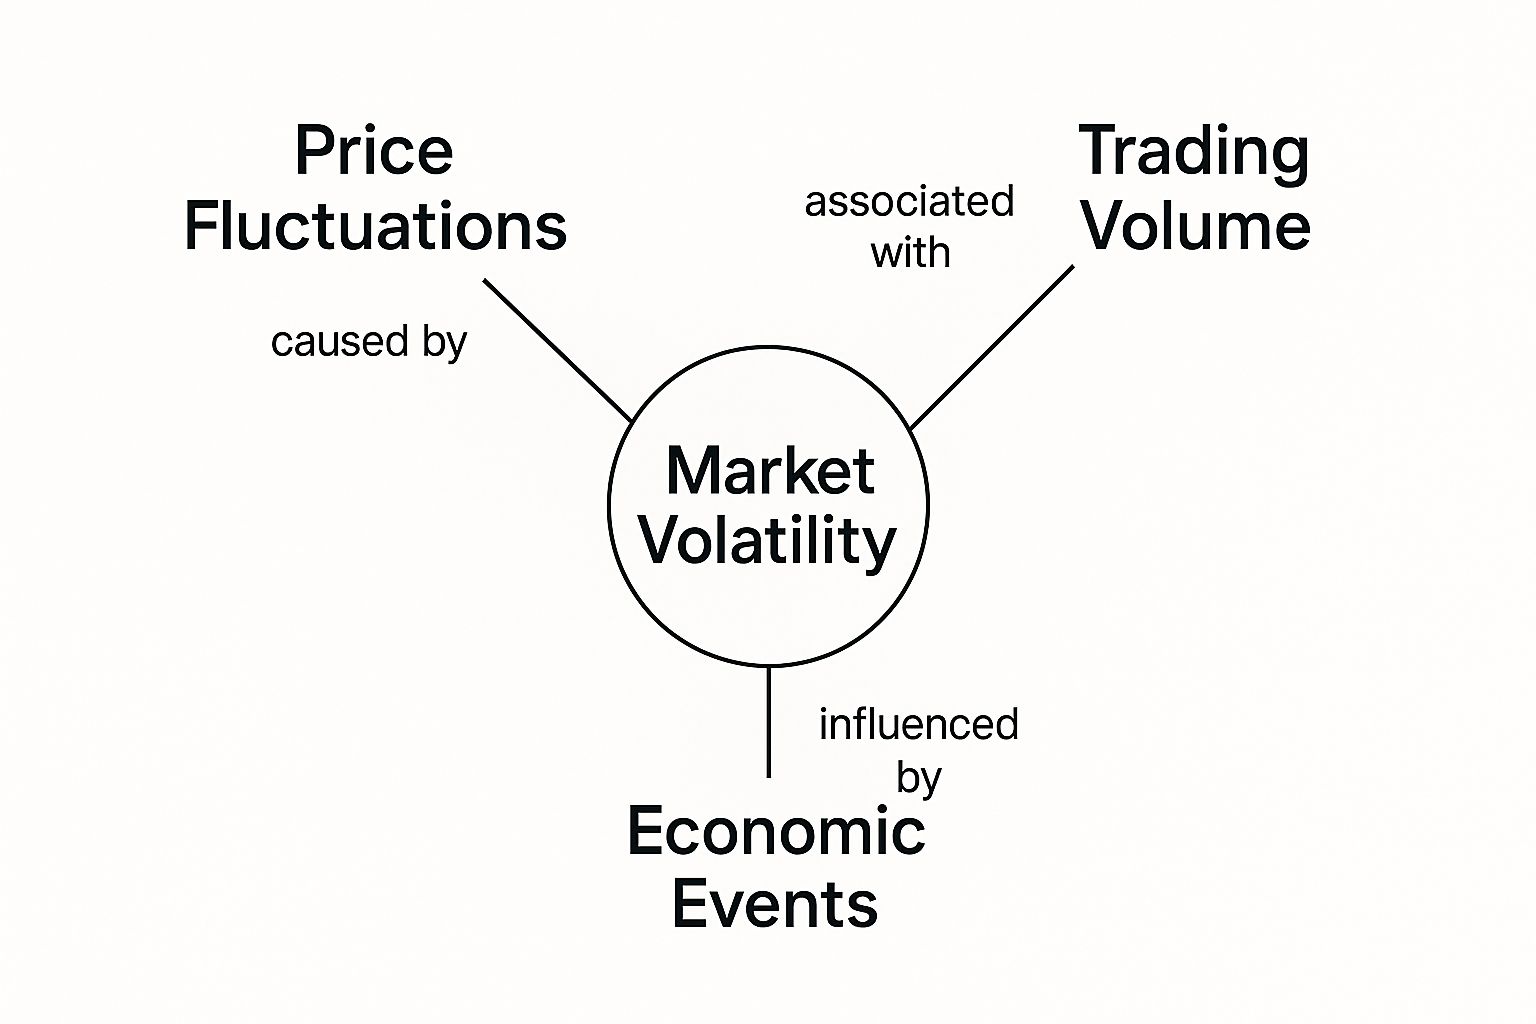
As you can see, it’s a mix of price movement, how much trading is happening (trading volume), and major economic events. They all feed into each other, creating the market dynamics we experience every day.
Low Volatility vs High Volatility At a Glance
To bring this idea to life, let’s put low and high-volatility markets side-by-side. Each environment feels totally different and calls for a unique mindset. Understanding these differences is key to staying prepared as conditions inevitably shift.
This table gives you a quick snapshot. You'll notice investor sentiment plays a huge role here. The mood of the market often dictates whether we're in for calm seas or a storm. It’s a fascinating topic, and you can get a deeper understanding of it by exploring what is market sentiment.
| Characteristic | Low Volatility Market (Calm Weather) | High Volatility Market (Stormy Weather) |
|---|---|---|
| Price Movement | Small, gradual, and predictable price changes. | Large, rapid, and unpredictable price swings. |
| Investor Sentiment | Generally optimistic or confident; lower fear levels. | High uncertainty and fear, or extreme greed and euphoria. |
| Trading Range | Prices stay within a relatively narrow, stable band. | Prices break through previous highs and lows frequently. |
| News Impact | Market reaction to news is often measured and muted. | Market overreacts to news, both good and bad. |
Seeing it laid out like this makes it clear just how different these two market "weathers" can be. Recognizing which one you're in helps you adjust your strategy and keep your emotions in check.
The Real Forces Behind Market Swings
Market volatility doesn't just happen. It’s the product of powerful, connected forces that can flip a calm market into chaos in the blink of an eye. If you want to understand why prices swing so wildly, you first have to get a handle on what’s pulling the strings.
At its heart, the market moves because new information changes what investors think is going to happen next. These shifts are usually sparked by a few major catalysts that act as the primary engines of volatility.
Economic Data and Central Bank Actions
Few things can jolt the market like a fresh economic report. Data on inflation, jobs, or economic growth (GDP) can send shockwaves through the financial world. An unexpectedly high inflation number, for example, is a huge red flag. It often signals that the central bank is about to step in and raise interest rates to cool things down.
That simple prospect—higher interest rates—makes it more expensive for companies to borrow and can put the brakes on consumer spending. In response, investors often start selling off stocks and other riskier assets.
Central banks, like the U.S. Federal Reserve, wield enormous influence. Their decisions on interest rates and monetary policy are some of the most powerful drivers of market volatility.
A single off-the-cuff remark from a central bank chair can shift billions of dollars in the market within minutes. It’s a stark reminder of just how dialed-in investors are to any clue about where the economy is headed.
Interestingly, there are clear patterns here. Research digging into three decades of market data shows that while volatility might dip on the day of a big economic announcement, it ramps up significantly in the months before and after a recession begins. This just goes to show the deep-seated anxiety investors feel about the future. You can dive deeper into how markets react to economic news in this detailed analysis.
Geopolitical Events and Corporate News
Of course, it’s not all about the economy. What happens on the world stage plays a massive role. Sudden geopolitical events inject a heavy dose of uncertainty, often causing a flight to safety. These events can include:
- Political Instability: An election with a surprising outcome or a major policy pivot can make investors incredibly nervous.
- International Conflicts: The threat of war or intense trade disputes sparks fears of disruption to global supply chains and economic growth.
- Natural Disasters: Major environmental crises can cripple entire industries and economies, triggering swift and sharp market reactions.
And it's not just big global events. News about a single company can create its own waves. A fantastic earnings report from a tech giant can lift the entire sector. On the flip side, news of a scandal or a flopped product launch can send a stock tumbling, dragging related companies down with it.
The Power of Investor Psychology
At the end of the day, markets are just people, and people are emotional. The collective psychology of investors—that constant tug-of-war between fear and greed—is a force strong enough to amplify volatility far beyond what the economic numbers alone would suggest.
When greed is in the driver's seat, good news can ignite a buying frenzy, pushing prices to levels that just aren't sustainable. But when fear takes over, even a minor piece of bad news can trigger a wave of panic-selling, causing prices to crash. This herd mentality is what fuels market bubbles and busts, proving that sometimes, what investors feel is every bit as important as what they know.
How Investors Measure Market Turbulence
Volatility isn't just a feeling of unease you get watching the market ticker. Professionals actually track it with specific tools, turning that abstract sense of chaos into concrete data.
When you can quantify market turbulence, you can move beyond emotion and make more calculated decisions. It’s like learning to read the market’s vital signs—it gives you a much clearer picture of its health and current mood.
One of the most common tools is standard deviation. It sounds a bit technical, but the idea is simple. It just measures how much a stock's price tends to stray from its average. A low standard deviation means the price is stable, like a calm river. A high one signals wild price swings, like a river hitting a patch of rapids.
The VIX: The Market's Fear Index
Looking at past performance is one thing, but what about the future? That's where the CBOE Volatility Index (VIX) comes in. You’ve probably heard it called the "Fear Index," and for good reason—it’s one of the most widely watched indicators of what investors expect to happen next.
The VIX basically represents the market's 30-day forecast for volatility in the S&P 500, and it gets this information from options prices. A high VIX means investors are bracing for big moves and buying up options to protect themselves. A low VIX, on the other hand, points to a sense of calm and confidence.
The VIX operates on a simple principle: when fear is high, the VIX rises, signaling a "risk-off" environment. When complacency sets in, the VIX falls, reflecting a more confident, "risk-on" market mood.
Below is a snapshot from the CBOE, the exchange that created the VIX, showing its real-time value.
This chart gives you an immediate gut check on the market's anxiety level. A reading above 30 generally signals high fear and uncertainty, while a reading below 20 suggests a more stable, less anxious environment.
Understanding Implied Volatility
The VIX is so powerful because it measures something called implied volatility. This isn't a look back at what has happened; it's a forecast of what investors think will happen. Think of it as the market’s collective best guess on how bumpy the ride will be over the next month.
Getting a handle on how this forward-looking metric works can give you a real edge. To go deeper, check out our guide that offers a full breakdown of how implied volatility is calculated and what it really means for your strategy. Once you understand these metrics, you can start to see market turbulence not as a threat, but as another piece of valuable information.
A Historical Look at Market Storms

The market's wild swings today can feel unprecedented and, frankly, pretty stressful. But a quick look back at history shows us something comforting: we’ve been here before. Market storms aren't a modern invention; they're a natural, recurring part of the investment cycle.
Seeing these past events for what they are—cycles of fear followed by eventual recovery—helps reframe what is market volatility. It’s not a signal that the world is ending, but a familiar pattern. This historical perspective is probably the most powerful tool an investor has. It teaches patience when everything inside you is screaming to panic.
The Great Financial Crisis of 2008
For an entire generation of investors, the 2008 financial crisis was the big one. It all started with a collapse in the U.S. housing market, but the fallout went global, fast. Banks started failing, credit markets completely seized up, and the fear was palpable.
The S&P 500 took an absolute beating, dropping nearly 57% from its 2007 peak to its low point in March 2009. It was a brutal, gut-wrenching ride that tested everyone. But here's the thing: those who held their nerve were eventually rewarded. The market didn't just climb back; it kicked off one of the longest bull runs in history. It's a stark reminder that even in the deepest, darkest crises, opportunities are born.
The big lesson from 2008? Systemic shocks cause extreme volatility, sure, but they also reset the board. For anyone with a long-term mindset, these moments can be incredible buying opportunities.
The COVID-19 Pandemic Crash of 2020
More recently, the start of the COVID-19 pandemic triggered one of the fastest, sharpest drops the market has ever seen. As the world locked down, uncertainty went through the roof, and the S&P 500 plunged over 30% in just a few weeks. It felt like the floor had just dropped out from under us.
But the recovery was just as stunningly fast. Massive government stimulus and central bank action acted like a defibrillator for the market, which bottomed out in March 2020 and then went on a tear, hitting new all-time highs before the year was even over. This was a masterclass in how external shocks can create intense—but often surprisingly short—bursts of volatility.
In the grand scheme of things, these chaotic periods are the exception, not the rule. A deep dive into 90 years of U.S. stock market data found that these high-volatility storms made up only about 10% of that time. Think back to early 2018 when the VIX spiked to 32%—it felt chaotic, but it settled down quickly. These bursts are typically temporary. You can dig into the data on these volatility patterns on ecb.europa.eu.
From 2008 to 2020, these historical storms all tell the same story. Volatility is painful in the moment, but markets have an incredible track record of resilience and long-term growth.
A Practical Toolkit for Navigating Volatility
It’s one thing to understand the theory behind market volatility, but it’s a whole different ball game when your portfolio is caught in the middle of a storm. Those big, stomach-churning swings can be alarming, no doubt. But with the right strategies in place, you can turn that fear into a structured, confident response.
Think of this as your practical toolkit—a set of go-to moves to help you stay grounded and keep your eyes on your long-term goals.
Build Your Foundation with Diversification
First up, and arguably the most important tool you have, is diversification. Consider it the shock absorber for your portfolio. Instead of piling all your cash into a single hot stock or one booming sector, you spread it out.
The idea is to own a mix of different assets that don't all move in the same direction at the same time. This could mean a blend of stocks from various industries, bonds, real estate, and maybe even commodities. When one part of your portfolio gets hammered in a downturn, another part might hold steady or even climb, smoothing out the ride.
Turn Volatility into an Opportunity
A disciplined investor can actually flip market volatility from a threat into an advantage. One of the most tried-and-true methods for this is dollar-cost averaging (DCA). It’s a simple concept: you invest a fixed amount of money at regular intervals, no matter what the market is doing.
When prices are sky-high, your fixed investment buys fewer shares. But when prices take a nosedive, that same amount of money scoops up more shares. Over time, this systematically lowers your average cost per share and takes the guesswork out of trying to time the market.
Dollar-cost averaging removes emotion from the equation. It forces a disciplined buying process, ensuring you are systematically purchasing assets when they are "on sale," which is key to long-term wealth building.
Another powerful technique is portfolio rebalancing. As time goes on, some of your investments will inevitably grow faster than others, knocking your original asset allocation out of whack. Rebalancing brings it all back in line. To dig deeper into this essential practice, check out our guide on what is portfolio rebalancing and why it matters for smart investing.
To put it all in perspective, here's a quick look at a few common strategies investors use to handle choppy markets.
Comparing Strategies for Volatile Markets
| Strategy | How It Works | Key Benefit |
|---|---|---|
| Diversification | Spreading investments across various asset classes (stocks, bonds, real estate) that react differently to market events. | Reduces portfolio-wide risk by ensuring that a downturn in one area doesn't sink the entire ship. |
| Dollar-Cost Averaging (DCA) | Investing a fixed amount of money at regular intervals, buying more shares when prices are low and fewer when they're high. | Removes emotion and the need to "time the market," lowering the average cost per share over time. |
| Portfolio Rebalancing | Periodically buying or selling assets to restore your portfolio to its original target allocation. | Prevents you from becoming overexposed to a single asset class and forces you to "buy low, sell high." |
| Hedging with Options | Using financial instruments like put options to protect against potential losses in your existing positions. | Acts as an insurance policy, limiting downside risk during periods of high uncertainty. |
Each of these strategies offers a different way to manage risk and even find opportunity when the market feels chaotic. The key is finding the approach that fits your personal goals and risk tolerance.
Master Your Mindset
Ultimately, your greatest asset during volatile times isn't a stock or a bond—it's your own mindset. The emotional tug-of-war between fear and greed can lead to terrible decisions, like panic-selling at the bottom or chasing hype at the absolute peak.
To keep your emotions in check, stick to a few core principles:
- Stay Informed, Not Obsessed: Keep an eye on market trends, but stop checking your portfolio every five minutes. This habit only fuels the impulse to react to every tiny dip and spike.
- Focus on the Long Term: Remember why you invested in the first place. Short-term volatility is usually just noise on the path to your real, long-term financial goals.
- Have a Plan: The best time to decide what you'll do in a downturn is before it happens. A solid investment plan is your anchor in a stormy sea.
History shows us that volatility is just part of the game. In 2021, for example, U.S. stock price volatility hit 24.99%. And if you look at data going all the way back to 1960, you’ll see massive spikes during every major crisis, confirming that external shocks are a primary driver of these wild swings.
Frequently Asked Questions About Volatility
Even after digging into the mechanics of market turbulence, you probably still have a few questions rattling around. Let's tackle some of the most common ones to really lock in your understanding and help you invest with more confidence.
Here are some straight, clear answers to clear up any lingering confusion.
Is Market Volatility Always a Bad Thing for Investors?
Not at all. While high volatility definitely cranks up the risk and can trigger some gut-wrenching short-term losses, it's also the very engine of opportunity. Without those price swings, there would be zero potential for significant returns.
For investors playing the long game, sharp downturns are just buying opportunities. Think of it as a flash sale on your favorite high-quality assets. And for short-term traders? Those big price movements are exactly what they're hunting for to turn a profit.
The goal isn’t to sidestep market volatility entirely—that's impossible. It's about managing it with a solid strategy that fits your own risk tolerance and keeps you from making fear-driven moves, like panic-selling at the bottom.
What Is the Difference Between Volatility and Risk?
This is a really important one. The two terms are related, but they're not the same thing.
Volatility is just a measure of how much an asset's price bounces around. Risk, on the other hand, is the much scarier danger of permanently losing the money you invested.
Here’s a great example: a well-established blue-chip stock. Its price might be volatile for a few months thanks to market noise, but the risk of that company actually going bankrupt and your investment hitting zero is incredibly low. Conversely, a seemingly "stable" asset could secretly be carrying a massive risk of becoming worthless if its underlying business is a house of cards.
High volatility can amplify short-term risk, but they are absolutely not interchangeable.
How Can I Protect My Retirement Portfolio from High Volatility?
Protecting a long-term portfolio, like for retirement, really comes down to a few core, time-tested principles. It’s much less about reacting to every market twitch and more about building a sturdy foundation from the start.
Here are three key strategies to put in place:
- Thoughtful Asset Allocation: Get your mix of stocks, bonds, and other assets right for your age and when you plan to retire. As you get closer to that date, you’ll likely want to shift toward less volatile assets to lock in your capital.
- Widespread Diversification: You’ve heard it a million times: don't put all your eggs in one basket. Spreading your money across different industries, company sizes, and even countries acts as a powerful buffer, so a crisis in one area doesn’t sink your entire portfolio.
- Unwavering Discipline: This might be the hardest part, but it's also the most critical. Create a solid investment plan and just stick to it. Fight the urge to make drastic changes based on screaming headlines or a few bad days in the market. A good financial advisor can be a huge help in building and maintaining that discipline.
By focusing on these foundational pillars, you can build a portfolio that's designed to weather the inevitable storms and keep you on track toward your long-term goals.
To truly get a handle on market swings, you need the right data. Fear Greed Tracker gives you real-time sentiment scores for over 50,000 assets, letting you see past the noise and spot opportunities when fear is high and assets are cheap. Stop guessing and start making data-driven decisions by visiting https://feargreedtracker.com.